``One of the mysteries of human society is how we interact with each other. We’re an empathic species. When you have emotions, I see it in your face and I feel the same emotions. That means we kind of move as herds. And so when other people are getting excited and they are talking about the market, it gets me excited too. You can't stay above it. If you are human, you get drawn in. But then when the emotions start changing, you get drawn into that too. And the emotion does seem to be changing. It looks like we're at the beginning of a change in psychology”- Robert Shiller on the Housing Market, Yale Professor, Author Irrational Exuberance
Now the realization of a slowdown in the US real industry is one of the headwinds I have written and warned about repeatedly. Today, such trend appears to be snowballing and could have unmeasured ripple effects throughout the world economy and the financial markets. As demonstrated in Figure 1 from Merrill Lynch’s David Rosenberg, the chart of the NAHB Housing Index vs. S&P 500 lagged by 12 months, which incidentally has a correlation factor of an incredibly strong 79%!!!
Figure1: Merrill Lynch David Rosenberg: NAHB Housing Index vs. S&P 500
Analyst John Maudlin, citing Rosenberg’s studies noted that (emphasis mine) ``seven of the last ten housing downturns foreshadowed an outright economic recession. The lead time was long - about 20 months. The three housing downturns that did not precede a recession presaged a discernible slowing in overall economic growth within a year of the peak in starts, on average.”
Since the US housing industry has allegedly peaked in August of 2005, which makes it about a year ago, 20 months suggests of an impending US recession by the 2nd quarter of 2007. And US equity markets, given the strong correlation shown above, could trace the activities of the housing markets as Mr. Rosenberg suggests.
Since the world’s financial markets have been manifesting increasing degree of interconnectedness, the probability is that any significant downshifts in the US equity markets would reverberate to the world markets, including that of the Philippine Composite Index. Over the past quarter as shown previously, the Phisix has closely tracked the movements of the benchmark US S & P 500.
Now before anybody gets petrified by the prospects of a worldwide markdown of prices led by the US and go into a panic stricken selling spasm, there are two important factors one has to take in account, in my view, in reckoning of the future activities in the domestic market.
I say domestic because even as markets today have been strongly correlated, I think there will an eventual decoupling in the future from the trends of the US market, if one were to take into account the present cyclical phase of the domestic market cycle if not the region’s cycle led by Japan’s Nikkei.
Figure 2 Barry Ritholtz: 100-year chart cycle of the Dow Jones
Analyst Barry Ritholtz in his blog points out that since 2000, see Figure 2, the present secular phase of the US equity markets, as measured by the Dow Jones Industrial Averages, despite the recent uptick (in 2003) has been DOWN or has been in a BEAR market phase.
Besides, it takes a lengthy period of time of about 17-20 years for these secular phases to shift from peaks of overvaluation to the chasms of undervaluation. This suggest that any shift towards a new secular bullmarket in the US will probably begin somewhere near the latter half of the next decade. For the time being, as the chart suggest, US equity markets could likely either consolidate (rangebound) or decline.
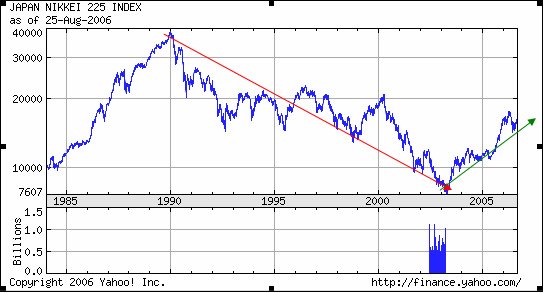
Figure 3 Yahoo!: Japan’s Nikkei 225
In the same context, we see in Figure 3 Japan’s Nikkei 225 in a declining secular phase for about 13 years, from peak-to-trough, as shown by the red arrow. Today, the Nikkei 225 has rallied from its 2003 low of about 7,600 and appears to be treading in a secular advance phase.
What this implies is that the Nikkei which is coming off from the pit hole in 2003 is unlikely to head lower or decline in excess of its previous depths but could possibly trade sideways (which translates into a pause in the advance phase) or decline marginally but not to exceed its 2003 bottom level (or present market cycle could suggest of an extended bottoming out) as the US markets tails off. These historical divergent paths as manifested by the valuations of Japan’s key equity benchmark could be indicative of an eventual disconnect.
Figure 4: What you see depends on where you stand! The Phisix Cycle
In a same plane, the Philippine Composite Index manifests of similar transitional phases as shown in Figure 4. It took the Phisix about 10 years from trough-to-Peak to cap its advance cycle from where the Phisix skyrocketed from about 150 to 3,300 to gain by (take note)...21 times! Think about it; if a boom given the same magnitude as in the past would be replayed into the future, this should translate to a Phisix at 22,000! Impossible you say? Look closely at India’s BSE 50 in Figure 5.
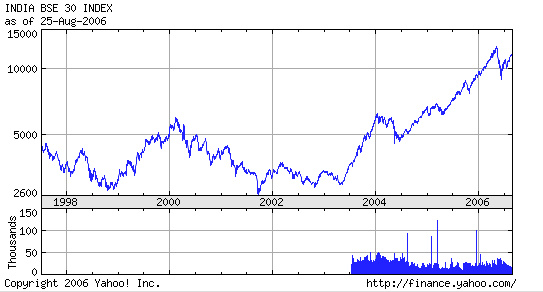
Figure 5 Yahoo! India’s BSE 30
From a bottom of around 2,600 India’s BSE has risen over threefold to over 12,000 (in May) in just three years! No markets or trends go in a straight line though. But given the continuity of the present momentum, the longer picture looks favorable for India’s BSE to further carve new heights under the auspices of its sustaining its economic growth clip buttressed by a backdrop of liquidity friendly investing landscape.
Booms are usually characterized by having new record high price levels. To quote Dr. Marc Faber in his book Tomorrow’s Gold (emphasis mine), ``The longer a trend has been in place, the more time will be required after the turning point before the changes are perceived, even if the new investment themes immediately enjoy a very powerful bull market.” In essence, it takes time (again!) for the investing public to realize a change in psychology which prolongs, deepens and intensifies the trend (see market action below).
This is not however to suggest or predict that the Phisix would hit 22,000, although given the cyclical aspects of the present market, such probability could not be discounted. My point is, if indeed I am correct to assess that the underpinning of today’s market cycle as thriving at a secular advance phase, sometime in the near future, the Phisix would most likely take out its recent high of 3,300. And like India’s BSE, a new high price record will be set. That is what cycles are all about.
Going back to the Phisix, since it peaked in 1997 alongside our neighbors and segued into its declining phase triggered by the ‘Asian Crisis’, the benchmark fell by about 70% to a bottom of about 1,000 in 2003 or in about 7 years. This makes the entire trough-to-trough cycle of the Phisix to about 17 years. Of course, our scant records could hardly be used as sufficient grounds to make a trajectory. But if history would do a reprise then we could about 6 to 7 years before the market tops out.
The Phisix today, like Japan’s Nikkei appears to be coming from the low side, if one reckons from the recent milestone bottom. This makes an unlikely path for the Philippine benchmark to decline more than its previous threshold low. Aside, the Phisix compared to other emerging markets has had a modest advance during the US FED inspired liquidity driven asset boom years since 2003 relative to its peers.
In addition, I expect the market-supportive politically-motivated policies of global central banks led by the US Federal Reserves to maintain a continued lax or loose liquidity environment, since a significant segment of the world economy have been driven by the financial markets, through what we call the “wealth effect” or ``an increase in spending that accompanies an increase in wealth (in absolute terms), or merely a perceived increase in wealth (in relative terms), according to the definition of Wikipedia.org.
Another factor that could temporarily diminish the negative ramifications of the declining housing industry in the US is of “market action”, or the continued denial by the public that such adverse events would translate to equally unfavorable implications to the financial markets. In other words, it is all about market psychology. In the words of guru John Hussman of the Hussman Funds (emphasis mine), ``When a concept is widely believed by investors, they may not abandon it immediately, so it's important to gauge the amount of “sponsorship” they throw behind it. That broad analysis of investor sponsorship and the broad quality of market internals goes into what I refer more concisely as “market action.””
Put differently, if the psychology of the investing public or if Wall Street remains inexorably tilted towards the purview of favorable market action, and most importantly if such optimism is backed by the wherewithal to do so, then the markets may, in defiance to these “negative” developments, continue to rise. And the likelihood of the continued provision of cheap capital gets closer by the day as signs of weakening in the US economy may prompt its monetary authorities to relieve the pressures built by its recent moves and move to postpone the day of reckoning. As Mr. Hussman advises, ``we can’t simply ignore or trade against the market’s various “themes” or concepts just because we believe they’re wrong.”
Of course, one would argue that US rate cuts would translate to an open admission of an ongoing US recession, as economist Gary Shilling notes ``With only one clear exception in the mid-1990s, central bank ease since the mid-1950s means the economy is in a recession, or will be within a few months” and that such would imply muted growth prospects for emerging market economies and in effect, would be baneful for its equity assets. However, it is my view that since markets have been propelled by liquidity in 2003 and thereafter, for as long as these liquidity injections remains voluminous enough to offset any intervening economic weaknesses, asset classes would likely find a floor and most probably start to rise anew. Where else would all these excess money go anyway? Although, inflation signals would likewise rear its ugly head anew overtime.
Finally, there have been increasing debates among the experts today tackling on the supposed decoupling of Asia from the US, given the present US housing led downdraft. A majority of which have stated that Asia, at its present framework, appears unprepared to depend on its own. As an investor myself, I would stand aside the polemics and watch market signals to see whether such disconnect would transpire or not. My bet is, considering how the market cycles are operating, is that in the future they will. 


No comments:
Post a Comment