``A man can fail, but he isn't a failure until he blames someone else." J. Paul Getty, industrialist
Now to the bad news. With more evidences emanating from a considerably softening US real estate industry percolating into a wider spectrum of its economy, market signals appears to be gradually confirming risks of an accelerated decline which may surprise the “goldilocks” outlook espoused by mainstream market participants.
First, the rallying global bonds appear to be well underway indicating future liberal policies in the face of the prospects of more intensive economic decline. Recall, that the bond markets lead the Fed policy directions as we previously tackled in our past editions. According to the well respected independent research outfit BCA Research (emphasis mine), ``There is scope for further downside in yields as the market brings forward its expectations of Fed rate cuts in response to the faltering U.S. housing sector, and as global growth slows. While all major bond markets will stay in rally mode, U.S. yields will fall relative to the rest of the G7, as is typically the case during Treasury rallies. Bottom line: stay bullish on global bonds, and overweight the U.S. market.”
BCA thinks that there is room for a deeper decline in bond yields and that the bond markets have been positioning in anticipation that global central banks led by the US Federal Reserves will trim rates in the future. If this outlook should hold true, trimming of rates by the Fed has been typically associated with or in reaction to a contraction or a recession!
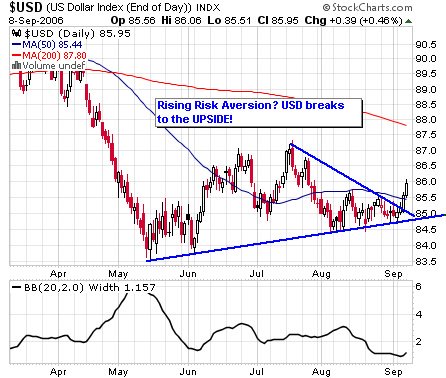
Figure 3 stockcharts.com: US dollar breaks to the Upside!
Second, the US dollar broke on the upside following a rangebound activity as shown in Figure 3 for most of the August until last week. The Bollinger band on the lower window denotes of low volatility over the same period. And low volatility implies upcoming heightened volatility, in which case, the current upside breakout could signify a nascent upside trend for the US dollar.
According to Morgan Stanley’s Currency analyst Stephen Jen, ``Investor risk-reduction could ‘turbo-charge’ the dollar and, ironically, lead to dollar strength…we think that the dollar could actually rally in a deep recession.” In the present setting, a strong US dollar supported by rallying bonds amplifies the case of a severity of a potential hard landing.

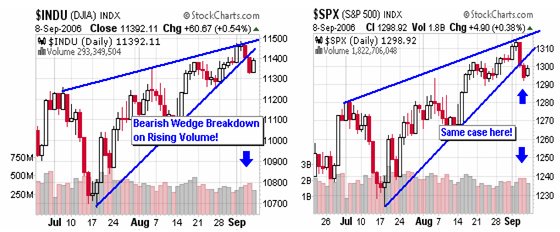
Figure 4 stockcharts.com: End of A Summer Rally?Third, major US equity benchmarks as shown in Figure 4, appear to have broken down synchronically from their bearish rising wedge formation, as the summer season ends.
Moreover, the conventional fashion of the recent breakdown had been accompanied by higher volume giving strength to indications that such downside moves could in most probability, continue. The apparent erosion of the strength from the bulls lends credence to the seasonal infirmities of September for US equities.
Figure 5: stockcharts.com: WTIC Breaksdown!
Fourth, oil prices have likewise broken down from its 3 year trendline as shown in Figure 5. Is it the end of the bullmarket in Oil? Over the long horizon...I doubt so. But the present motion certainly seems to corroborate the view of the possible reemergence of a “risk reduction” trade.
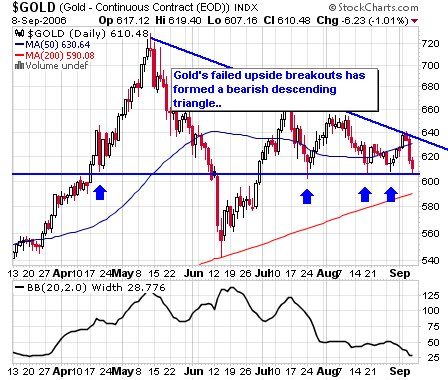
Figure 6: stockcharts.com: Gold breaking down too?
Lastly, gold prices despite having rallied early last week appeared to have succumbed to the prevailing dour sentiment in the financial markets. During the last three sessions, gold declined to test on a major support level at $607 for the fourth time in three months on Friday, as shown in Figure 6 (blue arrows).
Nonetheless, despite the bullish end of year seasonality outlook which favors higher prices for gold, the interim technical picture reveals of a trend pattern of lower highs and a flat support level. This “descending triangle” pattern translates to losing vitality for the bulls to lift its prices, while on the other hand allowing the bears to accrue more momentum in their favor to wrest control of gold’s price direction.
Further, the low volatility on the lower window of the chart appears to support the case of a forthcoming big swing! Either Gold breaks to the upside, over and above the $640 level to expunge the bearish pattern or it breaks down from $607, the latter of which is more likely given the uniformity of signals emitted by the cross-asset class benchmarks.
The bears may even lead gold to test its previous low of $540 where I believe potential support from the seasonality factors or physical demand would step in. I strongly suspect too of the Europe’s Central banks unseen hands in the recent decline with the close of the European Central Bank Gold Agreement on its calendar year which ends on the 26th of September. You see, central banks have the motivation to “manage” our inflation expectations by keeping a lid on Gold’s prices among other measures as altering statistics to suit their needs.
However, over the long run, I remain bullish on gold even as present trends appear not to be supportive of its short-term case. Anyway, no trend goes on a straight line.
In the same context, despite the recent gains of the Phisix, we see that the risks levels have risen enough to merit once again raising cash as to preserve capital in the assumption of a furtherance of these recent trend signals. It remains to be seen if the domestic equity benchmark and the peso could withstand, be insulated and diverge from the potential untoward developments in the financial markets abroad.
For the moment it looks like that the deflationist camp is getting ready to open the champagne bottles. 


No comments:
Post a Comment