``Nixon Administration officials were convinced that cutting the dollar's tie to gold and devaluing it against other currencies would increase our exports, slash imports and give us a fabulous round of prosperity. Instead, unhinging the dollar from gold gave us more than a decade of debilitating inflation, catastrophic increases in the price of oil and record-high interest rates.”-Steve Forbes
Well today’s rising oil prices is coming amidst further signs of deterioration in the

Figure 3: Economist: Spiraling Housing Inventories
According to the

With manufacturing showing signs of corrosion, would the Austrian’s viewpoint be re-affirmed again?
Of course, mainstream analysts usually base their comments from the framework of demand-supply dynamics, from which we do not dispute. However, our concern is today, can oil prices rise amidst an economic slowdown?
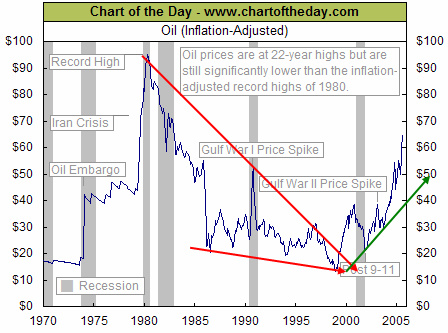
Figure 5 Chartoftheday: The Long term Oil cycle
The answer is yes, depending on the condition. So aside from the fraying state of the purchasing power of the US dollar, decreased demand can be cushioned by---an even faster rate of decreasing supplies!
I’d like to bring back an old chart from Chartofthday.com, which shows of the thirty year horizon and the previous declining oil cycle. As indicated in Figure 5, Oil has undergone a massive declining phase for about TWO decades, prior to the present upside cycle. The present cycle, of course, doesn’t indicate exemptions from obstacles as any trend does. The 2000 recession did bring oil prices down temporarily, but such decline was apparently utilized as a springboard for establishing new highs!
A serious ramification to these developments have been the inability of Western major oil companies to replace their reserves, according to analyst Sean Brodrick, ``the Western oil majors — like ExxonMobil, Chevron, BP, and Shell — are failing to replace the reserves they pump. In 1997, they were able to replace 140% of their reserves; in 2005, they were able to replace only 75%! This indicates just how hard it’s becoming to find oil. Everyone’s trying to grab what they can, while they can. And as you know, limited supply will likely equal higher prices going forward.”
Yes, because of ongoing global trends of nationalization of the industry. For instance, in
In addition, ``Last month, Russia threatened to revoke permanently the operating licenses of Western oil majors in the Sakhalin-1 and Sakhalin-2 project, while state-controlled Gazprom is excluding all foreign (notably Western) energy majors from its giant Shtokman gas project” adds Sean Brodrick of MoneyandMarkets.com.
According to analyst Martin Spring, ``Russia is extending its ownership of and control over natural resources and other industries regarded as strategic, as well as buying companies in other countries giving control over markets, such as pipelines and refineries.
There is also the unfolding phenomenon of utilizing domestic natural resources as political leverage for expanding political power. According to analyst Mr. Spring, ``Countries with large commodity reserves are increasingly using them to apply political leverage to achieve national aims. 85 per cent of the world’s oil reserves are effectively under state control.”
As Russia recently surpassed Saudi Arabia to become the world’s largest producer of oil and gas, according to Mr Brodrick, ``it’s ripping up contracts and forcing new deals on customers from Western Europe to the Asian steppes. The country uses its muscle to reward allies, like
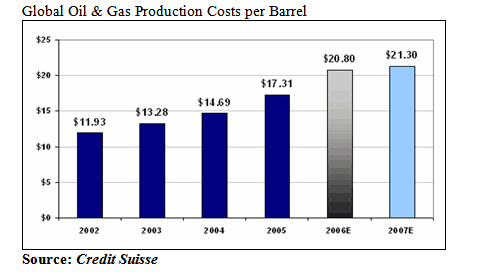
Figure 6: US Global Investors: Rising Production Cost per Barrel
An added dimension would be the rising cost of production as shown in Figure 6!

Figure 7: WTRG Economics: World Rig Count
According to WTRG Economics, ``International rig count, which excludes the
On the other hand, rig deployment level, while below the record numbers of the 1980s are at 15 year highs.
Yet, the technologically challenged oil rigs have been due to years of underinvestment, let me quote DBS Vickers, ``there has been massive underinvestment in rigs. Only 24 units were built since 1993 and only 40 units were built in the last 20 years. Thus, about 85% of the jackups rig fleet is older than 20 years. Currently, there are about 42 units under construction. However, including normal attrition, the jackup fleet could well remain flat over the next 2-3 years.”
Nonetheless, despite the massive deployment of rigs, only a handful of discoveries have been made, the largest of which have been at the
An additional constrain would be increased environmentalism which is doubling the lead time to operate these projects.
So as capital or required investments are diverted away due to increasing trends of political interference, aside from prospective supplies equally hampered by infrastructure shortages and production bottlenecks, the demand equation is unequally met by diminishing supplies!
No comments:
Post a Comment