The
problem is that fear is a negative, dangerous, and potentially
explosive emotion. It can easily morph into anger and violence.
Exactly where it will lead is unpredictable, but it’s not a good
place.—Doug Casey
In
this issue
Phisix 6,700: Ferocious Bear Market Rally Pump; 4Q and 2015 GDP’s Cosmetic
Numbers
-Global
Acute Stress Response: From Flight to Fight or From Fear to Greed
-Fight
or Flight: The Fading Effect of Central Bank Magic on Global Equities
-From
Flight to Fight: Phisix Race to 6,700 was a Product of a Coordinated
6 Issue Pump!
-Bear
Market Rally: Big Weekly Gains Signal More Volatility Ahead!
-January
Bear Market Losses Presages NEGATIVE Annual Returns!
-The
Direction of GDP is NOT EQUAL to the Direction of PSEi!
-4Q
and 2015 GDP Improvements were Principally Based on Price Deflators!
-2015
GDP: Soaring Credit Intensity Underscores Heightening Credit
Fragility
Phisix 6,700: Ferocious Bear Market Rally Pump; 4Q and 2015 GDP’s Cosmetic
Numbers
Global
Acute Stress Response: From Flight to Fight or From Fear to Greed
Don’t
you know that fear can actually be source of violent reactions via
the survival instinct called “flight
or fight” response or the “acute stress response”?
If
you haven’t noticed, the magnified upside and downside volatilities
encompassing today’s marketplace looks very much like ‘flight or
fight’ or acute stress responses. And why shouldn’t there be
vehemence, when financial markets have essentially been utterly
deformed in order to serve the interests of political agents and
their cronies?
Moreover,
‘acute stress response’ also underscores the path of contemporary
monetary policymaking.
Essentially,
former Fed chief Ben Bernanke’s prescription that “History
proves, however, that a smart
central bank can protect the economy and the
financial sector from
the nastier side effects of a stock market collapse”
has emerged to become a de facto central bank standard to avert
‘deflation’ or an economic meltdown.
And
panicking central bankers have been all over during the past two
weeks in the frantic attempt to quash the ‘flight’ from acute
stresses in risk assets.
ECB’s
Mr Draghi dangled more subsidies to the stock market in citing that
they will “review - and possibly reconsider - monetary policy at
the next meeting in early March”, the previous week.
Meanwhile,
the Chinese government announced that they had injected a record
liquidity in three days of market operation last week to the tune
690 billion yuan (USD$ 105 billion). Media imputes such infusion
to the coming New Year week long holidays. But the holidays are
slated for February
8 to 13, which means next will see normal operations. And the
likelihood is that the PBOC will inject more.
Thus
I predicted last week,
So
with central banks behind their backs, and provided that the central
bank magic can be sustained, then
this should be a big week for the bulls.
For
the BOJ, the experimentation with negative real rates means that all
the previous QEs have virtually failed!
In
the marketplace, the failure to satisfy consumers would lead to
financial losses. Sustained losses would induce insolvencies and or
to the cessation of operations or the closure of the enterprise.
And
peculiarly, on January 21st, Mr. Kuroda went on air to
deny the BoJ’s adaption of the NIRP, only to reverse this
stance after a week or on Friday the 29th. Yet on the day that Mr
Kuroda denied the NIRP, the Nikkei plummeted to its lowest since one
year ago or in January 2015.
After
the ECB enticed the stock market with possible easing this coming
March, rumors were rife that the BoJ would follow, hence the stunning
one
day 5.9% rebound on the 22nd!
Of
course, such policies were imposed in the name of the economy, but in
reality such has been nothing less than another designed subsidy for
the financial sector, the foreign exchange earners, and the
government.
Media
have jumped the gun on the BoJ to ease. One such outrageously
laughable example of desperation: “They
could buy ketchup, throw money out of helicopters,” said Eiji
Kinouchi, chief technical analyst at Japan’s second-largest
brokerage. “The possibilities are limitless. People are always
saying the BOJ has run out of options, but they’re wrong.”
Yet
if inflationism would have no adverse impact on the economy, then
central banks would no qualms to do this, and more importantly, they
would have already done this. Moreover, central banks would cease to
exist as governments will appropriate on its role, since this means
free lunch for political spending! Government’s buying of ‘ketchup’
represents a fiscal activity.
As
the late great Austrian economist Ludwig von Mises presciently
warned,
Public
opinion is utterly wrong in its appraisal of the phases of the trade
cycle. The artificial boom is not prosperity, but the deceptive
appearance of good business. Its illusions lead people astray and
cause malinvestment and the consumption of unreal apparent gains
which amount to virtual consumption of capital
Fight
or Flight: The Fading Effect of Central Bank Magic on Global Equities
The
Nikkei 225 added
3.3% over the week, 85% of which came from Friday’s NIRP sponsored
2.8% jump!
While
I expected this to be a big week for the bulls, much had been
realized, but it hasn’t been true for some.
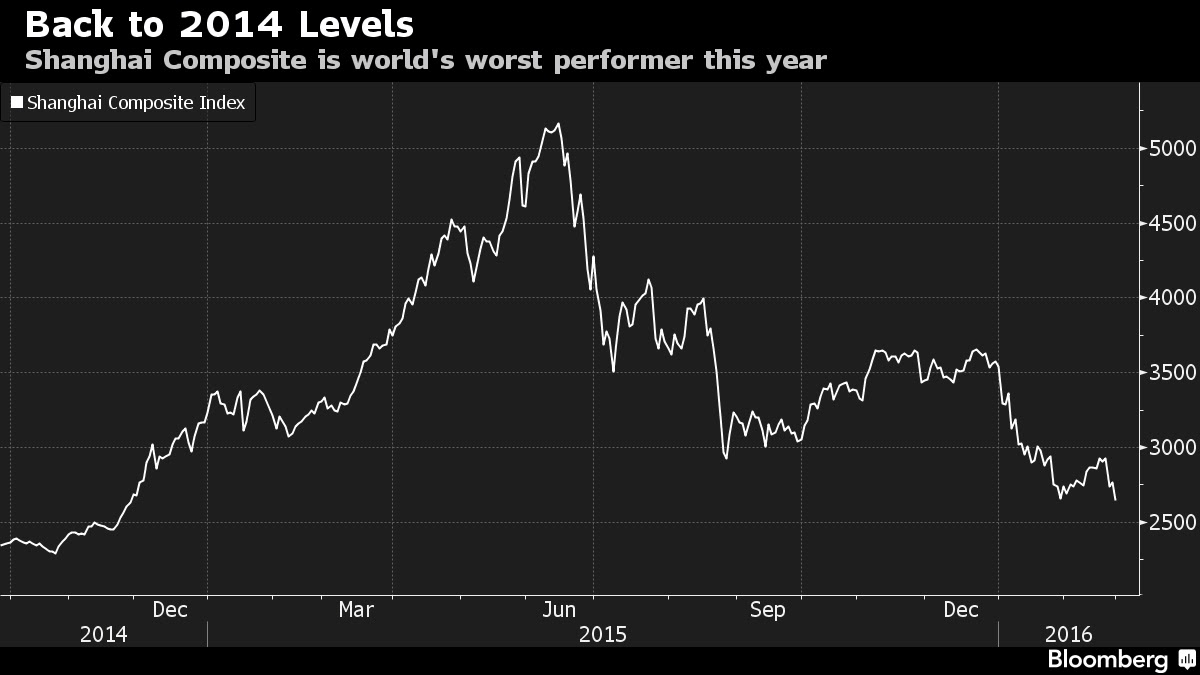
At
the close of Thursday, the Shanghai
index was down by a staggering 9.23% over the week! Nevertheless,
severely oversold conditions abetted by the BoJ’s NIRP prompted the
Shanghai Index to recover by 3.09% on Friday. The recovery trimmed
the week’s heavy losses to 6.14%. Year to date, or for the month of
January, the Shanghai index lost an incredible 22.65%!
At
Friday’s 2,737 level, the Shanghai Composite Index has plunged to
November 2014 levels!
Remember
that the Chinese stock market bubble has its roots on the 2H of 2014.
Prior to the bubble, the Shanghai index was adrift at a listless
2,000-2,500
range
since 2012. This means that the current bear market has eviscerated
nearly all of its bubble gains
from when it hit a high of 5,166 in June 12 2015. Easy come, easy go.
It’s
a wonderful example of what I said as the bust will be roughly
proportional to the imbalances acquired during the inflationary boom
And
as a showcase of how bear market rallies can be significant and
equally ferocious, overtly buttressed by the National Team, the key
Chinese equity benchmark surged
by 24%
from the ‘lows’ of August 24 to the ‘highs’ of third week of
December 2015! Yes 24%! But when bears’ reasserted dominion late
December, gains from fierce bear market rally was more than entirely
lost in a matter of a little over a month! (attention PSE bulls)
Europe’s
equities diverged. Most of Europe’s stocks rose but gains were
unimpressive. And there were even some exceptions. (I wanted to post
charts but given the space constraints I am unable to do so)
Despite
the BoJ’s NIRP inspired Friday’s 1.64% rally, the German
Dax was up by just a puny .34% over the week! And as of Friday,
and even in the wake of the ECB’s promise, the DAX has just been
off by a measly 4.3% from the January bear market lows.
Remember
that the
ECB imposed NIRP on June 2015. Yet the gains or honeymoon period
from the ECB’s NIRP had been a fleeting one. The DAX rebounded by
about 9.9% from the ECB’s NIRP, which peaked in about a month or in
July 2015. From then, the Dax stumbled gradually, then suddenly
(Hemingway effect) to current levels.
My
point is that these central bank policies to subsidize the stock
markets via monetary policies, as shown by the experiences of Japan,
China and Germany, have conspicuously been increasingly
afflicted
by the laws
of diminishing returns.
The
narrowing
windows of gains only punctuate on the risk of severe or dramatic
downside ‘flight’ actions overtime. Yet central banks refuse to
heed reality. But they continue to focus instead on the short term.
The result should be the worsening of the unintended consequences
from present day ‘rescue’ actions.
Meanwhile,
not even the BoJ’s NIRP seems enough.
Italy’s
benchmark, the FTSE MIB Index, even sank by a hefty 1.95% over the
week, mostly on banking stocks. Reason? The Italian government’s
organized bailout of four small banks last December has reportedly
hit a snag as many have been pulling out from Italy’s banking
system: “The
value of Italy’s third-largest bank has plummeted by 60 percent
since the start of this year. There are signs many are pulling money
out of Banca Monte dei Paschi, out of Italian banks, and out of Italy
in general. Even if the nation is not hit by a banking crisis
imminently, the dire situation in Italy’s banks and its whole
economy could still cause a financial disaster in Europe that would
reverberate around the world.”
Moreover,
Italy’s banking crisis reveals to us of the world’s manifold
economic financial tinderboxes which only exhibits on the exceptional
fragile conditions of global finance today.
Yet
in the face of the ECB’s ‘review and reconsider’ of the easing
policies in March, the backpedaling of the FED, the PBoC’s record
injections and the BoJ’s surprise NIRP, central bank magic has not
been weaving as much of its desired effect on global stocks as it had
been before.
While
there may be residual vestiges of the BoJ NIRP’s honeymoon effect,
given this week’s asymmetric responses, signs are that last two
week’s central bank panacea may not last. Perhaps not even a month.
If
so, in the next transition from fight to flight, then this would mean
that the ensuing cascade should be sharp and fast as central banks
have effectively lost control!
From
Flight to Fight: Phisix Race to 6,700 was a Product of a Coordinated
6 Issue Pump!
The
‘acute stress response’ syndrome has been evident on the PSEi.
What do you call an 11.08% collapse in 3 weeks that was followed by a
stunning 7.72% spike in one week?
Has
this not been a transition from flight to fight?
Given
the massively oversold conditions, combined with central bank
actions, a rebound was to be expected
As
I wrote last week: The
3 consecutive weeks of severe broad market losses may be a record of
sorts. And they likewise could be indicative of the substantially
oversold conditions. Realize that no trend goes in a straight line.
The question is whether the coming bounce would be tradeable or not.
Or will attempts to trade them become equivalent to catching falling
knives.
One
may add to ingredients of the rally the GDP pretext and of the month
end window dressing, nonetheless the behemoth rally.
Additionally,
it shows how the cornered, beleaguered and ego-bruised bulls can
mount an equally seismic and passionate desperation rebound.
The
miffed bulls seem to say: Greed can more than match fear, pound for
pound, volatility for volatility, mano a mano!
And
with remarkable ferocity, the bulls rammed
through the various resistance levels to more than reclaim the 6,500
bear market threshold level. And the Phisix has suddenly returned to
the trading range carved out of the August 24 meltdown.
For
now, the Phisix looks likely to test a key resistance level at 6,800
set by the upper trend channel.
As
noted earlier, stretched oversold conditions, backed by rallies
abroad from promises to ease by the ECB and the BoJ, add to this the
domestic pre GDP (announcement) plus window dressing, bulls came
wildly swinging at the week’s opening.
I
have long
pointed out here of the GDP week stock market pump or dump. The
premise of this “pre GDP week” play has been that 2-3 day actions
at the PSEi, prior to the announcement, should serve as the
noteworthy barometer for the direction of GDP. A modest pump means
that GDP will be within the expectations. A mega pump means that GDP
will exceed expectations. A dump means that the GDP will underperform
expectations.
Except
for the August 2015 meltdown, which interrupted the 2Q GDP
announcement, previous three GDPs in 2H 2014 to 2015 plus last week’s
pre-disclosure activities exhibited the same dynamics.
Well
considering how rampant price fixing activities in the domestic stock
markets, despite so-called pat
on the back “reforms”, it’s easy to construe that such
actions may have likely emerged from insider tips.
It’s
only in the Philippines where closing prices function like a Viagra
with regularity!
While
it has been true that severely oversold conditions provided the
fulcrum for the massive reflexive recoil, the shift from excessive
fear to extreme greed via the 7.72% rip more than meets the eye.
From
the surface, the previous biggest industry losers were this week’s
biggest winners (upper window). So the battered holding and property
sector plus services produced the largest gains.
On
first thought, this should be the natural or intuitive reaction.
But
wait, that’s not entirely the picture from last week’s trading
activities.
Broken
down into the weekly performance of the PSEi component issues, the
general rule last week seemed: the bigger the market cap share, the
bigger the pump, therefore the best returns (see above left red
rectangle)!
Understand
that the top 5 issues control 38.46% of the PSEi basket. Expand this
to include the top 10, then the effective market weight share
balloons to an incredible 65% of the benchmark index pie. So
movements of the top 5 will be enough to materially sway the index in
either direction. Yet how much more the top 10?
Yet
the table above shows that only
6 issues belonging to the top 7 biggest market cap share delivered
about 10% or more for the week! These
6 issues accounted for 43.63% of the PSEi weighting as of Friday. All
the rest with the exception of the ‘laggards’ underperformed.
And
except for one issue SCC, which was the week’s sole loser, 29
issues rose.
So
the dispersion of the gains had been heavily tilted towards the top 6
of the 7 biggest market caps.
Said
differently, this week’s mammoth 7.72% push or the race to 6,700
was largely a product of a coordinated and synchronized pump focused
on 6 of the7 biggest market cap issues.
Yet
what’s so special with these 6 mature and ridiculously overpriced
firms?
The
exceptions from the general rule were the striking upside price
spirals of some of the previously battered issues like SMC (21.5%),
Bloom (19.88%) and PCOR (16.91%).
So
oversold markets created conditions for the bounce, but the
concentrated bidding on the biggest market caps not only provided the
magnificent headline 7.72% week on week gains, but likewise amplified
the bandwagon effect at the general markets.
And
as noted last week: since the elites have greatly benefited from the
BSP inflationary boom, then I expect some of them to try to put up a
passionate last stand to prop up the sham boom. I would add
government agencies as likely candidates for this week’s massive
and orchestrated 6 issue index pump!
And
record of sorts seen in the market breadth during oversold conditions
of last week has transposed into record of sorts in a brewing
overbought condition. The margin of advancing issues relative to
declining issues swelled to possibly record levels at 239.
Frantic
bids spiked prices many non PSEi issues to the sky like Melco Crown
(MCP) to generate a stunning 69.92% payoff in a week! Who needs
casino when stocks now deliver casino like returns!
This
week’s furious comeback by the bulls has emerged with a modest
improvement in peso volume. And this was mostly due to Friday’s Php
9.8 billion. Weekly volume was at the highest this year where peso
volume rose by 30% week on week.
But
given the ferocity of the pump, peso volume still lags or overstates
the price action.
Bear
Market Rally: Big Weekly Gains Signal More Volatility Ahead!
The
extreme pendulum swing from flight to fight again highlights on the
violence in reaction to the emergence of acute stresses.
This
week’s massive rebound may have led many to come to believe that
the good ole days have returned and that the bear market is over.
Well
not so fast!
This
week’s 7.72% gains accounts the FOURTH
largest weekly gain since the 2007-8 bear market. In the above chart
I recorded all 4.5% and above weekly gains from 2007-2016.
In
three occasions, particularly from 2007 to early 2009 the Phisix
posted a whopping more than 11% weekly return! That’s ELEVEN plus
percent.
These
11 percenters functioned like mileposts during the bear market cycle
of 2007-2009.
Like
today, those three 11 percenters emerged in response to previous
violent selloffs.
The
first 11% in August of 2007 highlighted on the inaugural
of the 2007-2009 bear market.
The
11% weekly rebound led to an interim high in October of the same
year. However bulls were unable to maintain the momentum as they were
confronted by heavy selling resistance from the August highs, so they
eventually succumbed to the bears. The bears then took command. From
here the PSEi headed downhill.
The
next 11% highlighted on the selling
climax.
The
traumatic series of market carnage from September to November 2008 or
during the post Lehman event prompted anew a huge response to the
severely oversold condition.
In
the week of October 18, the PSEi collapsed by a harrowing 18.25! And
this was followed by another weekly crash by 10.73% a week before the
11% run, or in November 21! That’s aside from the smaller losses in
between the two weeks of the major crashes. So from the severe
clobbering emerged November 2008’s 11+%!
Yet
after hitting a landmark low in October, the PSEi remained intensely
volatile with sharp upside and downsides going on until the
culmination of the bear market.
So
following a terrifying 54% 1 year and 7 month crash, the end
of the bear
market or the return of the bullmarket was foreshowed by the 11%+
surge by the Phisix.
Remember,
54% cleansing prior to the baptism of the 2009 bullmarket!
I
know, mathematically speaking 7.7% is not the same as the 11% or
anywhere near it. But again this week’s 7.7% accounts for the
FOURTH largest, and has reflected on similar conditions that brought
about this week’s massive reactions.
So
this week’s activities seem to reverberate with the 11% bear market
rally of August 2007.
Yet
even the taper tantrum or the first bear market which appeared in
2013 has not attained similar degree of volatility. The biggest
response was at 4.75%. And that came four months after (or in
September) the bear market’s appearance!
Nonetheless,
the takeaway is that this week’s 7.7% looks likely a signpost of
more incoming intense volatility ahead.
And
most importantly, they are unlikely to signal the end of the bear
market. To the contrary big moves are the common characters of an
inflection points or bear markets
Additionally,
the still excessive valuations and attempts to prop up the index
underscore how current conditions are not sustainable.
January
Bear Market Losses Presages NEGATIVE Annual Returns!
And
here’s more.
While
the 7.72% surge this week essentially slashed a vital chunk of
losses, i.e. 72.15% of the -10.7% during the previous week, the month
of January closed with a negative 3.8%.
Seasonally
speaking, January has been predisposed towards the bulls. Excluding
this month’s loss, during the past 30 years (1986-2015) only a
third of Januarys registered losses. And most of them occurred during
bear markets.
I
have plotted all the largest 3%+ losses of January from 1986-2015
along with their annual returns.
History
has not been kind to the PSEi when January fell into the clutches of
the bears.
A
short narrative:
The
1993 154% skyrocketing by the Phisix led to three cyclical bear
market strikes within 1994 to 1995. Bear market strikes account for
the period where Phisix endured 3 bouts of 20%+ losses but recovered
from them. However, the bear market strikes during the two successive
years failed to evolve into a full blown bear market. Yet the January
negatives of 1994 (-10.06%) and 1995 (-13.13%) delivered -12.84% and
-6.88% annual deficits respectively. The full bear market came a year
and a month after 1995.
The
1999-2000 episode represented the failure of the massive dead cat’s
bounce in the wake of the stock market crash from the Asian crisis.
Following 19 months of agonizing 68.6% collapse, the Phisix staged a
huge 145% rebound in 1998-1999. The botched (dead cat’s) bounce of
1999 was carried over to January 2000 with an enormous -7.16% loss.
This led to the 30.26% annual deficit.
2000
also marked the bursting of the dotcom bubble in the US which
aggravated local conditions.
The
fantastic 11% weekly rebound by the PSEi in August 2007 highlighted
on the advent of the US financial crisis influenced domestic bear
market. The dawning of the full-blown bear market had been reflected
on January 2008 (-9.82%). By the end of the year, or for the year
2008, the PSEi accrued a whopping -48.29% devastation.
2009
marked the end of the Global Financial Crisis (GFC) bear market.
However the vestiges from the volatility of the selling climax post
Lehman was still manifested in January 2009 (-3.26%). Coupled with
the BSP’s adaption of zero bound, January losses turned into a
colossal 37.62% recovery for the year.
Meanwhile,
the January 2011’s staggering -7.61% loss signified a legacy from
the European crisis, where the Phisix ‘corrected’ by 15% from
November 2010 to February 2011. The significant January loss reversed
to generate a miniscule positive 4.07% return for the year.
Here’s
the thing. The difference of the last two cases with the rest was
that—the first, marked the end of the bear market (2009; but that’s
after a 54% loss)—and the second, January loss happened when there
clearly was no bear market. 2011 represented a cyclical correction in
a secular recovery trend.
And
like today, all the previous accounts, where substantial losses
plagued Januarys in 5 out of the 30 years, involved the bear markets
in motion. What distinguished these bear markets had been the various
stages of the cycle, namely, the advent (1990, 1994 and 2007) and the
post climax (1995 and 2000) phase.
Yet
ALL delivered NEGATIVE returns. But the variability of the degree of
losses depended on the evolution of the bear market within the given
year.
So
unless ‘this time is different’, which should be the expected
rationalization from the consensus, history has two unpleasant
messages for the PSEi:
First,
the humungous 7.72% one week comeback represents a flight or fight
response, which most likely indicates more volatility ahead.
Second,
January losses, which transpired in the shadow of the bear market,
could most likely presage negative returns for the year.
While
the past is definitely not the future or will not exactly replicate
the future, cycles, which are derived from the repetition of mistakes
as revealed by the specifics of previous experiences, gives us a clue
of what lies ahead.
The
Direction of GDP is NOT EQUAL to the Direction of PSEi!
Pre
GDP pumps (and dumps) have usually been followed the ‘buy the
rumor, sell the news (and vice versa)’ dynamics. But last week’s
publication of the GDP results, which turned out to be ‘better than
expected’, only served to combust the buying pandemonium at the
PSE.
Yet
the direction of the GDP EQUALS the direction of the stock market has
been a catechism for the mainstream.
Like
Pavlov’s dogs that have been conditioned to ringing bells as
signaling food, the public have been brainwashed or conditioned to
believe, and importantly, to react to announcements of GDP.
For
the consensus, GDP justifies a bid on Philippine assets, most
particularly the PSEi.
So
when the government and media screams G-R-O-W-T-H (!), the reaction
should be a buying binge or frantic pumping! Well that’s the story
of last week!
And
it has really been a fascination to see how popular entrenched
beliefs have really signified a MYTH! Or a popular delusion!
The
above graphs exhibits the BSP’s
monthly data of the PSEi (red) and the headline (constant) GDP
number from the Philippine Statistics Authority (blue bar chart)
Given
that the data spans three years then it may be safe to say that the
trends generated from the above can be construed as statistically
significant.
Here’s
a short walk through of the graph.
The
successful breakout of PSEi from the May 2013 7,400 high occurred in
January 9 2015. The new record high of 8,127.48 was established in
April 10, 2015. So the bulk of the 27 record finishes happened in the
1Q of 2015. What was the GDP of 1Q 2015? Answer: 5% the lowest since
Q4 2011!
What
happened to the PSEi after the milestone April high? Answer: the
Phisix weakened through the rest of the year. In fact, the Phisix
ended 2015 down -3.85%!
Was
the GDP rising or falling through the 2Q-4Q? Answer: Rising.
So
the Phisix fell as the GDP rose (green oval and green trend line)!
Now
let us rewind back to the taper tantrum days of 2013 (see orange
trendline and ovals).
Then
the headline GDP set its biggest performance in Q2 2013 at 7.9%.
Incidentally that was the time when the taper tantrum quasi bear
market occurred.
What
was the GDP trend from Q2 2013 to Q1 2015, rising or falling? Answer:
Falling. What was the trend of the PSEi of the same period? Answer:
Rising.
In
sum, in 2013 to 2015, as GDP fell, PSEi soared. On the other hand,
from Q2 2015 to Q4 2015 as GDP rose, PSEi fell!
So
in 3 years, has rising GDP translated to higher stocks? Answer: A very
CLEAR NO!
One
can even assert of the INVERSE correlation: higher
GDP equates to lower
stocks (and vice versa)!
But
I would NOT propound on this. Why? Simple: Because correlation is NOT
causation!
The
PSEi represents an outcome of mostly profit and loss oriented
voluntary exchanges or market activities. On the other hand, GDP
represents a monopolized aggregation of surveys bundled up as
statistical numbers to supposedly represent economic conditions
conducted by the government.
Incentives
matter.
Profits and loss versus political objectives.
In
essence, comparing
market outcomes with that of politically directed or politically
derived numbers would deduce to comparing apples and oranges.
Besides
what people say may not reflect on what they really would do. And
these are what makes surveys vulnerable to errors, and more
importantly, to manipulation.
At
the end of the day, there has been little relevance between the
actions of the PSEi and the GDP.
So
the incongruence between the performance between GDP and the PSEi, as
demonstrated above, should put into limelight the sustainability of
last week’s engineered pump, which again has been sizably
predicated on GDP equals stocks!
4Q
and 2015 GDP Improvements were Principally Based on Price Deflators!
The
Philippine government reported ‘better than expected’ 4Q GDP at
6.3% and a 2015 5.8% GDP.
Based
on the government’s own
data, in
2015 for the first time in statistical history, NGDP (current GDP)
has been subordinated by constant (real) GDP.
In
the past, constant GDP trailed NGDP. But due to the record low of
BSP’s statistical CPI, the base effects from price deflators
essentially determined or boosted the GDP!
This
has little to do with the living and breathing economy. This has
everything to do with massaging of numbers. As the late economist
Ronald Coase popularly remarked, if you torture the data long enough,
it will confess to anything.
It’s
a fascination because NGDP collapsed with CPI from Q4 2014 to Q3
2015, nonetheless constant GDP rose. However, in Q4 2015 as CPI
bounced back along with NGDP, the upside trajectory of constant GDP
remained intact.
So
the upside trajectory of the constant GDP represents the smoothing
out of volatility from real world economy prices. This virtually
assumes that nominal prices changes have no impact on the economy!
Wow!
Perhaps
it would best to tell our grocer or supermarket to adjust their
selling prices to constant (2000) prices! Let see how this works.
But
the government doesn’t seem to even apply price deflators equally.
As
a side note, it is a curiosity to note of some stark contradictions
where consumers spending continue to grow robustly while retail GDP
has materially slowed, and where personal
savings continue to soar! Based on the Philippine GDP statistics,
consumer spending is like transferring money from the left pocket to
the right pocket!
The
BSP have yet to relese the December OFW remittances.
But
for weak economic accounts like manufacturing or exports, constant
GDP prevails over NGDP. So
there appears to be a bias in using deflators on ‘lagging’
factors as against the ‘performing’ variables.
Like
in
the GDP of the 3Q, the beauty of statistics is the ability to
magically convert negative/s into positive/s.
For
instance, goods
exports have been in a technical recession based on NGDP. That’s
because the sector has been contracting for 4 consecutive quarters!
Nonetheless,
by virtue of statistical alchemy, technical recession vanished!
Exports had even been recorded as positive.
So
if one is an exporter, as the top line continues to deteriorate then
this should translate to financial pressures or even losses. But in
the eyes of statisticians, exporters have no financial problems,
because exports have still been growing albeit at moderate rates!
So
if both will engage in a conversation, the exporter will likely say,
“Business is bad, I’m losing money”. On the other hand, the
statistician will say, “That’s not true! Based on constant
numbers you are still making money!”
And
it’s not just exports.
Manufacturing’s
NGDP collapsed from Q4 2014 to Q3 2015, but then rebounded on Q4
2015. Yet there has been little change in the sector’s GDP rate of
growth (constant based). Again, manufacturing GDP appears immune to
price changes in the real economy.
Following
a dramatic 9% decline in the Philippine government’s survey of the
(nominal) value of industrial production last October,
November
posted an improvement by only 1%. So December manufacturing must have
skyrocketed by high double digits to generate NGDP growth of 4.4% (or
RGDP of 6.6%) in Q4!
The
above hardly points to a meaningful rebound in manufacturing sector
that should have confirmed GDP activities.
This
shows of a serious conflict in what headline GDP has been standing on
and what other data have been indicating.
There
are so many issues to raise.
But
the above data on real
estate and construction
(broken down into public and private construction constant GDP) seems
as one of the most striking.
Media
raves about how government spending powered the 4Q. This has largely
been due to the 41.5% in 3Q and 51% in 4Q surge in public
construction. As an aside, public construction accounts for only 24%
of construction GVA (nominal).
But
the outstanding number has not been in the public spending but in
the alleged collapse in private construction numbers!
Private
construction posted ZERO growth in 3Q and NEGATIVE .4% in 4Q! Yet as
private construction stagnated, real estate continues to post a hefty
7.8% 3Q and 7.9% 4Q G-R-O-W-T-H!
The
collapse in private construction suggests that real estate projects
by developers have virtually stood still! Expansion in the inventory
has stalled! But looking at the quarterly reports of listed
companies, this has not been the case. To the contrary developers
have been aggressively adding to inventories. An eyewitness account
will tell you that private construction activities in the Metropolis
have been buzzing!
Yet
how has the real estate industry been generating economic activities
if there have barely been construction activities to provide for
inventories? Has G-R-O-W-T-H emanated from mere turnover or
speculative churning? Has G-R-O-W-T-H originated from the money
illusion or inflation of property prices brought about by rampant
speculations?
The
government’s numbers seems to be detached with reality.
I’m
still awaiting the PSE’s 3Q report on the aggregate performance of
the listed firms to see if there have been any signs of congruence
with government data.
2015
GDP: Soaring Credit Intensity Underscores Heightening Credit
Fragility
A
final piece on GDP.
The
lower window shows of the correlation between GDP and banking loan
growth. The slowdown in bank credit growth in 2015 has resonated with
the deceleration in GDP in 2015.
Since
companies finance their operations with mostly bank credit then
naturally bank credit conditions should reflect on GDP.
Yet
GDP
has been inflated by bank credit growth.
The top pane shows why. Credit intensity or the ratio of bank credit
growth over NGDP reveals how much bank credit growth had been
generated to produce 1% GDP.
Since
2013, this ratio has been accelerating to the upside. It demonstrates
that despite the moderation in both factors, bank credit growth has
been growing FASTER
than the GDP. This alludes to the deepening dependency on credit to
generate growth. This means that more reduction or decline in the
rate of credit growth would not only lead to lower GDP but likewise
amplify credit risk. By credit risk, a growth slowdown would mean
lesser ability to pay outstanding obligations or liabilities thereby
raising the risk of default.
From
my perspective, since
GDP has been vastly inflated, then this means that the credit
intensity should be higher than indicated on the headline numbers.
Those
inflated GDP numbers were most likely designed to mask the growing
untoward ramifications brought about by zero bound redistributive
policies.
It
won’t take long when government statisticians won’t be able to
conceal on
the
developing decay.
___