A ‘sound’ banker, alas, is not one who sees danger and avoids it, but one who, when he is ruined, is ruined in a conventional and orthodox way along with his fellows, so that no one can really blame him―John Maynard Keynes
In this issue
"Shocking" Philippine Q2 GDP 4.3%: Don’t Fight the Trend! Public Spending Soared in Pesos! Consumers Slowdown as Big Government Becomes "Bigger"
I. The "Shocking" Q2 GDP 4.3% Affirmed Our Growth Path Projections
II. 7 Reasons Behind the "Pin the Tail on The Donkey" Economics Prediction Fiasco
III. Lessons from the Nominal and Real GDP Trendlines: Don’t Fight the Trend!
IV. Q2 4.3% GDP: Broad-based Slowdown, Goods Export Recession and Mounting Stagflation
V. Obscured by Base Effects, Public Spending Peso GDP Hit Second Highest Level in Q2 2023!
VI. Slow Spending Caused the Q2 GDP "Shock?": Government Promises More Deficit Spending!
VII. The Corrosive Effects of Public Spending on the GDP
VIII. Critical: Household GDP Trend also on a Fragile Secondary Trendline; Affirmed by Top Line Financial Standings of Listed Firms
IX. Epilogue: Let The Series Of Downgrades Begin!
"Shocking" Philippine Q2 GDP 4.3%: Don’t Fight the Trend! Public Spending Soared in Pesos! Consumers Slowdown as Big Government Becomes "Bigger"
The Philippine Q2 GDP slumped to 4.3% but "shock" was in the mainstream's prediction flop. Spending slowdown? Public spending GDP raced to its 2nd highest level! Trendlines affirm slower GDPs ahead.
I. The "Shocking" Q2 GDP 4.3% Affirmed Our Growth Path Projections
Bloomberg, August 10: That’s below all 24 estimates in a Bloomberg survey with a median forecast for 6% growth and compares with 6.4% expansion in the first quarter. Barring the pandemic years of 2020 and 2021, the April-June annual expansion was the slowest since 2011, according to data compiled by Bloomberg. The economy fell 0.9% quarter-on-quarter, against a median estimate of 0.6% gain.
Businessworld, August 11: Gross domestic product (GDP) expanded by an annual 4.3% in April to June, the slowest in over two years, the Philippine Statistics Authority (PSA) reported on Thursday. It was weaker than the 6.4% growth in the first quarter and 7.5% a year ago. It was well below the estimates of 21 economists in a BusinessWorld poll with a median forecast of 6% last week.
To begin with, let us start with an excerpt from my inquiry on the 1Q 2023 GDP. The anchor for my analysis was the peso trend levels of the nominal and headline GDP.
But here is the thing. Despite the mainstream's din over the GDP, their trendline reveals a different angle.
Following the Q2 2020 plunge, the series of "high trajectory" numbers of 2022 failed to regain the primary trend of the NGDP and real GDP. Instead, Q1 2023's GDP reinforced the secondary trendline, which indicates a slower pace of GDPs ahead. That's even in the assumption that this trendline holds.
Worst, if 2022's high-octane GDP had been a product of the "low" base effects, the same "high" base effects could provide tenuous support for the secondary trendline.
In a way, the above demonstrates statistics and their supposed stories, which ironically contravene interpretations of the consensus. (Prudent Investor May, 2023)
Didn't this scenario materialize in Q2?
We shall revert to this later.
II. 7 Reasons Behind the "Pin the Tail on The Donkey" Economics Prediction Fiasco
Next, the "shock!"
No, not the GDP, but the consensus estimates.
Not only did any expert hit the mark, but the numbers provided signified a constellation away from the official figures.
Figure 1
A journalist tweeted it was “one of the biggest misses on record.” With no recession and crisis on the immediate horizon, that was an understatement. (Figure 1, topmost graph)
Why?
First, this episode shows the problem with “pin the tail on the donkey” estimates. Fundamentally, the expert polls on GDP (or CPI) represent a “guess on a guess.”
The computation of the GDP & CPI estimates involves a network of political agencies that conducts surveys to produce inputs, which then are distilled into and calculated by econometric models constructed from diverse assumptions that churn out the politically sensitive figures.
Unable to mimic the comprehensive network of agencies, the consensus experts provide—not a guess on the economy—but rather a “guess” on the official numbers.
As such, the numerical guesses by the mainstream experts published in polls have been moored on the output or “guess” of authorities that are announced as official numbers.
For example, the BSP releases its forecast on the CPI at the end of the month or a week before the announcement. Not only that, it provides a range for its projection. The BSP’s CPI estimates ranged from 4.1% to 4.8% last July. Yet, the BSP has the luxury of coordinating with the Philippine Statistical Authorities (PSA) to obtain preliminary numbers, so in most instances, they capture the CPI precisely.
That’s a privilege unavailable to the institutions of the private sector.
In gist, the “pin the tail on the donkey” discourse gives “legitimacy” to the GDP (or the CPI).
That’s all it is.
Second, "Pin the tail on the donkey" operates on the premise of normal distribution, which is the reason the consensus gets it right only when the numbers fall (usually) within this ambit. They miss when statistical "tails" emerge, like the 2020 recession and the Great Financial Crisis (2007-2008) or Q2 2023.
As an aside, the biggest flop was during the onset of the pandemic in 1Q 2020. That was when the consensus initially denied the recession. Well, that was until it became apparent.
But, against that crowd, we rightly said that a recession was in the offing, "Because the war on people translates to the disruption to the global division of labor, shocks to the demand and supply chains will occur." (Prudent Investor, February 2020) [bold original]
Please don't forget the present inflation crisis represents the other crucial predicting fiasco by the consensus, many of whom, until the present, stubbornly insist on its "transitory" (supply-side) nature.
Third, another aspect of the monumental blunder is the principal-agent problem.
The consensus is inherently there to sell services. Their economic discourses/literature are mostly grounded to limn an ambiance conducive to generating sales/revenues. That being the case, as copyrighters with economic backgrounds, they are biased or slanted towards optimism. Or, one doesn't solicit deposits by telling prospective clients that the economy is at high-risk levels!
Fourth, there is the social desirability bias, which operates under the setting of the Overtone window. Many like to blend around the circles of the political and politically connected elites for personal advancement. In this case, it is taboo to even whisper about "bubbles" or politically sensitive current events, considered by the elites as unorthodox opinions.
Fifth, ideology is a contributor to such gaffes too. Trained and oriented to see "economics" through the prism of math and government interventions than through human actions and spontaneous orders—despite efforts by authorities to curtail it—magnifies their risk of misreading reality.
The lack of skin in the game represents the sixth factor. Ideas have consequences, which is especially important for entrepreneurs who put their faith in the mainstream for guidance.
Misreading the GDP translates to possible capital consumption for investors but not the government and establishment forecasters, who instinctively will blame eternal forces for it. It's why I'd prefer to read the actions of the reserved treasury traders (Demonstrated preference).
Lastly, the prevailing view that the GDP functions in the same fashion as a factory, in which welfare developments emanate from measuring and controlling input and output, doesn't hold water.
Even the developer of the GDP, Simon Kuznet, admitted,
The valuable capacity of the human mind to simplify a complex situation in a compact characterization becomes dangerous when not controlled in terms of definitely stated criteria. With quantitative measurements especially, the definiteness of the result suggests, often misleadingly, a precision and simplicity in the outlines of the object measured. Measurements of national income are subject to this type of illusion and resulting abuse, especially since they deal with matters that are the center of conflict of opposing social groups where the effectiveness of an argument is often contingent upon oversimplification
And…
All these qualifications upon estimates of national income as an index of productivity are just as important when income measurements are interpreted from the point of view of economic welfare. But in the latter case additional difficulties will be suggested to anyone who wants to penetrate below the surface of total figures and market values. Economic welfare cannot be adequately measured unless the personal distribution of income is known. And no income measurement undertakes to estimate the reverse side of income, that is, the intensity and unpleasantness of effort going into the earning of income. The welfare of a nation can, therefore, scarcely be inferred from a measurement of national income as defined above (Kuznet, 1934)
Those engaged in a massive Friday dump seemed to have accurately anticipated the GDP. (Prudent Investor, August 2023)
They either might have had ears on the right ground or on some of the agencies involved in its calculation.
III. Lessons from the Nominal and Real GDP Trendlines: Don’t Fight the Trend!
Government produces its statistics, but they pick on different aspects when explaining to the public.
2Q data affirmed or validated our observation that the GDP will substantially slow, using the nominal and real trendline. (Figure 1, lower chart)
Such trendlines reduce or eliminate the "noise" from the base effects.
Q2 GDP reinforced the secondary pathway created by the 2020 recession. Again, the secondary trendline translates to lower GDP ahead, despite occasional spikes.
There have been attempts to get beyond the exponential line, which acts as its quasi-resistance level. Though the spikes of Q4 2021 and Q4 2022 have pierced it, succeeding GDPs fell back to the secondary route.
As an aside, sustained spikes in Q4 represent seasonal forces at work, which should protrude or breach the exponential curve. But it is the marginal quarters that determine the trend.
It was the same routine for Q2 GDP, which regressed and nestled close to its support.
The clear and present danger is when further deceleration violates the 2nd pathway to the downside, which amplifies the risk of recession and intensifies the stagflation scenario.
The fun part is that the consensus entertains themselves with all sorts of Panglossian scenarios, but ironically, their GDP trendline says otherwise.
In a nutshell, the lesson from the GDP trendline is "Don't fight the trend!"
There is another critical trendline, which we will discuss below.
IV. Q2 4.3% GDP: Broad-based Slowdown, Goods Export Recession and Mounting Stagflation
In the meantime, seen from the expenditure perspective, it was a broad downturn for the Q2 GDP.
Figure 2
Except for exports, which grew by 4.1% in Q2, an improvement from Q1's .1%, all other aspects were down from the previous quarter. (Figure 2, top and second to the highest charts)
Household consumption slowed by 90 bps from 6.4% in Q1 to 5.5% in Q2. Government consumption and gross capital formation GDP shrunk by 7.1% and .4, respectively. The import GDP plunged from 4.7% in Q1 to .4%.
And though exports GDP was positive, primarily from services, which grew by 9.6%, good exports suffered two successive quarterly contractions of 14.9% and .9%—a technical recession! (Figure 2, second to the lowest window)
So, stagflation has enveloped the goods export sector. The shedding of 4,100 workers in the Mactan Export Processing zone last July (for Q3) and this S&P Global PMI July report, "Filipino goods producers were able to pair back staffing levels for the second successive month. There were some reports of resignations as well, which also partly underpinned the latest reduction in payroll numbers," could be another testament to the rise of unemployment despite official data.
Reduced output, high inflation, and lower employment rates are hallmarks of stagflation.
V. Obscured by Base Effects, Public Spending Peso GDP Hit Second Highest Level in Q2 2023!
Statistically, the faster decline in the Nominal/current GDP rate relative to the implied (deflator) index (-4.5%) resulted in the unexpected plunge in Q2 GDP to 4.3%. (Figure 2, lowest diagram)
This data bolsters the general impression that a spending slowdown amidst higher prices signified its cause. Stagflation again!
But the spending slowdown reflected a phenomenon for most sectors but not public spending—which has been distorted by the base effects.
Based on nominal peso trends, yes, while public spending % YoY sharply contracted in Q2, that's because its comparative base was at a record high in the same period a year ago!
Figure 3
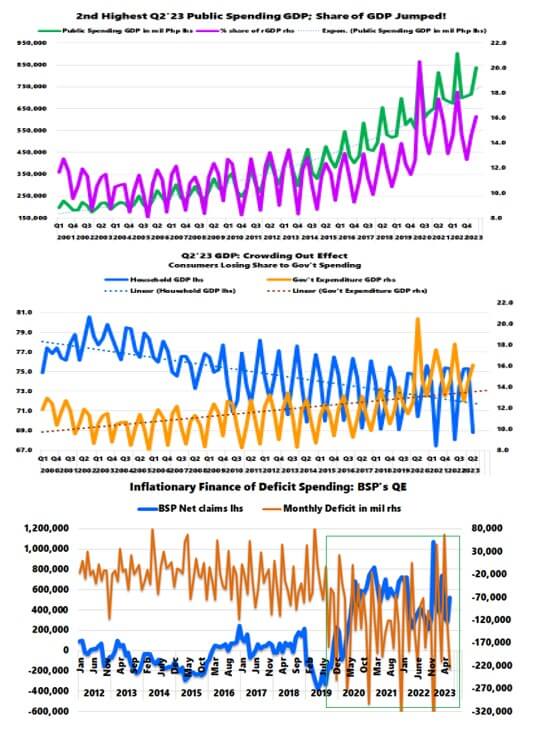
Public spending hit its second milestone high in Q2 2023 at peso levels. As it is, this solidified the uptrend of the share of government contribution to the GDP. (Figure 3, topmost chart)
The diametric relationship between the rising share of the government spending GDP and the falling share of household consumption represents a symptom of the structural changes in the political economy, where household consumption represents an opportunity cost to the surge in public spending. (Figure 3, middle pane)
The essence is that government consumption has been crowding out productive economic engagements, which has decreased productivity levels, therefore, in a slow-mo/incremental fashion, diminishing household consumption.
To emphasize, such dynamics haven't been an aberration but a deepening trend.
Entrepreneurs, please do take note.
The delayed release of the BSP's depository survey limits our perspective on the relationship between bank credit conditions and the GDP.
VI. Slow Spending Caused the Q2 GDP "Shock?": Government Promises More Deficit Spending!
So what was the response by the government to the shocking Q2 GDP data?
Inquirer.net, August 10: The Marcos government will accelerate spending in the coming quarters to recover the momentum following the 4.3 percent economic expansion of the country’s economy in the second quarter of this year,” said the Palace in a statement.
Of course, as expected, take the spending measures into their hands!
Behold, deficit spending could mount an incredible comeback!
The historic deficit spending, financed by the BSP and banks, provided temporary "automatic stabilizers" to the GDP during the 2020 recession. The BSP has partly funded a significant portion of deficits. (Figure 3, lowest window)
Figure 4
The stimulative effects of record spending and historic deficits to GDP are visible on the charts. (Figure 4, top and second highest charts)
But like all other policies, it has been plagued by diminishing returns.
The inflationary financing of such an unprecedented scale of deficit spending, ultimately, was reflected in the headline and the core CPI, which authorities continue to blame on the supply side. (Figure 4, second to the lowest and lowest graphs)
Figure 5
Though authorities have put a brake on this, which has been slowing, it remains at emergency levels compared to the pre-pandemic era.
The flawed deficit to GDP metric was 4.77% in Q2, slightly down from 4.84% in Q1. (Figure 5, topmost chart)
But as the news shows, the tendency is for authorities to ramp up on it. This response is called "path-dependent" politics.
VII. The Corrosive Effects of Public Spending on the GDP
The crowding out effect isn't the only corrosive force from historic deficit spending. Worst, it functions as an invisible channel for redistribution in favor of the politically connected elites and the bureaucracy. Yes, a reverse Robin Hood.
Via the "Cantillion effect," the initial phase of monetary expansion to fund these projects flows into these groups, who can buy goods and services at this earlier phase, pushing up prices.
And as money spent filters into the broader economy, price pressures spread, leaving the latter recipients bearing the brunt of inflation. An example would be the hunger surveys of the SWS.
Yes, this applies to the stock market too, e.g., with BSP's unparalleled Php 2.3 trillion injections, the PSEi rallied 56% from March 2020 crash lows to the highs of December 2020, benefiting bank stocks, the primary beneficiary of the bailout.
The BSP bailout of banks in 2020 has accelerated its share of GDP, representing the "financialization" of the economy. (Figure 5, middle diagram)
Aside from the BSP, the biggest financiers of the government have been the banking and non-bank financial industry!
Yet such redistribution penalizes enterprises with little or no political connections, SMEs, and general consumers.
But it is a boom for the government and their affiliates or political enterprises.
Further, in theory, expectations of substantial increases in deficit spending prompt the consumer to save.
Improved modeling on the effects of fiscal multipliers shows that firm and household decisions to spend, produce, and invest are largely influenced by their expectations of the future. If households anticipate that increased government spending and resulting deficits will be financed by higher future taxation, then they will consume less, not more. Reviewing a survey of this new literature, the Federal Reserve Bank of San Francisco found that "in contrast to theoretical predictions from the simple Keynesian framework, the analyses found that government spending had less bang for the buck than tax cuts. For instance, one year after the increase in spending, the impact on the level of real GDP is less than one-for-one, partly reflecting a decline in investment." (de Rugy & Salmon, August 2023)
But in the current setting, consumers have been confronting inflation with a build-up of their balance sheets. They've been borrowing from banks like drunken sailors!
Unfortunately, for mysterious reasons, it's been a two-week delay in the publication of the BSP's depository surveys, showing bank lending distribution of June. So this limits our perspective of how consumers utilized banks to adapt to (and contribute to) inflation.
Finally, it is not just about redistribution, but credit monetary-financed deficit spending represents an implicit debt default.
The resulting inflation lowers the ''real'' value of the remaining debt, so that although bond-holders receive the dollars promised on the face of the bond, the dollars do not command the resources they commanded at the time the bond was purchased. In effect, though no one has to come right out and say so, the Government has defaulted on part of its debt. (Lucas, 1981)
So there you have it. The promise and likely move to amplify deficit spending should lead to higher inflation, wealth, income, and political inequality, reduced consumption, and implicit debt default via financial repression or the inflation tax. Further, it should magnify the age of inflation 2.0.
These unintended consequences will induce a lower GDP that should strengthen the secondary GDP trendlines at the risk of their downside violation.
VIII. Critical: Household GDP Trend also on a Fragile Secondary Trendline; Affirmed by Top Line Financial Standings of Listed Firms
Aside from the GDP trendlines, the second most critical trend is the Household Consumption per capita trendline, which of course, as the primary contributor, mirrors the GDP per capita. (Figure 5, lowest chart)
That said, because the GDP drifts at the secondary path, so have consumers.
And as time goes by, validated by the trendline, the attenuation of the power of consumers will reflect on the general economy, such as in the retail and real estate industry.
The sliding share of the retail GDP has followed the household consumption GDP. (Figure 6, topmost chart)
Figure 6
It is then not a surprise that sales of SM Retail flowed in congruence with nominal household spending GDP. (Figure 6, middle window)
SM retail sales growth nearly halved from 16% in Q1 to 8.23% in Q2, while nominal Household GDP slipped from 14.7% to 11.6%.
Diminishing returns have been taking hold.
In this plane, the slowdown of consumers should also reflect in the real estate industry, which provides the venues for the retail trade and housing requirements—aside from office, tourism, and industry property requirements.
The total revenues of the top 4 developers—SM Prime, Ayala Land, Megaworld, and Robinsons Land—have dovetailed with the slowing Real Estate GDP. (Figure 6, lowest window)
Nominal Real Estate GDP slipped from 10.5% in Q1 to 9.1% in Q2, while aggregate revenue growth crashed from 23.9% to 7.5% over the same period.
The micro and macro perspectives provided by the GDP and Financial standings of listed companies share the same narratives: reduced power for the much-ballyhooed consumption-led GDP as the big government becomes "bigger."
IX. Epilogue: Let The Series Of Downgrades Begin!
ABS-CBN News August 11: A subsidiary of Fitch Solutions on Friday said it is slashing its growth outlook for the Philippines. BMI revised its full year growth forecast for the Philippines to 5.3 percent after the gross domestic product expanded by 4.3 percent in the second quarter of 2023, below its expectations. Consensus estimate for Philippine economic growth for the second quarter was 6 percent.
Because the consensus has predicated their annual GDP forecasts from an elevated standpoint, the Q2 4.3% GDP "shock" translates to massive downside adjustments to these.
The takeaway: Let the series of downgrades begin!
___
References:
Prudent Investor, The Fundamental Story Behind the 6.4% Q1 2023 Philippine GDP: Public Spending Cushioned a Slowing Consumer, May 14 2023, Substack, Blogger (Chart reference excluded)
Prudent Investor, Batten Down the Hatches! Global Recession Ahead: The New Coronavirus Pushes China’s Economy to a Freefall! February 16, 2020
Simon Kuznets, 1934. “National Income, 1929–1932”. 73rd US Congress, 2d session, Senate document no. 124, page 7. https://fraser.stlouisfed.org/title/971
Prudent Investor, Pre-Closing "Dumps" Sent the Philippine PSEi 30 Tumbling Below the 6,500 Level August 7, 2023: Substack, Blogger
Veronique de Rugy Jack Salmon The Keynesian case for open-ended government spending doesn’t square with the facts, August 10,2023 Mercatus Center
Robert E. Lucas Jr. Economic Scene; Deficit Finance And Inflation, August 26, 1981, New York Times