Showing posts with label stock markets. Show all posts

Monday, July 15, 2013

How Stock Markets React to Rising Oil Prices

I have been repeatedly stating that rising stock markets in conjunction with expanding leverage amidst rising interest rates (as expressed via bond yields) constitutes a ‘Wile E. Coyote moment’ for me. 

This doesn’t explicitly mean that equity markets won’t rise, but this means that the further and steeper the increase of the stock markets, in the face of a continuing massive buildup of imbalances, the greater the risks of a bear market or a stock market crash.

In short, debt based asset inflation is simply incompatible with rising yields.

Eventually when interest rates reach certain levels where a critical mass of investments or punts pillared by debts or loans would be rendered unprofitable, and where debt becomes unserviceable, a feedback loop mechanism of margin calls on loans will impel for liquidations which consequently forces down prices of securities and vice versa.

Thus inflationary boom transitions into deflationary bust

Producer Prices as Signs of Inflationary boom

At the start of the year I wrote this[1]
Yet interest rates will ultimately be determined by market forces influenced from one or a combination of the following factors: balance of demand and supply of credit, inflation expectations, perception of credit quality and of the scarcity or availability of capital.
I have pointed out last week that rising treasury yields partly reflected on the increasing take up on bank credit. This has been confirmed as bank loans in the US nears record levels

From Business Times Singapore[2]
Bank lending to US companies is rising at a pace that will by year-end push the total above the record high of US$1.61 trillion reached in 2008.

Commercial and industrial loans outstanding climbed to US$1.56 trillion in the week ended June 26, an increase of 4.1 per cent this year and up from the low of US$1.2 trillion in October 2010 following the worst financial crisis since the Great Depression, according to Federal Reserve data. The amount surged about US$18 billion last month, the most this year.
And on the back of this inflationary boom has been the expected rise of input prices as partially represented by US producers prices. 

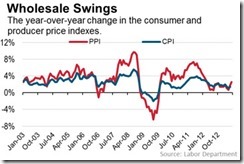
clip_image001

U.S. producer prices, according to the Wall Street Journal Blog[3], increased for the second straight month in June and are up 2.5% from a year earlier, the largest 12-month increase since March 2012

Lubricated by expansionary credit, industries in the private sector experiencing credit induced booms along with the government spending will extrapolate to increased competition for specific resources required for their projects. Thus greater demand for resources would be reflected on as price pressures on relative input factors particularly of wages, rents, and producer prices on the capital good sector.

As the great dean of Austrian economics Murray N. Rothbard explained[4]: (bold mine)
Now what happens when banks print new money (whether as bank notes or bank deposits) and lend it to business? The new money pours forth on the loan market and lowers the loan rate of interest. It looks as if the supply of saved funds for investment has increased, for the effect is the same: the supply of funds for investment apparently increases, and the interest rate is lowered. Businessmen, in short, are misled by the bank inflation into believing that the supply of saved funds is greater than it really is. Now, when saved funds increase, businessmen invest in "longer processes of production," i.e., the capital structure is lengthened, especially in the "higher orders" most remote from the consumer. Businessmen take their newly acquired funds and bid up the prices of capital and other producers' goods, and this stimulates a shift of investment from the "lower" (near the consumer) to the "higher" orders of production (furthest from the consumer)—from consumer goods to capital goods industries
In other words, price inflation will unevenly be felt by different sectors but this will be most evident in the capital goods industries.

However, competition for credit and resources would not necessarily translate to consumer price inflation. Nonetheless, competition for credit and resources could also exert upside pressure on interest rates that would eventually put marginal projects on financial strains, including margin debts on financial assets operating on leverage, which lay seeds to the upcoming bust. 

The seeming absence of generalized price inflation will mask the boom-bust structure and mislead the mainstream into assuming the sustainability of such dynamic.

How Stock Markets React to Rising Oil Prices

Last week’s bonanza from Mr. Bernanke’s Put option on the markets succeeded to recreate a 2009-2011 boom scenario where stocks, commodities and bonds rallied.

I mentioned commodities. 

clip_image003

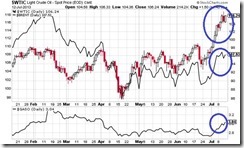
Oil Prices in the US, as measured by the West Texas Intermediate crude[5] (WTIC), has sharply risen during the past month. The WTIC has even narrowed the gap of European based oil benchmark the Brent crude[6] (BRENT). The other major benchmark the OPEC Reference basket[7] also posted substantial increases. Meanwhile the Dubai Crude[8] has shown marginal increases.

Gasoline (GASO) prices in the US have also surged during the last month.

If the increase in oil prices will be sustained, then this will add to producer price inflation and could even possibly get reflected on consumer price inflation. And an increase in price inflation expectations will likely add an inflation premium on the interest rate markets. This should put increased pressures on the mercurial bond markets.

Aside from rising interest rates, a trend of higher oil prices has not been compatible with climbing stock markets.

clip_image004

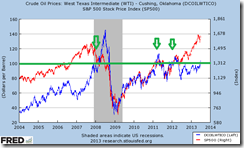
For the three occasions where oil prices as measured in WTIC (blue) topped $100, the upside momentum of the S&P 500 (red) had been truncated.

In 2008, as the WTIC soared to $147 per bbl, the S&P crashed as the US housing and mortgage deepened. Eventually the deflationary bubble bust spread to oil prices which also collapsed.

University of California economic professor James Hamilton argues that an “oil shock” played a substantial role in the recession of 2008[9]. Mr. Hamilton further noted that high oil prices had been linked with 11 of the 12 post World War II recessions[10].

Twice when oil prices popped beyond $100 in 2011 and 2012, the S&P’s rise turned into a correction.

If history should rhyme, then one of the two discordant factors will unravel. Which will it be oil or stock markets? Or could there be a third option where both implode? 

An Oil Price Bubble?

What has driven prices of oil to recent highs?

Certainly not demand from China as crude oil imports fell in the first half of 2013. Such decline, according to the Wall Street Journal[11], marks the first January-June contraction since the depths of the financial crisis in 2009. If China’s economy continues to flounder then oil imports are likely to fall further unless the Chinese government will use this opportunity to increase their stockpile of strategic petroleum reserves[12].

US demand will reportedly grow marginally in 2013 based on Energy Information Administration (EIA) estimates. According to the Wall Street Journal[13], “Demand in the world's biggest oil consumer will average 18.66 million barrels a day this year, up 0.6% from a year earlier. Last month, the EIA forecasted growth of 0.5%.”

The popular wisdom is that recent US oil price increases signifies a seasonal factor—the summer driving season.

Global oil demand is projected as lacklustre for 2013 and 2014. OPEC estimates that global oil demand, according to the IBTimes[14], will slow by 400,000 barrels per day in 2013 and will rise by 300,000 barrels per day in 2014.

Meanwhile, the International Energy Agency (IEA) expects also marginal growth for global oil consumption. According to the Platts.com[15], the IEA said global oil demand is forecast to grow by 1.3% to reach 92 million barrels a day in 2014, underpinned by a stronger global economy. That’s 1.3% growth for a strong economy, but how about a weak economy enervated by tight money?

The IEA expects global oil production to outpace consumption led by “surging supplies of oil from the US and other non-OPEC producers”

clip_image005

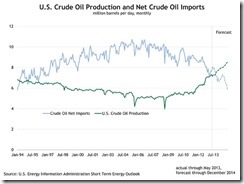
US oil output driven by shale gas and oil has reached records where US oil production now meets 89% of its energy needs according to the Energy Information Administration (EIA).

According to the Bloomberg[16], “Domestic crude output will average 7.31 million barrels a day in 2013 and 8.09 million in 2014, the EIA, a unit of the Energy Department, said in the report.

Could spiking oil prices have been about geopolitics perhaps Egypt or Syria? Possibly but unlikely…yet.

Although the threat of an oil supply shock could occur if events in Syria deteriorates

As Martin Katusa of Casey Research explains[17]
The roots of the differences go back to the 7thcentury CE, with the death of the prophet Muhammad. Those who accepted Abu Bakr, Muhammad's father-in-law, as caliph (meaning successor) became known as the Sunnis. Those who believed that Ali, Muhammad’s son-in-law, should be caliph became the Shiites. From there, the differences grew, many battles ensued, and a schism formed between the two groups.

Why has the American government backed the Sunnis, you may ask. Saudi Arabia is the short answer.

If a decisive Shiite victory were to occur in Syria, it would have enduring implications throughout the Middle East, but most importantly in Saudi Arabia. Though Saudi Arabia's population and leadership are both Sunni, and two of the holiest cities of Islam (Mecca and Medina) are situated in the country, the oil-producing areas in the eastern portion of the country have significant Shi'a populations. If an uprising were to occur there in response to Shiite success in Syria, Saudi Arabia's oil production (as well as economic, political, and social stability) would suffer a huge setback.

It is critical for both the US as well as the European Union that Saudi Arabia stay as it is to keep the balance of power intact in the Middle East. That's seen as a necessity for stability in the global oil markets. If Saudi Arabia's oil production were to stop, we could be looking at US$200 or more per barrel of oil immediately. That's how important Saudi Arabia is to the spot oil price.
Egypt’s plight seems hardly different, but may be of lesser impact. A push towards a more anti-US Islam fundamentalist regime from the current secular government is likely to impact geopolitics of oil in the same context as Syria. 

Egypt’s oil production[18] has seen a substantial but decline overtim while oil exports[19] have partly reflected on production activities and could be reasons why events in Egypt may not impact oil markets dramatically.

So if oil prices has not been about tight supplies, hardly been about real demand or unlikely about geopolitics then why the price spiral?

Well the likely answer is oil speculation or an oil bubble.

The research team from Credit Suisse suggests that this has been about the unwinding of carry trades[20]:
For the last two to three years, just as the Federal Reserve drove investors to look ever harder for yield, WTI’s steep contango provided a neat carry trade, allowing it to be a fairly steady provider of decent (if unspectacular) returns.

Boiled down to the basics, investors were selling one year out time spreads, where the curve was relatively flat, and waiting for them to move into contango as the futures approached the prompt month. Now that the WTI curve has flipped into backwardation, this trade no longer works and the remaining, perhaps significant, positions are being unwound.

To do so, funds must buy the front and sell the back, further exacerbating WTI’s backwardation.
Whether this has been about the unwinding of the contango based carry trades or not, rising oil prices in the backdrop of easy money environment and monetary pumping by the central banks means that bubble activities, marked by yield chasing dynamics, has apparently percolated into the oil markets.

And tight money is likely to prick the oil bubble as in 2008 unless oil will be seen as an inflation hedge like gold.

Rising Oil Prices Will Impact Real Economies

clip_image006

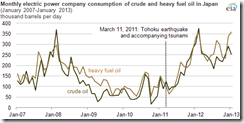
The heavy dependence on energy imports by Japan, especially amidst the closure of nuclear power plants which previously accounted for 30% of energy generation, and which has been replaced by Liquefied Natural Gas (LNG) and Petroleum according to the EIA[21] makes Japan highly vulnerable to a spike in oil prices.

The good news is that rising international prices of oil will help Kuroda’s Abenomics, via doubling of the money supply in two years, hit their target of attaining price inflation as a weaker yen will amplify price hikes in foreign currency or in US dollar terms. 

The bad news is that a surge in price inflation will likely put additional pressure on the highly fragile Japanese bond markets or JGBs which increases the likelihood or risks of a debt crisis.

Finally it isn’t true that high oil prices will curb demand as popularly explained by media. Instead high oil prices represent an income transfer from oil consumers to oil producers. High oil prices will benefit producers that will encourage additional oil production aside from incentivizing consumption on other aspects.

clip_image007

Whereas consumption patterns of oil consumers will likely shift towards more energy conservation or may lead oil consumers with lesser disposable income.

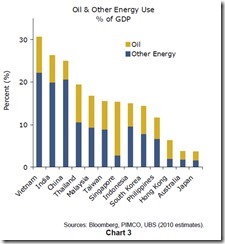
Vietnam, India, China and Thailand with oil and other energy use accounting for 20% or more in % of GDP, appears as most vulnerable to sustained increases in oil prices according to the 2010 estimates by PIMCO[22].

One can omit the Japanese data, since this was computed prior to the Tohoku earthquake where nuclear power played a big role in Japan’s energy generation.

The Philippines is shown as one of the least vulnerable which for me is quite surprising. Since I doubt that the Philippines has reached energy efficiency levels similar to her relatively more developed neighbors, I suspect that there has been significant errors in measuring real energy usage (perhaps due to non-inclusion of the informal economy) or from some other factors which is beyond my thoughts as of this writing.

Nonetheless high oil prices amidst revolting bond markets increases the market risks.

Trade with caution


[1] See What to Expect in 2013 January 7, 2013

[2] Business Times Singapore US business loans set to break '08 record July 11, 2013

[3] Wall Street Journal Economics Blog Wholesale Price Jump Unlikely to Impact Consumers July 12, 2013

[4] Murray N. Rothbard, The Positive Theory of the Cycle Business Cycle Theory America’s Great Depression Mises.org


[6] Wikipedia.org Brent Crude


[9] James D. Hamilton Oil prices and the economic recession of 2007-08 June 16, 2009 voxeu.org

[10] Reason.com Oil Price Shocks and the Recession of 2011? March 8, 2011

[11] Wall Street Journal China' Crude-Oil Imports Fell in the First Half July 10, 2013

[12] Wikipedia.org Strategic Petroleum Reserves (China)


[17] Marin Katusa If Syria Falls, Expect a Pop in Oil Prices Casey Research July 2, 2013


[19] IndexMundi.com Egypt Oil - exports

[20] Isabella Kaminska The WTI carry unwind FT Alphaville July 10, 2013


Saturday, September 26, 2009

Rep. Alan Grayson: "Has the Federal Reserve Ever Tried to Manipulate the Stock Market?"

Rep Grayson questions Federal Reserve Council Scott Alvarez on possible attempts by the FED to directly or indirectly (via prime brokers) manipulate the stock market (Hat Tip: Zero Hedge)

Sunday, August 31, 2008

Stock Markets As Indicators Of Recession

``The media loves a recession, because it means no slow news days for a while. Every utterance from the Fed is a headline, weekly columns write themselves (just pick two recession cliches from your cliche file and rub ‘em together), and "man in the street" interviews will always yield some nice emotional sound bites.”- John Carlton, How to Survive Excessive Recession Hand Wringing

Financial markets function as forward discounting mechanisms and could thereby serve as leading indicator for impending recessions.

According to renowned Wharton economist Jeremy Siegel in Stocks for the Long Run, since 1948, 10 recessions in the US were preceded by a stock market decline with a lead time of 0 to 13 months or an average of 5.7 months. (It should be noted that ten stock market declines of greater than 10% in the DJIA were not followed by a recession)-[source wikipedia.org].

Figure 2: Economagic: S & P 500 and US Recessions

Figure 2 from Economagic validates the view of Mr. Siegel that the stock markets have historically accounted for as strong lead indicators of previous economic storms. The recessions of 1970, 1974, 1981, 1991 and the latest dot.com bust all shows of falling stock markets values (based on the S & P 500 closing prices) prior to the formal recession (shaded areas).

Moreover, since official declarations are backdated-for instance the National Bureau of Economic Research (NBER), a private non-profit organization that officially reckons of the US business cycle, in 2001 declared the US entered into a recession in March but was broadcasted only in November 2001 (BBC)-the markets have already reflected upon the gist of the downside adjustments.

The S&P 500 accounted for nearly ¾ of the losses of the entire cycle in terms of scale (peak-trough) and had been at more than 50% of the duration of the time cycle of the bear market, when the pronouncement of a recession was made.

The point is, by the time of the official recession was recognized by the NBER, the likelihood is that the markets have already reflected the meat of the losses or is in the last inning of the bear market.

Of course, we’d like to point out that ALL recessions are different in terms of underlying causes, operating conditions and effects or impacts to markets or the economy such that we can’t interpret wholly past conditions as reflective of the future. Doing so would render one guilty of simplistic thinking.

Derivatives and structured finance or the so-called "shadow banking system", technology enabled real time capital flows, "Mrs Watanabe" and the US$ 3 trillion+ per day currency trades, South-South trading, 37 years of off-Brettonwoods “gold” standard, global transmission effects by currency pegs and dollar links, globalization of trade, labor and finance, emergence of sovereign wealth funds, massive growth of current account imbalances, emerging market vendor financing of current account deficit developed economies (or nondemocratic countries financing democratic nations), offshoring/outsourcing, WIKInomics, telecommutations, hybrid electric cars, climate change, nanotechnology, biotechnololgy and etc....account for only SOME of the variables that were NOT SEEN or were NOT AS SIGNIFICANT in the PAST as it is today that will continue to revolutionize or sizably impact present conditions going forward-in terms of economic, social, cultural, financial, political, environmental and scientific spectrums.

What we can do is to simply look at these circumstances and integrate past lessons into examining the potential distributive outcomes. Assuming a replay of past conditions under the present landscape signifies as haphazard analysis or thinking at best.

Recession: The Denmark and New Zealand Experience

From the recent global slowdown we can take glimpse of how some equity markets have responded to official recessions.

So far among developing economies only Denmark (EU Business) and New Zealand (BBC) have been official casualties to the economic downdraft or has encountered an economic growth recession in a technical sense (two quarters of negative economic growth), see figure 3.

Of course, Japan, UK and some economies under the Eurozone have been widely anticipated to fall into the daisy chain category of economic recessions in the coming quarters. Such expectations have allegedly resulted to a swift change of tide as seen in the furious rally of the US dollar index.

Figure 3: Denmark’s KFX Index (left) and New Zealand’s NZ50 (right)


Although Denmark officially acknowledged a recession last July (blue arrow)-having covered two quarters from October 2007 to June 2008 (see vertical blue lines)-we can note that from the peak-trough, the KFX has lost 23% and is now down about 18% from its former highs.

What seems to be noteworthy is that the labor market seems to be tight in spite of the recession. According to Steen Bocian chief economist of Dankse Bank (highlight mine), ``For now then, low unemployment is tempering the bleakest portents for the Danish economy. However, it is important to remember that the economy has just emerged from a long period of strong economic growth which has exerted immense pressure on the labour market. Labour shortages are therefore still a big concern for many businesses, making them reluctant to let people they worked hard to recruit go, even if order books are beginning to dry up.

``So, it is probably only a matter of time before we see a rise in unemployment. Nevertheless, there is a lot of evidence to suggest that such a move may be slow in coming and unlikely to result in especially high joblessness. Anyway, rising unemployment is not necessarily a bad thing for the Danish economy in the current climate. It may sound strange to say that the economy could benefit from having more people out of work, and of course this could not stand as an end in itself. But there is no doubt that pressure on the labour market remains intense, and unemployment is well below the structural level . i.e. one compatible with stable wage and price formation in the slightly longer term.”

It is indeed peculiar to hear an economist say that “high unemployment will be good for an economy” which is frequently blamed on “inflation” when monetary policies should be more of the culprit but nonetheless the low of levels of unemployment should extrapolate to a floor to the downside momentum of the Danish economy.

The chart itself seems to croon of the same tune; the KFX appears to be exhibiting signs of a bullish “double bottom”! So the likelihood is that Denmark’s travails could be short term in nature.

On the other hand, New Zealand which also was officially declared to be in a technical recession early August (blue arrow), covering the first semester of the year (blue vertical lines), has seen its major benchmark down on a peak to trough basis of nearly 30% to presently 22% following its recent rebound.

While it would be too early to conclude if New Zealand is in the path to a confirmed inflection point, what can be noted is that based on the technical picture the NZ50 appears to be attempting for a breakout from its bear phase of the stock market cycle. The seeming “breach” from the downside channel of the NZ50, once confirmed, should demarcate such transition.

Some Asian Bellwethers Attempt To Form A Bottom

The New Zealand’s primary benchmark the NZ50 is one of the 7 Asian bourses which seem to be working towards a formative “bottom” cycle as seen in Figure4.

Figure 4: stockcharts.com: Asian Bourses Attempting To Bottom

Aside from the Phisix and Vietnam where we previously discussed in The Philippine Peso And The Phisix: With A Little Help From Our Neighbors, and New Zealand; India’s BSE (upper left window) seems to mimic the NZ50’s motion, while the Taiwan’s Taiex (upper right window), Australia’s All Ordinaries (lower left window) and Thailand’s SET (lower right window) seem to be in a tight consolidation-typical characteristics of market bottoms; albeit this is too premature to conclude since it would need to manifest more prolonged period of rangebound movement or gradual ascension).

Nevertheless as a matter of market timing and the seasonality of trends, September usually has been a critical period for the global stock market as shown in Figure 5, although as reminder, seasonal trends aren’t infallible indicators.

Figure 5: chartoftheday.com: September’s Seasonal Weakness

The US Dow Jones Industrials have tended to be weakest during September which if seasonal trends should persist, increases the odds of volatility this month considering the already frail economic environment.

And this is where it gets interesting; if Asian equity markets manage to withstand the turbulence abroad, then the chances for the “bottoming” process are likely to get enhanced going into the yearend. This implies that if the present “divergences” will be sustained from the expected infirmities in the US markets, then Asian markets could probably see a much amplified rally by the end of the year to highlight the establishment of the bottom cycle.

And going back to the current recessions of New Zealand and Denmark, the intensity and durations of such adjustments also matters. The recession’s longevity would likely be determined by the cyclicality or secularity of the present market trends relative to the domestic economic cycle. This suggests that if, for instance, Denmark’s recession had been based on economic growth ‘overheating’ than from systemic excessive overleveraging to deleveraging adjustments, then the present recession could be ‘short and shallow’ instead of an extended one. Hence the market actions should equally reflect such momentary shortcomings than a brutish bear.

Conclusion and Recommendation

Recessions are the official affirmations of the public’s expectation of statistical negative economic growth. Where the stock market signifies as a strong leading indicator, a declaration of official recession could be construed similar to the reverse analogy of “buy on rumor, sell on news”…or simply “sell the rumor, buy the news”.

So far among developed economies, only Denmark and New Zealand has entered its fold while some others have been expected to follow.

In addition, the durability and duration of a recession depends on the degree of structural or external influences on the economic and the market cycle. Read from the stock market’s perspective, in most instances, the official declaration of a recession usually marks of the last leg of the bear market cycle especially if the market’s deterioration was earlier prompted by cyclical forces. Structural led bear markets tend to extend losses overtime and in terms of depth.

Recession will probably be a problem for some Asian economies as Japan. However, interpreted from the stock market’s action, many Asian markets have been currently attempting to form a bottom which probably means that the contagion impact from the US credit crunch could be peaking unless proven otherwise. Going into the usually volatile month of September, such critical “bottom-forming” exercise could be confirmed or debunked.

If Asian markets manage to hold its standings or its present gains into September, then based on seasonal factors there is a good chance for the markets to rally going into the yearend. A rally that fortifies the technical picture seen above compounded with broader participation could formally establish the region’s transition towards the market’s “bottom” cycle and an upcoming recovery.

In the same plane, any weaknesses seen in the market this month could be seen as an opportunity to accumulate.

At the end of the day, stock markets are likely to be driven by monetary growth and credit creation, technological advances, economic and productivity growth.

Friday, July 18, 2008

Does The Violence In Pakistan’s Stock Market Signify Signs of Panic?

Some people have taken the recent stock market plunge to the political realm.

From Bloomberg (highlight mine), ``Pakistan's main stock exchange received police and paramilitary protection after investors stoned the building in protest at collapsing share values.

``I have lost my life savings in the last 15 days and no one in the government or regulators came to help us,'' said Imran Inayat, an investor who was part of the protest.

This is the common problem with retail participants: most of them don’t understand the risks involved in the financial markets. They jump in when market momentum keeps moving up (because mostly of the misleading notion of “keeping up with the Joneses” and the prospects of "perpetual short term gains") but when slammed with losses they demand regulators to “save them”.

In short, privatize profits but socialize losses from reckless activities.

Courtesy of Bloomberg: Pakistan’s Karachi 100

Seen from the long term, the returns for long term investors hasn't been all that bad; Pakistan’s Karachi 100 has been up by over 300% since 2004 and has lost nearly 35% from its peak.

It's just a matter of overconfidence turned into frustrations especially for retail punts.

In addition, government intervention only complicates the situation…

Again from Bloomberg,

``Regulators this week eased curbs on trading, removing a 1 percent limit on price declines that led trading volumes to fall to the lowest in a decade. Shares have slumped 29 percent this year, ending a rally that had pushed the key index more than 14- fold higher since 2001.

``There has been some level of mismanagement by the authorities,'' said Habib-ur-Rehman, who manages the equivalent of 6.5 billion rupees ($90 million) in Pakistani stocks and bonds at Atlas Asset Management Ltd. in Karachi. ``This may be due to their misperception that they can prevent the market from falling. Investors have to learn to bear losses as they do gains.''

You can watch the video from Javo.tv (hat tip: Charleston Voice)
...

...

The point is-in the psychological cycle of markets, this indicates of a transition to the cycle of desperation and panic which eventually culminates with capitulation or depression...or your market bottom.

Perhaps the Pakistanis are nearly there.

Saturday, June 07, 2008

Kenya’s Mixed Message: Soaring Inflation Rates and Rising Stock Market

Mainstream media tell us that “rising inflation” (goods and services) and stock markets don’t mix well. Our usual retort is it depends…

Just last week Kenya’s benchmark, the Nairobi Stock Exchange rocketed 5.83%...

Kenya's NSE 3 year chart Courtesy of Bloomberg

According to Indexmundi.com, Kenya’s annual historical and estimated inflation rate…

But just as its stock market surged, Kenya’s inflation rates reportedly likewise escalated beyond estimates:

Annual inflation rates spiraled 31.5% (reuters Africa) in May on the account of soaring food prices 44% (FT.com)!

Since we have sparse idea behind Kenya’s market dynamics we suspect this to be perhaps to be related to its oil exports or tea prices.

You see, Kenya’s main exports are tea, horticultural products, coffee, petroleum products, fish and cement (indexmundi.com).

Although it registered crude oil production of a measly 9,627 barrels a day in 2006, of which exports accounted for 7,377 barrels a day in 2006 according to the Energy Information Administration.

It could be that since Africa is a hotbed for the next generation of oil and gas exploration, the sprightly stock market activities could be oil related or if not due to soaring TEA prices. Of course all of these are just conjectures on my part.

The point being: Rising “goods and services” inflation DOES NOT ALWAYS EQUAL to slumping equities.