Monday, February 13, 2006

First Gen: Year of the Investing Dogs?

My apologies for not having posted updates since I was out of town and had been inaccessible....Anyway here is one belated “micro” article which I sent last January 27, and which I think deserves a look...

First Gen: Year of the Investing Dogs?

"It can be no dishonor to learn from others when they speak good sense."- Sophocles, Greek Playwright (496-404 BC)

Because it is the NEW “year of the Dog” then we will take the definition of “Dog” in the context of the investments. In the financial markets, a “Dog” is usually defined as “a bad investment” or ‘investments that under perform”. In the US markets, the ``Dogs of the Dow” is defined by investopedia.com as ``An investing strategy that consists of buying the 10 DJIA stocks with the highest dividend yield at the beginning of the year. The portfolio should be adjusted at the beginning of each year to include the 10 highest yielding stocks.”

This suggests that the lunar year of 2006 could be one of the following: the year of UNDERPERFORMERs, a bad year for equities or possibly the year of the high yielding dividend paying stocks.

The First Gen IPO ends its offering this week, and was reportedly met with unresponsive demand from the public or in particular, domestic investors, which fits our new year’s characteristic of our “Dog”. However, could it be that the market has discounted factors or have been remiss in their assessment of the First Gen IPO?

First of all, First Gen is an Independent Power Producer (IPP) which is required to list as part of the Electricity Power Industry Reform Act (EPIRA). In other words, First Gen’s listing is part of a compliance of an existing regulation. Without the law, it would be unlikely for First Gen to list.

Second, Utility firms are usually characterized by high margins and huge dividend payouts, investopedia.com identifies an important aspect of utilities investing as (emphasis mine), ``Utilities still go to great lengths to ensure distribution of cash to shareholder; relative to others the industry offers good income potential. Dividend Yield, measured as the Annual Dividend/Market Price at the time of purchase, probably offers the best tool for gauging the income generated by utilities stocks. Besides, a solid dividend yield suggests a more attractive proposition for conservative investors.” In short, the public may have omitted the reason for investing in utilities…DIVIDENDS.

Today, the public has tagged First Gen as typical of any publicly listed firm which disregards the significant “FUNDAMENTALS” aspects and fails to distinguish between capital appreciation- based relative to dividend-based investing. Most of them have reckoned that stockmarket investing is primarily the capital appreciation based ergo the “speculative bent” of domestic investors rather than what fundamentally matters.

To consider, mainstream sellside analysts are wont to present to its clients the attractiveness of an issue based on sophisticated financial jargons, yet I find it quite unusual where NONE of the conventional/mainstream analysts so far has delved on the margin-dividend aspect of the issue.

And quite curiously too, First Gen has been bizarrely reticent about declaring its Dividend Yield. While it has noted in its prospectus of the nominal figures it distributes as dividends it has clammed up on how much dividends it pays out per share.


2002

2003

2004


Dividends

1,539,000,000.00

5,421,000,000.00

2,243,000,000.00

common

11,307,110.00

11,307,110.00

11,307,110.00

preferred

4,076,872.00

3,643,204.00

3,643,204.00

total

15,383,982.00

14,950,314.00

14,950,314.00

net income

3,218,000,000.00

5,328,000,000.00

4,960,000,000.00

Payout Ratio

47.82

101.75

45.22

I have made a short table based on the data from its prospectus of the dividends it pays out to its shareholders (common and preferred) and its net income. I omitted my estimates of how much it pays out per share since it looks too enormous and could be most likely wrong. However, based on its stated net income and nominal dividends payout...the minimum payout or payout ratio (dividend/income) has been an incredible no less than 45% since 2002!!!

Third, the previous IPOs could be an example to what we may call as ‘Past Performance are not indicative of future results’. One may find subscribing to last year’s IPOs as “UNPROFITABLE” because to this point none of them has risen above its subscription offering and all three were listed during the PEAK of last year’s bullish market; in particular, Semirara Mining (SCC) listed on FEBRUARY, Manila Water (MWC) and SM Investments (SM) both listed on March.

One would also note that the three issues where mostly warmly received (remember five to eight times oversubscribed!) during their offering, which at the time had a very bullish backdrop considering the upside momentum of the Phisix. Stated differently, today’s lackluster appetite for First Gen has been due to the “rear view mirror effect”, phlegmatic sentiment aggravated by poor track record of past IPOs. Comparing the past issues to First Gen is like comparing apples to oranges.

Candidly, I have NOT scrutinized on the entire prospectus of First Gen to make an in-depth ‘fundamental’ recommendation. However, being your contrarian analyst or seeing value in what the public fails to appreciate, First Gen looks likely a buy for me (I have not subscribed but am looking at the prospects of buying on listing). In essence, when the public disregards or dismisses the reason to why one should invest in utilities, gauges subscription on IPOs based on popularity and uses flimsy basis as comparison, my inclination is to go against the popular sentiment.

Fourth, utilities investing are also reckoned as defensive or countercyclical investing meaning going the opposite direction or against a cycle, where on general market weakness, utilities tend to outperform the general market since energy issues are usually considered economically as having inelastic demand.

Finally, today’s global trend of ‘supply inelasticity meets growing demand’ has resulted to investors paying attention to energy related issues…utilities issues have not escaped the global investor’s eyes…


``Great investment opportunities come around when excellent companies are surrounded by unusual circumstances that cause the stock to be misappraised." remarked the legendary investor Warren Buffett. Ah ah, I certainly would not ignore the writings on the wall.

***

A follow up observation on First Gen (February 12)....

Here is an irresistible commentary by a local analyst who predicts First Gen to FALL by as much as 18%???!!!...., ``Like SM Investments and Manila Water, First Gen was offered “without a discount" to comparative companies. If it follows the performance of those recent IPOs (emphasis mine), First Gen could fall around 18%”...based on comparing apples to oranges!!

I noted that past performance cannot be indicative of future outcomes. This analyst has essentially been entrapped in the so-called heuristic bias or cognitive illusions of ‘hindsight bias’ or ‘anchoring’ in determining his projections about the share prices of First Gen by comparing “laggards” mostly weighed by sentiments rather than fundamentals (instead of comparing with companies from the same industry).

Second, such observation emanates from the initial listing activities which had been weighed down by lackluster sentiments in the general market, as well as in the particular stock (as a matter of bad publicity more than anything else), in short, the analyst is a practitioner of “rationalizing” events to past actions rather than finding value buys.

If I am right (conditional on the dividend per share data) about the “surprisingly above average dividend yields” offered by the newly listed utility power producing firm, especially in a defensive market, First Gen would likely be a winner than a DOG. I am yet trying to get in touch with the proper authorities to uncover “unearthed” figures that I expect.Posted by Picasa

Monday, January 16, 2006

In Defense of Relative Returns; Time Is Key!!!

``When it comes to Wall Street, there ain't no tooth fairy.'' Joel Greenblatt

AS part of my forecast blemish in 2005 (mines to be the year’s winner), an involuntary repercussion naturally would be portfolio underperformance, and in this regard I have been taken to task by those whom mistimed their entry to the market by buying at the “peak” of last year’s cycle and secondly, had been fervidly imbued by the price anomalies (losses) in Lepanto.

Nevertheless, it is understandable that the average investor could be characterized as having the typical shortcomings: a short time horizon in terms of reckoning of returns, are emotionally overwhelmed, expect oversimplified explanations to developments in a vastly complex and dynamic framework, and most importantly, expect flawless, infallible and “pulling rabbits from hats” performances (by anticipating fund managers or analysts to accurately forecasts tops and bottoms of the markets) instead of taking into perspective the overall risk-reward nature of the markets.

In earnest, it is quite a daunting task to rather help investors attain for themselves the appropriate risk-reward expectations management when in most instances they have the faintest idea of why they are in the market in the first place, principally focusing on mark-to-market fluctuations without considering the risks and volatility factors involved. Hence, the investing landscape is littered with countless numbers of spurned investors whose goals today are to simply return to their costs rather than profit after years of horridly watching their portfolio shrivel.

As a battle hardened investor whom has lived off the years from investing and trading the market, let me share to you some of the insights I have gleaned which may hopefully help you to comprehend more the nature of the financial markets and help shape your objectives or goals when investing.

1. Past Performance Does NOT Guarantee Future Outcomes. The market has a life of its own and is simply soooo fluid and dynamic that randomness dominates daily, weekly or yearly or what we might call as ‘short term’ activities. To quote the famed mentor of the world’s most successful stock investor Warren Buffett, Mr. Benjamin Graham, ``In the short run, the market is a voting machine. In the long run, it's a weighing machine."

For instance the mining industry in general had been in two decades of slumber (remember our “Rip Van Winkle in Gold” series in 2003), so in essence the “investing herd” has been conditioned to believe of the perpetuity of such inertia.

A reader from the United States recently wrote to complain about the lagged performance of Benguet Corporation (BC) abroad despite the recent rip roaring price surges of Gold. Yes indeed, gold stocks are leveraged to Gold but it does not necessarily follow that BC (or local mining stocks) should shadow the price of the metal as our experience shows, why? Simply because local investors have not yet fully ingrained to their psyche that Gold is in a bull market! And because investors have been “anchored” or affected by Warren Buffett’s terminology of “rear view mirror syndrome” and have been primed mainly by mainstream analysts who still maintain their “speculative” outlook on the unfolding generational investment theme. Meantime, the mining industry is in the run-of-the-mill process of proselytization (winning converts) hence the huge potentials to the upside!

Since I wrote my piece “The Philippine Mining Index Lags Behind” which was published in two international websites, safehaven.com and goldseek.com in 2003, the domestic mining index has belabored in its sporadic rise and has been preponderated by prolonged bouts of heavy selling as signal of the public’s rabid denial.


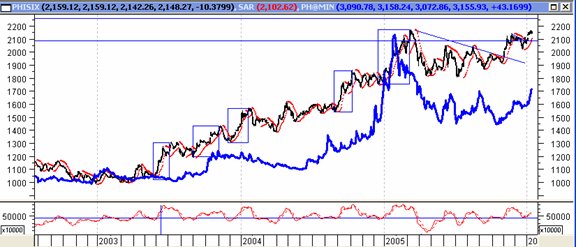
A Trend is A Friend Until It Isn't

As the chart above shows, the Mining Index (blue line) has lagged behind the Phisix (black candlestick) since the inception of the 2003 bull run and has been so until end 2004! After a dismal 2005 some signs of life during the last few weeks!

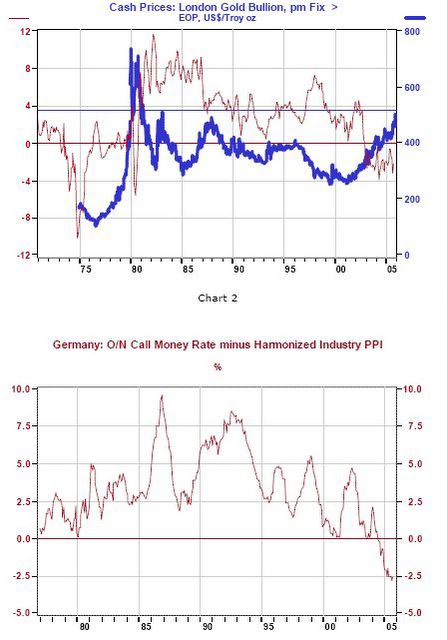
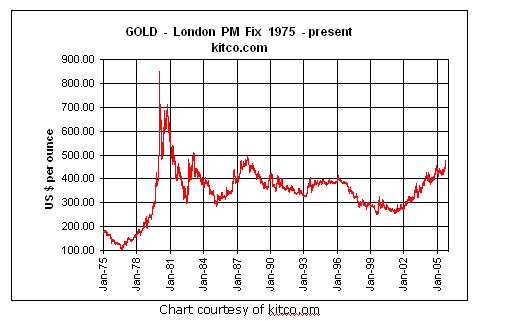
Gold (and other precious metals) has been in a bullmarket for about 5 years while the local mining industry has been trailing its counterparts abroad and is still struggling to get its feet standing. Will these last perpetually? My answer is no. It will rise, but lag as history shows.

As a matter of randomness, do you know that Lepanto’s surge to a record high (according to my chart 1980s up) was in 1997 just when Gold was into its last phase of the bearmarket (to $252 per oz)? Do you know that Philex Mining soared to its record high in 1987 just as copper prices was in the prime of its decade long descent throes from its peak during the 80’s?

Of course, things do change. Today’s technology enabled connectivity has brought the world into a more intertwined state such that global capital flows are now “real time” or within a click of the mouse.

The combined market capitalization for the world’s mining sector is said to be less than $150 billion a puny compared to an estimated $30 trillion or more in aggregate market cap for the entire world. A panic into gold or the precious metal group could simply send global investors driving mining stocks to the roof! One might argue that this might be a black swan event (low probability event); my response would be; NOT with Gold in a bullmarket, anything is possible.

The same assertion holds true with “supply inelasticity themed” natural resource based stocks as oil, natural gas, coal, water or agriculture. They may be in slumber today, but are we certain that they would remain the same tomorrow?

2. The Financial Markets Operate in Cycles. I have long argued that investment themes take time to develop and they usually come in the forms of cycles, unlike mainstream brokers who keep shifting themes as often to encourage you to trade the market.

Former IBM top honcho Thomas J. Watson, Jr. once said that ``There's a fine line between eccentrics and geniuses. If you're a little ahead of your time, you're an eccentric, and if you're too late, you're a failure, but if you hit it right on the head, you're a genius." In other words, timing is the key for one to be judged as eccentric, failure or genius. One may be right about his/her anticipation of the future market trends, however, being too early could result to unacceptability as the investing public is mostly concerned with faddish issues. Unfortunately market timing is an arduous task.

Needless to say, cycles are part of the general acceptance of the investing public of the unraveling events or trend formation. Mr. George Soros, a billionaire speculator and now turned philanthropist, once dubbed as “the man who broke the Bank of England” for successfully shorting England’s currency in 1992 enumerates the phases of a boom/bust cycle in his book Alchemy of Finance which is applicable to any asset market, namely,


1. The unrecognized trend
2. The beginning of a self-reinforcing process
3. The successful test
4. The growing conviction, resulting in a widening divergence between reality and expectations
5. The flaw in perceptions
6. The climax
7. A self-reinforcing process in the opposite direction

Obviously yours truly could be considered as an eccentric for promoting the mining sector when it was yet an “unrecognized trend”.

The Supreme Court’s decision to validate the Mining act of 1995 was obviously the beginning of the self reinforcing process, as mining stocks ephemerally zoomed at its wake. However, after a short stint up, 2005 was dominated by the public’s refusal to accept the industry’s revival until the end of the year where select mining stocks started to gain upside momentum...

After last week’s forecast where once again I made a similar call to that of 2005 that the mines and oil will lead the market in 2006, it appears that destiny could be kinder to me this time around or if not has given me a pivotal headstart; the reformatted MINING and OIL index soared by 11.61% leaving all other indices eating dusts!

Unassuming and unhedged Philex Mining, a star performer in 2005 up 120% (it’s payback time for those who have stood with me in the test of time!!! The dividends of Patience!!), was up 22.34% over the week and 30.68% year to date (While I am still bullish over the present mining celebrity over the long term, I see this stock as having been overextended and requires a short-term correction or profit taking soon). Philex B approaches its major resistance at Php 2.5 per share, touched by about FOUR times in 1994-1997 with one successful encroachment.

Meanwhile, Apex Mining too gave out scintillating returns up 25.77% for the A shares and an astounding 50.48% for the B shares and mining index heavyweight Lepanto finally showed signs of recrudescence with its B shares up 24% over the week.

These signs of mining issues moving higher without corresponding headline news to underpin their rise looks likely a gradation from stage 2 or “the beginning of a self-reinforcing process” to stage 3, the “successful test”. Notice that the psychological influences take investors not a month or a year but YEARS to develop (since 2003)!!!

This also shows why diversification works, spreading your eggs to limit risks while maximizing gains over the broad based issues or over the broader market.

So, as far as the present situation is concerned, it is a mistaken notion to take investing in commodity based stocks over a very short time frame.

In fact, the entire Commodity Cycle since 1800 shows that it similarly takes awfully LOOONGG years for the overinvestment cycle to shift to underinvestment cycle as limned by the BHP Biliton chart below...


200 years CPI adjusted Commodity Price Index-BHP Billiton

As I have noted before analyst Puru Saxena observed that in ``over the past 200 years, commodities had five secular bull-markets between the following periods –

1st boom - 1823-1838 (15 years)
2nd boom - 1848-1865 (17 years)
3rd boom - 1878-1918 (40 years)
4th boom - 1929-1950 (21 years)
5th boom - 1963-1980 (17 years)

So the likelihood is that commodity cycle may last anywhere from 15 to 40 years which means that if the boom cycle began during the advent of the millennium, the peak of the cycle could last anytime from 2015-2018 (15-18 years)! So essentially, commodity based assets have a looonngg way to go too (caveat there will be interim bumps-as we have seen and will continue to see)....

This also means that whatever transpired in Lepanto’s underperformance last year could be considered as a “price shock” or unexpected price moves or an anomaly. For as long as there is no major fundamental problem concerning management or its operations or most importantly, Lepanto’s ownership of its reserves, then the likelihood that last year’s price digression could simply be a short term move (one year is short term relative to cycles).

To quote DR Barton of Traders U, ``unforeseen transmission problem, the market has a particularly keen knack for hitting us with unexpected price moves... There's an old trader's axiom that every market participant has a disastrous trade out there with our name on it. Our job is to minimize the effect of unexpected price shocks.”

Differentiating between short term moves and long term cycles is a must for investors to ensnare real positive returns, otherwise you’ll be caught chasing prices (ending up in tears~ recall 1997?).

3. Real Returns is all about Risk Taking. This is a timely apothegm from investment maven Mr Paul McCulley from PIMCO (one of the largest bond institutions in the world) who writes his outlook for this month (emphasis mine), ``Risk taking is a risky business. But logic says you gotta take risk to make real returns...In the investment arena, you don’t have to be in it to win it. Rather, you have to be in it or out of it at the right price. It’s called active investment management, taking positions on both the overweight (long) and underweight (short) sides of risks embodied in benchmarks.” In short, in trying to beat the relative returns of the market, one has to take risks to where the highest possible yield would most likely accrue and this is primarily the reason I stuck to the “supply inelasticity theme” given our profuse natural endowments.

Relative return is defined by financial-dictionary.com as ``The return that an asset achieves over a period of time compared to a benchmark. The relative return is the difference between the absolute return achieved by the asset and the return achieved by the benchmark.” For instance the Phisix, since its reversal to the advance phase, in three years has gained 41.63% in 2003, 26.38% in 2004 and 14.99% in 2005. In short, its relative return for the past three years is about 27% per annum. IF, for example, because of investor’s stubbornness to accept our investment themes and assume that for 2003 and 2004 return was ZERO but in 2005 yielded 105% then relative returns would be almost equal to that of the Phisix for the same period. That’s if we aspire to achieve the same performance. We aim for Gold or outperformance with active management!

Stated differently, given the lagging cyclical effects, underperformance could be expected at the onset as these themes gradually work its way to the mindset of mainstream investors. Top notch value investors (characterized by investment in non-popular themes) like Warren Buffett, constantly outperform the market “Beta” at the margins, after positioning earlier on issues largely ignored by the investing mass. For instance his bet against the US dollar has resulted to a losing position by almost $1 billion in 2005, does it make him less effective? Obviously not, because the record shows that Mr. Buffett’s overachievements results from long term holdings delivering positive real returns (relative or absolute). You can take Berkshire Hathaway’s ownership of 129 million ounces since 1997 or a quarter of the world’s silver supply as an example!

Please do not misconstrue me as comparing myself to a legend, I am simply a disciple of the market learning the ropes and conveying to you that ‘investment themes such as contrarian picks or value investing are given time to work and shape, and does not happen overnight’ as alot of investors mistakenly expect. And lastly,...

4. Timing the Market Is At Best Probabilistic. You can simply scour on the list of top 100 or so of the world’s most successful investors and find NO PURE market technicians as part of the roster. Why? Timing is one of the hardest thing to accomplish! As John Bogle founder of Vanguard fund, once said ``After nearly fifty years in the business, I do not know of anybody who has done it successfully and consistently. I do not even know anybody who knows anybody who has done it successfully and consistently."

As to my experience, most of my missed calls have largely been out of purely timing or technical calls. Remember the failed two successive Christmas rallies, the individual chart calls, how about 2005’s last minute whipsaw?

An analyst says that predicting tops and bottoms is a mug’s game. Well while he does it anyway and so do I admittedly. This is not to outrightly dismiss the prospects of market timing because occasionally they do work. However to my experience, they work best when they are either supported by fundamentals and/or sentiment or a combination thereof.

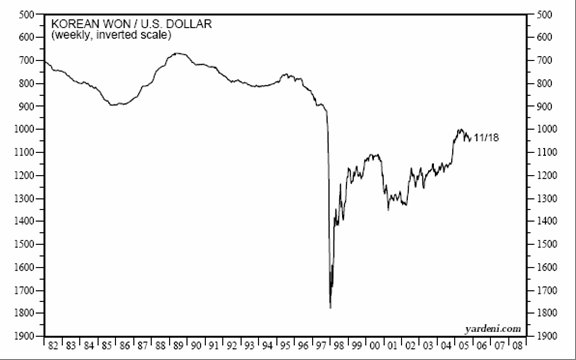
Your prudent investor analyst has had a streak of major forecasts that went favorably for him: promptly forecasted the bottom of the market in 2002 (recall index trading edition), accurately pinpointed the technically guided “capitulation” of PLDT in October 2002, rightly forecasted the market’s reversal in 2003 to even challenge ING Baring’s flat outlook (which eventually was proven right), accurately predicted the rise of telecoms during the said year, while in a derring-do fashion called for the upcoming rise of the mines and the oil extractives industry; was on the spot in 2004 with mines taking the cue from the Supreme Court’s ratification of the Mining Act of 1995 and precisely prognosticating the reversal of the Peso which was realized in 2005. All these took quite sometime to unravel using the mélange of technicals, sentiment and most importantly macro fundamentals as yardstick to these auspicious or “lucky” forecasts. In short hard work, provenance from above, and a tinge of “luck” mattered. NOT astrology or NO crystal ball nor tarot cards, made this happen.

To cap this defense of Real returns, let me quote analyst Chet Currier of Bloomberg (emphasis mine), ``Beating the market is, at best, a misguided goal for most individual investors. When a child's college tuition comes due, it matters not a whit whether you beat the market or not. The only pertinent question is, do you have the money to pay the bill? Real-life investment plans should be geared to such real- life goals, with careful attention to risk as well as reward --- not to an abstraction like beating the market. That's for professionals, and for people who invest as an ego-driven sport.”

My personal objective for the market is based out of survivorship, am definitely NOT part of the ego-driven sporting classes that go for technical abstractions or jingoistic “sophistications” and am definitely a FAILURE when it comes to “pulling rabbits out of your hat” renditions. Besides, there are no shortages of Harry Houdinis and David Copperfields wannabes in the field of investing.

Albeit, as hands on practitioner of the market, I do believe in Absolute returns at minimum, and Relative returns at best, which ALL requires the test of time. As the preeminent and another legendary investor Sir John Templeton once said, ``The best time to invest is when you have money. This is because history suggests it is not timing which matters, it is time.” Posted by Picasa

Monday, January 09, 2006

Fear Not the Rising Peso

``The highest use of capital is not to make more money, but to make money do more for the betterment of life” - Henry Ford

With the Peso’s impressive gains for 2005, I’ve argued that beyond what is seen (remittances) is a far more important factor in the NOT seen (portfolio flows). And this has been an outgrowth of global excess liquidity in the chase for yields (cash yield premium/interest rate differentials), growing intra-regional economic ties, integration of regional financial markets (e.g. Chiang Mai Initiative ~ currency swaps), dynamic monetary policies (China’s new currency basket) and a technology-enabled “flattening world” which has led to a gradual narrowing of global purchasing power.

As previously argued in my December 5 to 9 edition, (see Philippine Peso Breaks to 2½ High! The Seen and Unseen Variables), ``One must be reminded that the PESO has LAGGED the region such that today’s outperformance could be construed as simply a classic case of cyclical recovery.” In short, a late-in-the-cycle rally for the Philippine currency.

I have received some several quarters or feedbacks about “rising peso hurting our exporters” arguments.

While it is true that appreciating currencies can have to some degree effects that may influence the competitiveness of domestic exports, the ebbs and flows of currencies are NOT the compelling factors in driving export competitiveness.

In the case of Japan which had a pegged currency to the US dollar at ¥360 before it was effectively ‘revalued’ in December 1971.

Japanese Yen/USD Historical

As you can see from the Yen/USD chart above courtesy of www.yardeni.com since sometime 1982 (¥ 275/USD), the Japanese Yen has appreciated by about 140% (!!!!!!!) or 210% (from December 1971 ¥360 to a USD), yet despite the monumental currency appreciation, Japan remains in a colossal SURPLUS in its trade account against the US!

According to RTE business, Japan’s surplus with the US last November was at ¥791.7 billion (US$6.73 billion). According to the Reuters Fact box, foreign currency reserves of Japan as of November 2005 amounted to an accrued US$824 billion (mostly due to current account surpluses)!

By contrast since the Philippine Peso has depreciated from around Php 26 to a USD from 1992 until 2004, while exports as a measure of annual percentage change has been LESS than encouraging.


Philippine Exports Yearly % Change

The chart above manifesting of yearly percentage change of local exports courtesy of Dr. Ed Yardeni at www.yardeni.com shows that despite the Peso’s steady depreciation export growth has slowed in recent years or has been in a declining trend since 1995!

What is notable is that the Exports accelerated during the heady expansion days in the early 90’s (ASEAN boom) and collapsed ex-post Asian Financial Crisis!

What could be discerned from the above is that export competitiveness is conspicuously less of an outcome from a depreciating currency, but more of an amalgam of the following: the cost of doing business (infrastructure, wages, etc..), labor productivity, free trade oriented regulations/policies (economic freedom), market access, financial and credit availability, innovative capabilities and cultural acceptance to a globalizing world, aside from macro factors such as aggregate demand, world’s economic growth rate or of the region’s, as well as even monetary policies.

To quote Dr Marc Faber, ``a strong currency has never been a problem in the long run. It forces corporations to become extremely efficient, to innovate and to invent new methods of production. Weak currencies on the other hand are an incentive to compete based on short term favourable exchange rate movements – in nature very much alike protectionist economic policies.”

What could go wrong and offset the present gains are feckless boondoggles masquerading as social service programs meant for short term alleviation and political appeasement which perpetuates the inherent character flaws of the mostly gullible public, particularly of dependency and the client-patronage culture.

For exporters/importers, I would suggest to you to take up foreign currency hedges through derivatives (swaps/forwards) offered by banks or from legitimate forex trading entities (something we lack domestically) and or consider diversification from transacting in US dollars (depending on the facilities of your financial intermediaries) or to diversify from your traditional markets.

For the bankers, I would suggest to aggressively offer instruments on foreign currency hedges to the export/import industry as a niche market.

With the US dollar on a structural downtrend given its unsustainable deficits, foreign currency hedges looks likely a good business to build upon given the juvenile state of the Philippine financial markets.


Saturday, December 24, 2005

The Word Became Flesh

A Season's Greetings...

John 1:14-18

And the Word became flesh and dwelt among us, full of grace and truth; we have beheld his glory, glory as of the only Son from the Father. John bore witness to him, and cried, "This was he of whom I said, 'He who comes after me ranks before me, for he was before me.'" And from his fulness have we all received, grace upon grace. For the law was given through Moses; grace and truth came through Jesus Christ. No one has ever seen God; the only Son, who is in the bosom of the Father, he has made him known.
Merry Christmas to ALL!
Posted by Picasa

Sunday, December 18, 2005

Filipinos Lead WTO Protests

Do you know that Filipinos make up a third of the protest groups in this week’s WTO conference in Hong Kong? According to an article written by Thingfish for netnewsasia, ``What was most striking though, was that of the 100 random protest groups we looked at, a third were from the Philippines. Add to that the several Hong Kong or regional bodies that are essentially Filipino pressure groups, and you’re looking at a very lopsided protest.”

With an infinitesimal share of trade relative to the world, it seems that we are getting ourselves an inordinate share of protesting. The same groups, the inveterate leftist and left leaning religious and environmental groups, leading the street protest against the administration are now seen in Hong Kong venting their perpetual ire. This character flaw is one of the many reasons why we remain chronically poor; our penchant for non-productive or even counterproductive activities.

Thingfish delivers the kicker ``Every day somewhere in the Philippines, someone is protesting against something. Protest is a national pastime. And perhaps that’s the real crowd-puller in Hong Kong this week: Filipinos just love a good protest.”


Tuesday, December 13, 2005

The Occam Razor's Principle in Explaining Gold's Rise

With gold prices soaring to a high of $540.2, the presumptive thought in every investors mind...“Why the sudden appeal of gold?”

Paul Kasriel, chief economist of Northern Trust, gives us the Occam Razor’s principle or “The principle of parsimony”...where “one should not increase, beyond what is necessary, the number of entities required to explain anything”...in short, it all boils down to a worldwide phenomenon called NEGATIVE REAL INTEREST RATES!


Mr. Kasriel sums it up with...``global investors are losing faith in, as Jim Grant calls them, faithbased paper currencies as a store of value.”

Quite a legacy indeed for outgoing US Fed Chief Alan Greenspan.
Posted by Picasa

Monday, December 12, 2005

Philippine Peso Breaks to 2½ High! The Seen and Unseen Variables

As you probably know by now, the Philippine Peso surged to its highest level since June 2003 or a 2½ year high to Php 53.42 against the US dollar for an amazing gain of 1.36% over the week, essentially validating my contrarian forecast about a year ago.

Naturally, we have mainstream news accounts and their corresponding analysts piling over the reportage on what seems to be the stating the obvious....exploding overseas remittances. However, your prudent investor analyst who adopts the maxim of the illustrious economic journalist Frédéric Bastiat who declares “There is what is seen and the unseen”, which basically means an act or event as having been seen as the immediate cause to an effect but is not duly the underlying cause, in Bastiat’s words, ``When a man is impressed by the effect that is seen and has not yet learned to discern the effects that are not seen, he indulges in deplorable habits, not only through natural inclination, but deliberately.” In the context behavioral finance, Bastiat’s adage translates to what is usually deemed as ‘rationalization’ or an oversimplified explanation usually attributable to current events.


Figure 1, US Dollar/Philippine Peso Chart

In our Oct 17 to 21 edition, see US Tightening Affecting Global Financial Markets II, I wrote ``The chart above of the Philippine peso shows of the domestic currency appreciating after two rate hikes; on September 22nd (red arrow) the Peso was at 56.24 while prior to Thursday’s rate hike the Peso was last traded at 55.71.” In short, the incipience of the peso’s appreciation was marked by a series of interest rates increases adopted by our own version of Central Bank, the Bangko Sentral ng Pilipinas, as shown in Figure 1.

Of course, this is NOT to discount the remittance factors which coincidentally accelerated during the period as promptly reported by Manila Times’ Maricel E. Burgonio last November 16th, ``OFW remittances that month rose 28 percent to $941 million from a year ago. This led to a 28-percent growth in nine-month inflows to $7.9 billion from the $6.204 billion sent home in the same period last year.”

At the magnitude of today’s firming of our local currency, it would probably require remittances to grow by about 40-50% to drive the Peso to its current levels. Nonetheless, we should not forget that the remittances have been growing all year round yet the Peso hovered within the 56 to a US dollar levels in about 27% of the year! Particularly in July to September which was largely ascribed to political instability concerns arising from the Garci wiretapping scandal.

My bullish case for the Peso has mainly been predicated in the context of macro developments, particularly of surplus global liquidity, expanding trade, financial marketplace and economic integration. In short, the globalization of the economic and financial spheres has expedited the gradual leveling off in the purchasing power differentials underpinning today’s macro evolution.

If you think that the Philippine Peso’s 1.36% advance was enough to make this week’s cynosure, then you must be apprised that it was Indonesia’s rupiah that took the spot light up by more than THREE percent!!

Let us take it from the report of Bloomberg’s Christina Soon (emphasis mine), ``The rupiah surged 3 percent this week to 9,700 against the dollar, the biggest weekly gain since the period ended July 19, 2002. The currency yesterday climbed as high as 9,615, its strongest since June 20...The rupiah yesterday climbed to the strongest since June 20 after the central bank this week raised its benchmark interest rate for the sixth time in four months to slow inflation. Higher rates boost returns investors get for holding Indonesian assets. A new cabinet that was put into place this week also fueled expectations the government can attract more investment.”


Figure 2 Indonesia’s Rupiah as of November 18th close, courtesy of Ed Yardeni (www.yardeni.com)

Indonesia’s rupiah has been on an uptrend after an overshoot to the downside during the selling frenzy in the wake of the 1997 Asian Crisis (see Figure 2). Since, the Rupiah has gradually gained some of its lost ground and used the recent Cash Yield spreads as a pretext for portfolio inflows.

It has not been different from South Korea’s won which advanced by .4% over the week mostly due to an almost ‘coordinated’ movement in the REGION’s currencies. A continuation of Bloomberg’s Ms. Soon report notes that (emphasis mine), ``South Korea's central bank on Dec. 8 unexpectedly raised its benchmark interest rate as an accelerating economy threatens to spur inflation. The bank lifted the rate to 3.75 percent from 3.5 percent. The National Statistical Office on Dec. 8 said its consumer confidence index rose to a six-month high in November. Fund managers based outside Korea bought a net $226.2 million of the nation's shares this month through yesterday, according to stock exchange data.”


Figure 3 South Korea’s won as of November 18th close, courtesy of Ed Yardeni (www.yardeni.com)

The Korean Won also a victim to the 1997 Asian Crisis presently shows of a steady and robust rebound (see Figure 3) in the wake of the downside overshoot. Again, perceived interest rate premiums have been spurring its present currency gains!

Ms. Soon notes of the gains of the other regional currencies such as Thai Baht (+.3%) to 41.28, Singapore dollar (+.06%) to $1.6827 and the Taiwan dollar to $33.517. Formerly US dollar pegged currencies were also up, the Malaysian ringgit (+.24%) to $3.77 and China’s renmimbi (+.05%) to 8.0765.

Aside from remittances Ms. Soon also notes of the other currency analysts views of growing spread differentials for the Philippine currency responsible for its current gains, ``The currency yesterday extended gains to a 29-month high after a report this week showed inflation rose at the fastest pace in three months in November, stoking speculation of an interest-rate increase next week....The consumer price index advanced 7.1 percent from a year earlier, up from 7 percent in the previous two months, the National Statistics Office said on Dec. 6. The currency added 1.4 percent through the end of October after Bangko Sentral ng Pilipinas lifted its key interest rate on Oct. 20 to curb inflation from higher fuel prices. The bank on Nov. 17 kept its key interest rate at 7.5 percent.”

What am I driving at? The US dollar’s sterling gains this year relative to its major trading partners has been primarily prompted by the view of better returns relative to currency yield spreads as a result of the 12 ‘measured’ increases by the US Federal Reserves on its interbank lending rate from 1% to 4.0% with another rate increase anticipated this Tuesday, December 13th. To quote the IMF’s December 2005 Financial Market Update (emphasis mine), ``The U.S. dollar appreciated as growth and interest rate differentials remained in favor of the United States and outweighed concerns over structural weaknesses, leading to robust investment inflows. Foreign demand for U.S. dollar financial assets, particularly bonds, remained in excess of amounts needed to finance the country’s current account deficit...Emerging market bond spreads tightened to record low levels on improving fundamentals and the search for yield.”

In other words, today’s $1.9 trillion daily traded currency markets are obsessed with the chase for yields emanating from a glut of credit and money, prompting portfolio flows into currencies that maintains a prospective positive cash premium spread relative to comparable anchor currencies, such as the US Dollar, Euro or Japanese Yen. This spread arbitrage is widely known as the ‘Carry Trade’. Hence, the Philippine currency is NOT exempt from trading strategies assimilated by portfolio managers and thereby derives its strength LESS from the ‘seen’ remittance flows but mainly from the ‘unseen’ portfolio flows. Empirical evidence such as the declining peso denominated and dollar denominated sovereign bond yields suggests of indicators supportive of this view, i.e. being investor supported and so as with partial signs into the Phisix based on net foreign buying~ in spite of present consolidation.

However, this yield spread arbitrage trend is unlikely to persist once the US Federal Reserves ceases its interbank rate increases which may come into fruition by early 2006.

This is NOT to say that the Peso’s recent climb would reverse under such scenario, but rather once the structural infirmities of the US dollar would come into full view, as in 2002-2004, what could be expected in the currency marketplace would be a refocus on the present state of underlying fundamentals moored on growing intra-region economic and financial ties and the individual performance of emerging market economies.


Figure 4, Emerging Market and Global Yield differential spreads courtesy of IMF/JP Morgan and Merrill Lynch

As the recent IMF Financial Market Review (see Figure 4) notes (emphasis mine), ``Despite the rise in short-term rates in the United States, emerging markets have proven remarkably resilient to a variety of shocks, with emerging market external bond spreads falling to all-time lows. This resilience has been fostered by significant improvements in fundamentals, with emerging market countries having significantly reduced public debt-to-GDP ratios since 2002 due to strong economic growth, appreciating currencies and, in many cases, strong primary fiscal surpluses. Furthermore, external financing requirements for emerging market sovereigns and corporates have continued to decline as commodity prices rise and global growth boosts remittances from overseas workers.”

In short, the US dollar bear market in 2002- 2004 helped boosted fundamentals of emerging market assets particularly relative to sovereign and corporate bonds and had been doing so despite the recent rally seen with the world’s anchor currency. The realignment towards the purview of fundamentals from the yield perspective could help propel the Peso to maintain its momentum for further MODERATE gains in the coming year/s.

One must be reminded that the PESO has LAGGED the region such that today’s outperformance could be construed as simply a classic case of cyclical recovery.

In the present global economic milieu, immense disparities of purchasing power between developed and emerging market economies have created substantial economic opportunities for trade, service, goods production/manufacturing and financial exchange arbitrage, largely fueled by the web enabled technological revolution in information and communication services. The offshoot of this phenomenon has been to facilitate wealth redistribution to emerging market economies. It is for this reason why global capital flows are expected to continue to take advantage of Asia’s rapidly expanding economies, swelling consumer class backed by young demographics and fast developing markets.

For instance, the Philippines is ranked among the lowest in terms of Purchasing Power Parity (PPP) as measured by the Economist’s Big Mac Index as of June 9th (Peso at 54.95 or higher prior to the article’s composition). In US dollar terms a Big Mac cost $1.47 in the Philippines compared to $3.06 in the United States, $1.54 in Hong Kong, $2.34 in Japan, $1.53 in Indonesia, $2.17 in Singapore, $2.49 in South Korea, $2.41 in Taiwan and $1.48 in Thailand. Whereas the pegged currencies then of China and Malaysia (scrapped July 21st) where at $1.27 and $1.38, respectively. Essentially, this ‘PPP undervaluation’ could be one of the principal reasons behind the Business Process Outsourcing (BPO) as well as the Shared Service and Outsourcing (SSO) boom we are seeing at present (see November 14 to 18 edition: Age Of Internet Boosts Domestic Economic Environment) and a foundation for the Peso’s sustained recovery (barring further governance lapses or political instability).

Albeit I would caution you from adhering to some outlooks that give emphasis to simply technical dimensions in predicting the future directional values of the Peso. One must be reminded that economic construct of the Philippines is far distinct than its neighbors to assume a corollary.

However, going back to fundamental potentials, Goldman Sachs which four years ago, predicted the rise of the “BRIC”, the Brazil, India, Russia and China emerging market paragons with potentials to become significant economies relative to the world have now added its next eleven candidates to its roster.

Bloomberg Asian analyst William Pesek quotes Mr. Jim O'Neill, London-based head of global economic research at Goldman Sachs, dubbing the next generation of potential BRIC’s as ``Next Eleven, the list includes Bangladesh, Egypt, Indonesia, Iran, South Korea, Mexico, Nigeria, Pakistan, the Philippines, Turkey and Vietnam” based from the criteria which includes “macroeconomic stability, political maturity, openness of trade and investment policies and quality of education.”

Of course, this sanguine outlook does not presume or gloss over risks or incidences without any road bumps. As mentioned in the past, the present macro risks includes the sharp unwinding of intrinsic imbalances such as a sharp slowdown in the Chinese economy, a real estate led consumer retrenchment in the US, a collapse in the value of the Japanese Yen, a US dollar crash, a trade war or wave of protectionism, surge of consumer price inflation...among the others that may lead to unnerving investors, a possible liquidity crunch or portfolio outflows and reverse the pervasively positive sentiment for the region and its asset classes.

The risks could also be insulated in nature with regards to the domestic arena, particularly political destabilization and possible governance or policy lapses that could derail the semblance of progress as evidenced by the positive gains evinced by domestic financial assets.


Tuesday, December 06, 2005

World’s Mountain of Debts, The Bullion Crosses the Maginot Line

``The fundamental question is whether a central bank can manage the supply of money and credit better than the free market otherwise would. We shouldn't kid ourselves about the true nature of the Fed, which is inherently incompatible with real free market capitalism. Centralized planning of the money supply is a form of economic control that significantly affects prices, wages, and production levels.”-Congressman Ron Paul

If inordinate liquidity drives the global equity assets, various carry trades and the creation of myriad financial claims intermediaries have likewise spawned rising asset classes on a global scale.

To show you the collective thrusts of global governments underpinning the present inflationary cycle we note that government printing presses have been in full throttle cranking out eye boggling debts in an effort to appease short term demands by voters and investors alike. With the advent of paperless electronic money, today’s money system is produced by simply pressing on a single button.

Analyst David Fuller of Fullermoney.com says that the reason why all central banks are flooding the money system with paper money is because:

1. No country wants a strong currency due to globalization's competitive pressures.

2. They still fear deflation more than inflation.

3. They believe that they can get away with printing money because wage pressures are muted while China and other developing countries keep the cost of manufactured goods down.

Of course one cannot discount that given the high leverage of the today’s monetary system, the only way out of the debt cycle aside from debt repudiation is to invariably print more money to drive down the value of their currencies which they will use to pay back creditors!


Debt Pyramid Courtesy of Larry Edelson for Safe Money/Weiss Inc.

``Where you find major debt excesses — that’s where you can also expect the greatest pressures on governments to generate more inflation.” notes Larry Edelson of Weiss Inc.. Mr. Edelson enumerates the geographical breakdown of private and public debts into the following:

* Europe: $2.6 trillion

* Asia (excluding China): $747 billion

* Latin America: $760 billion

* Third-world countries overall: Some estimates place third world debt at $2.1 trillion.

* In the USA: Over $39 trillion. That’s more than $141,000, for every man, woman and child.

To consider these are interest bearing debt instruments which does not include:

the derivatives market which in the US alone stand at $96.2 trillion (Comptroller of the Currency).

Other financial obligations not included are the US government’s future state welfare commitments in Medicare and Social Security to the tune of $20 TRILLION, according to the US General Accounting Office study.

With similar welfare obligations subscribed to by governments of major industrialized economies as Japan and Germany.

Obligations by private companies to guarantee mortgage/asset backed securities underwritten by agencies as Fannie Mae and Freddie Mac.

In short, the mountain of debt has become so pervasive that it adds up to about $200 trillion (see table beside) or about 3 times more than the world’s GDP!

So while the inflationary nature of central bankers mostly in cahoots with politicians have spawned rising assets values, it has also fostered a highly levered consumer demand and excess capacities in various other parts of the world.

Today, the global commodity cycle has likewise been an outgrowth of the inflationary tendencies of collective governments.

Gold, Economist John Maynard Keynes’ (the paramount icon of Central bankers and politicians) barbaric metal crossed the ‘Maginot line’ to close above the $500 threshold level and register a 22-year high at $503.3 per oz.! Other metals hit pivotal milestones, Silver at an 18-year high, copper and lead to FRESH record highs, aluminum to a 16-year high and zinc to a 15-year high! Even sugar hit a 9-year high while cattle futures hit a two year high.


30-year Gold Chart Pre-Breakout courtesy of kitco.com

Some central bankers as Argentina, South Africa and Russia have aired their intent to increase Gold into their reserves, while the opening of the Dubai Gold and commodities exchange has expanded investor’s access to commodities.

First, my predictions for gold to hit these levels at this time frame have been attained albeit we could see some profit taking in the near future following its extended rise. To share the observation of CLSA’s jetsetting analyst Chris Wood, ``It is also hard to escape the thought that gold might be rising in the short term for the simple reason that just about everything else has been rising too.”

Second, for as long as central bankers continue with their inflationary proclivities, fiat currency values of all cuts will continue to see massive depreciations of their intrinsic values relative to finite precious metals and other commodities, regardless of a hyperinflationary or a deflationary outcome.

Third, gold has cut a swath along major currency levels signifying a new phase in its bullmarket and underscoring my outlook (see September 12 to 16 edition Gold At Fresh 17 Year Highs; Currency-wide bullmarket begins!). To quote veteran analyst Richard Russell of the Dow Theory Letters and one of Wall Street top market timers,

``Gold has entered a new phase. This phase is characterized by gold separating itself from all paper currencies including the dollar. It's clear that something has changed -- that gold is now being accepted by sophisticated investors, not as a speculation, but as an alternative currency. Thus, over recent weeks while the dollar was strong, gold has continued to climb. Such action would have been considered almost impossible even a few months ago.

``Gold is now being accepted as the fourth currency along with the dollar, the euro and the yen. But there is a difference. Gold is also being recognized as the tangible currency and the ONLY SAFE currency. That gold pays no interest -- but is still at an 18-year high in terms of dollars -- is a testament to its value and safety in the eyes of sophisticated investors."

Fourth, rising gold prices across all major currencies are not merely signs of attendant inflation (expansionary money policies and NOT rising prices) but rather symptomatic of underlying monetary stress in contrast to what has been parlayed by mainstream media. While gold has risen alongside the US dollar in the interim, this does not mean that the US dollar’s woes are over (see above). Nor does Warren Buffett’s trimming of his anti-US dollar losses suggest that he capitulates! In fact, outgoing Federal Reserve Chair Alan Greenspan in his latest public appearance admonishes on the possible significant impact from the fiscal imbalances ``In the end, the consequences for the U.S. economy of doing nothing could be severe.''

Lastly, gold is now prominently featured as an alternative investment class which has slowly pervaded into the mainstream school of thought. Alongside most of the contrarian analysts, I believe that gold is in a fledging phase of its bullmarket cycle with conservative targets at $873 per oz (1980 nominal high) and about $1,800 (inflation adjusted) over the coming years. It is when mainstream bankers and hard core central bankers ‘capitulates’ or turn into the bullish gold camp when its climax would have been reached. As far as we are concerned the indicators of bullishness are still within the periphery.Posted by Picasa