Sunday, May 21, 2006

Global Capital Flow Analysis;Raising the Yellow Flag!

``If a man gives no thought about what is distant, he will find sorrow near at hand”-Confucius

If there is anything that has been validated during the past week or so, is that global markets have been porous and that capital or portfolio flows have reflected a singularity of action across a variety of asset classes all over the world. This is what I have been writing about all along, that the world financial markets have been evolving towards increased integration such that global capital flows have been materially correlated to the directional paths of the financial benchmarks, including that of the Philippines. In the words of acclaimed French critique and Nobel Laureate Andre Gide, ``Everything has been said before, but since nobody listens we have to keep going back and beginning all over again.”

Well, some of my contemporaries have commented on these, mostly taking a leaf out of the observations from the international media, yet the others appear to be in a pertinacious state of denial citing “knee-jerk” reactions over what has been happening. Knee-jerk reactions are usually a very short-term phenomenon and not stretching over a week or longer.

On the other hand, there are also some who bluster about some arcane formulaic “timing” elixirs towards stock market investing. Of course, I have to admit that at times there have been occasions where “hot strategies” had one way or another worked, such as the Nifty Fifty in the late 60’s or the Dogs of the Dow in the 1990s, however, once they have become too popular or when the crowd starts to jump in they cease to deliver what is expected of them. Further, these erstwhile “hot strategies” were not timing tools, unlike those ventilated by our local “hotshots.” Market savant Warren Buffett once admonished on this, ``Read Ben Graham and Phil Fisher, read annual reports, but don't do equations with Greek letters in them."

Raising the Yellow Flag

``All of our knowledge has its origins in our perceptions." Leonardo da Vinci

Today’s investing environment seems to manifest a ‘yellow’ or warning flag. In my case, such milieu translates to a necessary action: portfolio underweighting. I have learned to identify cautionary indicators on the following circumstances; when “there are more fools than money than of money more than fools”, when “cost of capital rises above returns of invested capital”, and/or when “the risk prospects rises above rate of return potentials”.

I have noted in our previous outlook that world financial markets appear to have weakened arising from explanations in the causalities of “continued higher interest rate expectations and high inflation data” when these phenomenon has bizarrely been long imbedded into the financial markets or into the global economic framework for quite sometime.

As argued for last week, as in the past (see November 14 to 18 Inflation Cycle A Pivotal Element to Global Capital Flows) global central banks have nurtured the seeds of another secular inflationary cycle as to pump up economic growth taking advantage of the “disinflationary” backdrop caused by the inclusion of formerly closed economies as China and India, which have greatly contributed to competitive “low price/cost” pressures of globalization via the transmission mechanisms of excess capacities and labor surpluses (in the past), aside from the rapidly evolving technological breakthroughs especially in the field of information technology and communications. Of course, such inflationary cycles would vacillate over the long term with peaks and troughs rising over generations and have been manifested in the past by rising gold and commodity prices as discussed previously (see March 27 to 31 edition, Listen To Your Barber On Higher Rates and Commodity Prices!).

In short, I am predisposed to think that ‘rising inflation and interest rate concerns’ have served as the scapegoats for the largely vulnerable investing public seeking for “oversimplified” explanations to the present crosscurrents.

US led Global Market Correction


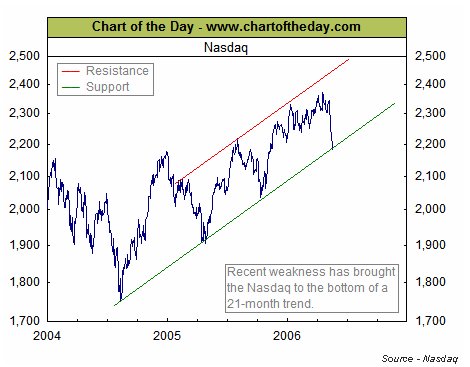
Figure 1: Chart of the Day: Nasdaq Testing Critical Support

While there have been incipient signs of stresses in a rather risk complacent or previously low volatile world, the recent selloffs in Iceland’s currency & bonds and the crash of Middle East bourses from their stratospheric perch could have been a warning signal. But no less than the recent swoon in the US markets have led to a ripple effect throughout global financial markets not limited to equities (suggested reads from the GuardianTen days that shook the world's markets”).

Figure 1 shows of the former market leader the major technology weighted benchmark, the Nasdaq, courtesy of Chart of the Day, testing on its 21-month CRITICAL support level. The Nasdaq and the major US benchmarks could be expected to bounce off coming in the coming sessions from the succession of serial selling (due to technical oversold levels) but needs to keep the 21-month trend intact.


Figure 2: Philadelphia Housing Index Breaks Down!

Could this be a mere hiccup? With the US debt driven and consumer led economy banking on its housing or real estate industry for continued financing of its consumption driven engine, the recent breakdown of the benchmark housing index as shown in Figure 2 aggravates my concern about the resiliency of the global markets, especially under the background of an inimical continued tightening “expectations” and high energy prices. Rising cost of capital appears to be edging towards or closing in on Returns of Invested Capital?

Aside, according to estimates by economist Ms. Asha Bangalore of Northern Trust, ``housing has accounted for roughly 40 percent of new private jobs since the end of the recession.”


Figure 3 courtesy of Northern Trust, Rising Rents and Slowing Homeownership in the face of rising rates

In another case of what goes around comes around, the US CPI index which was allegedly designed to suppress inflationary indicators for political and financial expediency has manifested rising inflation figures emanating from an emerging trend of RISING Rents!

Bloomberg analyst Caroline Baum in her recent article wrote (emphasis mine), ``Sure, owners' equivalent rent, an imputed rental measure that is 30 percent of the core CPI, accounted for 40 percent of the April increase. But it was that same component that artificially depressed the core CPI in 2003. And the Fed wasn't warning everyone that inflation was understated.”

As shown in Figure 3, courtesy of Asha Banglore of Northern Trust, the left chart shows that from the depths in 2003, rents as manifested by Rent of Primary Residence (blue line) and Owner’s equivalent Rent (red bars) has been on an emerging uptrend to collaborate the views of Ms. Baum. This comes in the face of rising mortgage rates (30-year red line), as depicted on the left chart, coincidental with an equally “toppish” percentage of homeownership (blue line).

In other words, the global financial markets could have been telling us possibly of an unraveling of the US real estate industry which is expected to slowdown the consumption driven US economy.

As to whether the Big “R” word comes into fore, or is simply just a slight deceleration remains to be seen. However, in ten days, what has clearly devolved was of a well know axiom `` when the US sneezes the world catches cold”. As to when a probable divergence among asset class would emerge remains to be seen. An attendant sign of rising prospects of risk/uncertainty relative to returns?

Commodity and Bond Markets Aver!

One thing that I learned and adhered from one of my favorite strategic thinkers Dr. Marc Faber is that not to listen to analysts but to listen to the markets instead. And that is essentially what I have been doing; interpret from what the market is essentially saying instead of trying to portray myself as “intelligent sounding” as most contemporary analysts are wont to do. It is the same premise that I ask you not to listen to me but to make your own deductions from your source of data. This outlook is simply a result of my lowly research to aide my decision making process relative to investing which I have been imparting with you.

For those of you who can recall, I mentioned during the last outlook that signs had been that the outstretched prices of precious metals have been petering out. I have likewise suggested you to take profits off the table for some mining issues which remained exceedingly overbought.


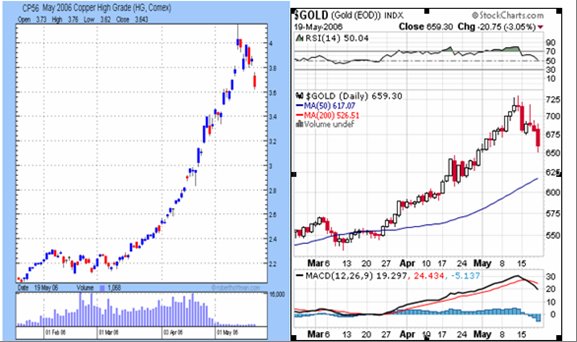
Figure 4: courtesy of stockcharts and futures.tradingcharts.com shows of confirmed downward dynamics of Copper and Gold

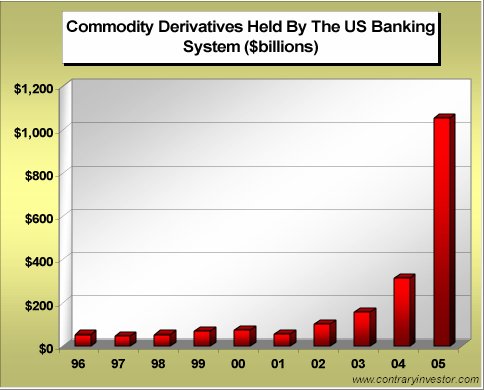
If inflation had been the “primary” concern then why has gold been going down as well, (when gold is widely reputed to be an insurance against inflation)? One may explain that the surge in gold prices has “come too fast too soon”, which appears to be a big possibility, aside from of course, the possible unwinding of several hedge funds positions which recently piled upon the monetary metal as previously evinced by the huge jump in commodity derivatives (see May 1 to May 5 editon...and the Falling US Dollar Index For a Rising Phisix, Albeit Caution is Warranted).

Over the week, gold fell $54.30 or 7.6%, whereas copper has lost 10.2%, silver down 13.2% and palladium off .6%.

Although relative to copper prices, its recent furious rise amidst the prospects of a slowdown is nonetheless an expected development. According to metalprices.com, ``Building construction accounts for more than 40% of all copper use. Residential construction is about two-thirds of the USA building construction market.” In short, falling metal prices (industrials) appear to be conforming to the recent US led decline in the global financial markets bolstering my case for a US led slowdown.

With the prospects of a material correction in key metal prices (as shown above) which may continue for quite sometime, confirmed by the downward dynamics in its prices, compounded by attendant increase in volatilities in the global financial markets, and coupled with a possible risk of a slowdown in the global economies, I would suggest for you to take rebounds as opportunities to significantly underweight on resource based issues. While I remain bullish over the long cycle for the resource based investments, the possibility of a sharp correction could be large enough to merit buying on bargains instead of simply holding on.


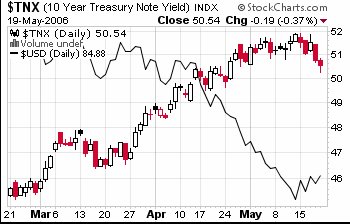
Figure 5: Rallying US dollar and falling US 10 year yields

Finally, US treasuries appear to be mounting a rally, following the recent sharp selloffs, as shown in Figure 5, in the light of a firming US dollar. Rallying US sovereign bonds deemed as “risk free” are essentially a flight to safety. Gold’s recent infirmities have spurred the rally in the US treasuries. It likewise could be interpreted as a short term respite from inflationary expectations, ergo appended outlook for a possible economic deceleration in the US.

Further, the firming US dollar could be emblematic of a “lighting rod” syndrome following the recent shocks. These developments highlight capital efflux from global assets back into the US dollar and US bonds, for the moment. Again, all these are manifestations attendant to intensifying volatility, increasing instability and heightened risk of a slowdown.

In Asia for instance, currencies fell almost across the board mostly on outflows from equity markets. According to Bloomberg’s Jake Lee, Indonesia’s rupiah fell 5% while its equity benchmark fell a massive 7.9%! ``For the week the Thai baht, Philippine peso, Singapore and Taiwan dollars also weakened. The baht dropped 1.1 percent to 38.11 per dollar. The Philippine peso slipped 1.8 percent to 52.68, according to the Bankers Association of the Philippines. The Singapore dollar declined 1.4 percent to S$1.5838. The Taiwan dollar lost 1.8 percent to NT$31.948...The Korean won dropped 1.5 percent this week to 946.25 per dollar, according to Seoul Money Brokerage Services Ltd.” It has indisputably been a global event.

Derivatives Provoked??

There are of course, jitters that the present shakeout had been derivatives based. Leveraged derivative positions on stock markets or ``variance swaps” have been forced to close due to the recent spike in stock market volatility. Gillian Tett of the Financial Times reports, ``The recent sharp falls in stock markets appear to have been exacerbated by an unusual wave of derivatives activity on the part of hedge funds and big banks, some traders on Thursday indicated...In particular, some banks and big investors appear to have been forced into selling large amounts of equity futures because they have been taking large, leveraged bets on the direction of stock market volatility in recent months – and these bets are now unravelling because the equity markets have recently fallen sharply.”

Some may argue that the recent declines may represent Wall Street’s metaphorical tenet of buying “when blood is on the streets”. But this is no blood on streets. Blood on the streets denote of panic, outright fear or of bullish capitulation. The global financial markets are coming off from record highs (“euphoria” so to speak) which means that given the profuse liquidity backdrop and the reduced risk premia, there had been more fools than money or fools chasing for money, in the hope that a greater fool would assume his risks (Greater Fool theory).

There are those who take on a bullish outlook as the BCA Research, which views the diminished prospects of inflation based on the activities of bonds would set pace to a next rally phase. My assumption here is that BCA could be expecting the FED to sanguinely resolve its present dilemma (raise rates provoke a slowdown; pause and risk runaway inflation). I doubt such optimistic resolve but instead share of Dr Frank Shostak’s, of the Ludwig von Mises Institute, viewpoint (emphasis mine)...

``Sooner rather than later, Bernanke's Fed policy will assume a reactive nature — the US central bank will respond to the data. The fact that the data tends to mirror the effect of past Fed's monetary policies means that the Fed is likely to respond to its own past actions.

``The Fed tries to control the future but ends up only chasing its own tail, which leads to more confusion and uncertainty. All this could be further aggravated if Bernanke were to start setting targets for price inflation. As is always the case with centralized monetary planning, attempts to stabilize only bring about more destabilization.”

In essence, the markets today have been running on ambivalence. As to whether this signifies as simply a typical correction or most importantly, a possible critical threshold that embodies an “inflection point” is something that has yet to be established. As such, prudence would be a better alternate to valor. Staying on the sidelines would be rather judicious while waiting for the markets to resolve its impasses or until a clearer trend would have surfaced.

To recap, the present market debacle has been attributed by mainstream media and personalities to “rising inflation and interest rate expectations” whereas markets appear to tell us that an economic growth deceleration by the US could have been the effective trigger for the recent selloffs. This has diffused into the global markets and among a variety of assets. Moreover, circumstantial evidence reflects on a possibility of a derivative ignited carnage. Under both circumstances, heighten volatility presently suggests more than a simple shallow correction but of a possibility of the risk of a major “inflection point” or a market “top” (US).

The selloffs has markedly damaged several financial market indicators such that even if we expect a short term bounce off the oversold levels, present threshold levels need be mended or rectified as to be reckoned as merely “short term” blips.

Under the shadow of greater risk more than the prospects of returns, plus rising expectations of a narrowing margin between cost of capital and returns on capital, plus manifest dominance of more fools chasing for lower profits, I would take to consider the present environment as underweight or alternatively overweight cash or short term bonds (for Peso denominated assets).

Saturday, May 20, 2006

Bloomberg: Commodities, Led by Metals, Have Biggest Weekly Drop Since 1980

Time for that much needed pause....an excerpt from Bloomberg:

"Commodity prices had their biggest weekly drop in more than 25 years, led by metals and grains, on speculation that higher interest rates will erode the appeal of copper, gold and silver as alternative investments.

The Reuters/Jefferies CRB Index of 19 commodities fell 5.4 percent this week, the most since December 1980. The CRB reached a record on May 11, fueled by investor demand for gold and shortfalls of industrial metals such as copper. Oil declined to a six-week low today from a record last month as U.S. fuel supplies gained and tensions over Iran's nuclear program eased.

``The speculators are piling out of the metals,'' said James Vail, who manages $700 million in natural-resource stocks at ING Investments LLC in New York. ``There's been so much money made in this sector that people are trying to protect themselves. There was skepticism on the upside, and now there's panic on the downside.''

This week, copper plunged 10 percent, the most since October 1994, and gold tumbled 7.6 percent, the biggest drop in more than 15 years. The CRB Index dropped 19.46 this week to 342.29. It reached a record 365.45 six sessions ago."

Monday, May 15, 2006

Inflationary Pressures Long Extant; Asian Equities Depends on Growth

``By a continuing process of inflation, governments can confiscate, secretly and unobserved, an important part of the wealth of their citizens.” -- John Maynard Keynes

We are living on interesting times indeed.

The Phisix remained vivacious (up 1.94% week-on-week) amidst the recent precipitate correction across diverse asset classes in the global financial markets. (Needless to say, the Philippine benchmark has been markedly supported by torrential foreign money inflows and surprisingly inexorable signs of continued enthusiasm exuded by local investors taking up a majority of last week’s trading turnover despite the huge groundswell in aggregate peso volume turnover sans special block sales.)

Whereas in contrast to 2003 to early 2005, despite the falling US dollar trade weighted index, global markets rose on a tide of ex-US dollar asset accumulation, today, we are witnessing an antipodal perspective; falling markets in synchronicity, as shown in Figure 6.


Figure 6: Dow Jones Asia and World Stock Index (left), JP Morgan Emerging Bonds and Morgan Stanley Dean Witter US Government Trust Bond Index (right)

One week does not a trend make though, yet what is bruited about by mainstream media as the causal factor behind the series of decline is of the growing “inflation” concerns as exhibited by rising commodity prices. And that being so, rising inflation would translate to the FED continuing to raise interest rates. I have noted that rising gold prices has in the past signaled rising interest rates (see March 27 to 31 edition, Listen To Your Barber On Higher Rates and Commodity Prices!).

Hogwash!

Today’s market has been dissonant. Commodities have been rising since the advent of the millennium (media notices it only now?). Second, if the Fed’s continued rate increase is a concern then why is the US dollar down 1.3% this week to its lowest level since March 2005, considering that the trade deficit has fallen below expectations should have ameliorated its cause? Should it not be that rising short rates would benefit the US dollar by manner of a larger yield disparity as the case was throughout most of 2005?

Inflation has long been extant in the financially driven global economy suppressed only by government’s manipulation of its statistical data.

For instance, courtesy of Gavekal Research as shown by Figure 7, three leading indicators have been warning of a rising clip of economic growth indicative of emerging inflationary pressures since its trough in 2005 in OECD countries.


Figure 7 Gavekal Research: OECD leading indicators

Second, in the US, the changes enforced or effected by the different administrations (from the Clinton regime to the present) on the computation of the key inflation indicator, the Consumer Price Index (CPI), has arbitrarily suppressed the inflationary figures.

Economist John Williams see figure 8, shows that using past methodology prior to the massive changes in the statistical makeup of the present CPI framework, CPI figures are running about 3 percentage points above officially stated figures!


Figure 8: Shadow Government Statistics: Alternate CPI Measures

Such is the reason why Gold and commodities are running berserk simply because real interest rates are still in the negative! This translates to effectively a still EZ money policy in spite of the recent 16th rate increase by the US Fed.

What we could possibly be seeing now is a symptomatic prelude to a US dollar run, if gold ever hits over and above $1,000 per oz, aggravated by signs of continued decline of US sovereign bonds and rising inflation pressures! Again I don’t wanna sound alarmist but we’ll take the market as it is.

Finally, rising currencies have not been detrimental to the advancement of the equities in Asia, but a slowing world growth will, notes the BCA Research’s on its latest outlook on present currency trends and Equity performances Asia; (emphasis mine)...


Figure 9: Emerging Asia Rising Currencies and stock Indices

``Currency appreciation will not derail the Asian equity advance unless global growth decelerates markedly. Asian currencies have been steadily appreciating against the U.S. dollar this year, with a weighted basket up nearly 4% year-to-date. But the rise in regional currencies has not proved to be a headwind for stocks—while Asian equities have lagged their emerging market counterparts, they have posted solid gains this year. Moreover, with the U.S. dollar falling against other major currencies, Asian currencies remain cheap on a real trade-weighted exchange basis. The bottom line is that a modest, albeit steady, appreciation of Asian currencies will not prevent the region’s equity markets from moving higher.

Need I say more? Posted by Picasa

A Real Estate Boom in Asia Pacific

Even prior to the recent improvement seen in the domestic equities market, one industry that has benefited from overseas remittances inflows has been the real estate industry (see January 10 to 14 edition As the Peso rises, Domestic Investment Stocks Lead the Way).

In addition, the prospects of a domestic investment led recovery could augment the industry’s present conditions, (see November 29 to December 30, 2004 Domestic Investment to Help Drive the Phisix?).

Aside, parallel roseate growth prospects from the services sector; particularly, the information and technology, Business Process Outsourcing (BPO) and Business Services Outsourcing (BSO) (see November 14 to 18, 2005 edition, Age Of Internet Boosts Domestic Economic Environment), tourism and the medical services could help churn a ‘critical mass’ to bolster the industry.

Notwithstanding, the recent surge in the prices of soft commodities such as sugar, rice, coffee and other agricultural products could likewise attract sufficient investments that may lead to more demand for properties catering this previously depressed sector, one which has a sizeable impact to the rural population.

Moreover, relative to investment flows, growing regional trade, financial and economic integration could help boost direct or indirect demand for various categories of properties in the country.

Finally, the rising Peso has been providing for a subliminal trigger for local investors to reinvest back into Philippine based assets, as well as, foreign portfolio flows into the country considering a higher yielding currency relative to its traditional favorite safehaven; the US dollar, given the present deluge of global liquidity. Ergo, the Philippine real estate sector could be seen as one channel or beneficiary for possible investment flows from local or foreign investors looking for outsized or above average profits.


Figure 3: USD/Philippine Peso (blue line) and Philippine Property Index (black candlestick)

As shown in Figure 3 the recent attempts by the USD/Philippine Peso to fall or a rising Peso coincided with a jump in the Philippine Property Index as indicated conversely by the red arrows above, i.e. peak USD/PHP=trough Philippine Property Index and vice versa. In short, somewhat like the Phisix, the Property sector appears to manifest an inverse relationship in its movements with the local currency vis-à-vis the US Dollar.

By the way, the domestic Property bellwether consists of the two major heavyweights such as Ayala Land and SM Primeholdings , as well as second and third tier issues such as Belle Corporation , Camella Palmera Homes , Cyber Corporation , Empire East Land , Fairmont Holdings , Filinvest Land , Megaworld Corp. , Metro Pacific Corp., Robinson’s Land Corp and Uniwide Holdings .

I find it refreshing to see the widely followed and respected Canadian independent research outfit, BCA Research, conform to my views. In its latest outlook entitled ``Asia-Pacific Real Estate: Laggard Poised To Outperform”, Bank of Credit Analyst highlights on a possible catch up by Asian real estate markets, writes BCA (emphasis mine)...

``Asia-Pacific real estate markets should catch-up to the global housing boom in the next few years...The 1990s property bubbles in several Asia-Pacific markets have been fully unwound, and real estate in this region is now perking-up anew. However, the recoveries have been very subdued compared with real estate market trends in the rest of the world. This is consistent with history: Asset markets which have experienced a mania and a consequent bust tend to stay depressed for a period and, as a rule, underperform their peers for some time. Looking forward, fundamentals suggest that Asian property markets are set to deliver solid gains in the years to come, outperforming those in the Anglo-Saxon world.”


Figure 4: BCA Research: A Real Estate Boom in Asia-Pacific

While BCA has ostensibly omitted the Philippines and Indonesia as part of its portfolio outlook, the movements of the Philippine Property index has been consistent or congruent with their analysis in spite of the omission as shown in Figure 5.


Figure 5: Philippine Property Index’s J.LO Bottom

Over a long term perspective, the recovery seen in the sector has been validated by its latest “rounded bottom” breakout or in Wall Street’s lingo a ‘JLO’ bottom breakout when reckoning from the 1999 high.

Today, the Philippine Property index is seen advancing towards its 1996 high of 1,793 buttressed by another huge and massive JLo bottom (from 1996 to date) formation, as marked by the blocked arrow.

As of Friday’s close it is about 600 points away from the 1996 target which looks quite realizable over a medium term perspective (1-2 years or even less!).

In short, it is imperative for a Peso based investor (local or foreign) to allocate a significant portion of their portfolio to the said real estate sector to achieve Alpha “outperformance” returns. And to use dips in the market to accumulate. Posted by Picasa

Wednesday, May 10, 2006

Bloomberg: Copper Rises to $8,000 a Ton for First Time as Metals Rally

Global Liquidity chasing profits....and pushing up commodities....

From Bloomberg's Chanyaporn Chanjaroen:

Pension and hedge funds are pouring money into commodities as raw materials from sugar to oil produce returns that are outpacing other assets. Crude oil has gained 16 percent this year in New York and traded above $71 a barrel today. Fund investments in commodities may exceed $120 billion by 2008, up from $80 billion last year, according to Barclays Plc.

Sunday, May 07, 2006

Philippine Peso: Loss of Export Competitiveness Against Who?

``The wild geese do not intend to cast their reflection; The water has no mind to receive their image.” -Zenrin poem, The Way of Zen

This reminds me of the undue harangue by a slew of experts on the alleged “ills” of a strong Peso (“damned if you do and damned if you don’t” situation). In an incisive article, ``Will a unicameral parliament save us?” Honesto C. General business columnist for the Philippine Daily Inquirer enumerates the flawed cumulative economic policies adopted by the past administrations that have led to the country’s present predicament.

In short, his message was that when government assumes to know in behalf of its constituents and adopts policies in what it believes is for the better, in most instances THEY HAVE BEEN WRONG. And it is us who pays for such flawed policies instead of allowing market forces to determine where resources are best allocated for. More interventionism translates to more government bureaucracy, more red tapes, more corruption, and a more distorted economy. Think Soviet Union, central planning’s showcase. To quote leading Free Market advocate Ludwig Von Mises, ``Economic interventionism is a self-defeating policy. The individual measures that it applies do not achieve the results sought.”

Of course, I do share the concern that a precipitate surge in the Peso may lead to the so-called “Dutch Disease” or ``the deindustrialization of a nation's economy that occurs when the discovery of a natural resource raises the value of that nation's currency, making manufactured goods less competitive with other nations, increasing imports and decreasing exports. The term originated in Holland after the discovery of North Sea gas” (investorwords.com). However, it appears that the present developments (belated Peso rise) does not highlight to such scenario, but instead reflects on the global if not regional trends. Yet, strong Peso critics argue most frequently about the “loss of export competitiveness”...against which currency?


Are we referring to our neighbors or to our distant relatives at the far side of the globe?


As you can see in three instances above except for Argentina’s Peso, the Brazilian Real, the Thai Baht and Indonesia’s Rupiah has appreciated steadily against the Philippine Peso over the 5 years period, with the Philippine Peso’s current belated rally providing for a countertrend rally but have not broken the main trends, i.e. Philippine Peso depreciates against “competitor” currencies. While following the debt default of Argentina in 2001, the Peso is just about neutral relative to the Argentine’s Peso.

Ergo, the firming of Brazil’s currency as well as by our neighbors’ demonstrates that the Philippine Peso has lagged the marketplace for quite sometime, thereby its present appreciation has not had a substantial material effect, thus far, on the so called “export competitiveness”. If taken at a converse perspective, since the Peso has depreciated largely against its “competitors” over the longer period, then presumably given the single dimensional focus on the “price component” as manifested by the underlying currency, then we should have gained “export” market share, bilaterally or through the world market, at their expense. But have we done so? Nicolas Taleb in his book Fooled by Randomness promptly explains, ``but economics is a narrative discipline and explanations are easy to fit retrospectively”.

Moreover, present world conditions highlights the increased dimensions of globalization as manifested by expanded linkages through trades, economic and financial integration can now be seen through the attempt to integrate the region’s monetary system whose possibility I discussed three years ago (see September 15 to 19, 2003 edition, the Emerging Asian Economic Bloc). According to Shehla Raza Hasan writing for the Asia Times Online notes that ADB plans to revive the adoption in June of the ACU (Asian Currency Unit) or the ``notional unit of exchange based on a "basket" or weighted average of currencies used in the 10 member states of the Association of Southeast Asian Nations plus South Korea, China and Japan”, for purposes of a single common currency to bolster the region’s capital markets, economic integration and cross border transactions. With the region’s growing realization of the need for an alternative form of currency, it is a wonder why too much effort have been spent looking for solutions that ran backwards. Interestingly, have not the G-7 in their latest communiqué, exhorted Asian nations to allow for “greater flexibility of exchange rates”? Posted by Picasa

Mission Impossible...Accomplished?! Thanks To Surplus Liquidity...

``If you’re just in it for the money or you view the market as a way to get-rich-quick, you’ll never have the urge to examine your mistakes. You’ll keep falling into all the common traps... reaching for the moon, not cutting losses, and over trading. Sooner or later you’ll blow up.” Tom Dyson, Daily Wealth

Life’s little miracles. For the longest period, the market seems so intricate to read or comprehend and at the next it seems so simple; everything seems to fall into places as if by design. In another instance of serendipity, in this game of chance, how fortunate of me to have the market play out the route of history. And from history your analyst appears to have captured these observable patterns in a bottle. In my March 20 to March 24th edition, (see From Theme Based to Momentum Investing; It’s Horse Racing Time), these previous patterns were used as basis for my projections, particularly two invariable targets, namely the Phisix benchmark (2,457) and a defined time frame (early May).

Here is what I wrote then (emphasis added)...

``Of course, we understand that history does not necessarily repeat itself but it may rhyme. I have dealt on this last year (see November 7 to 11 Market Timing: Preparing For the Christmas Rally) but the Phisix failed to breach the critical threshold level. With this NEW episode, the pattern may have the chance for it to hold.

Now the table below shows of the 5 past runs.

Start

End

Months

Troughs

Peaks

Points

in %

29-May-03

4-Jul-03

1.5

1048

1308

260

24.81

1-Sep-03

4-Nov-03

2

1192

1432

240

20.13

27-Nov-03

23-Jan-04

2

1313.98

1565.56

251.58

19.15

26-Aug-04

4-Oct-04

1.5

1547.35

1853.29

305.94

19.77

16-Dec-04

8-Mar-05

2.6

1804

2172

368

20.40

24-Feb-06

????

2047.62

Table 1: Observable Patterns

“During the previous winning streaks, two patterns clearly emerges. One, the Phisix has returned by about 20% on the average and second, the average time frame of a run is about 2 months before it expires or goes to a pause.

“So if we take the February 24th low as a starting point of the present run then 20% returns would be equivalent to 2,457 for the benchmark index. Presently that means an upside of about 11%. By Phisix, we mean the heavyweight component issues such as PLDT, SMC, Globe, BPI, Ayala Land, Ayala Corp, Metrobank, SM Primeholdings, SM Investments, Jollibee Foods and Petron Corp could be expected to have a return of 11% on the average (some above, some below) IF the pattern holds true. Second, if two months will be the reckoning period for the prospective upside steak as in the past, then we could be looking at the end of April to early May for the Phisix to possibly peak out.”

As of May 5th or Friday’s close, the Phisix leapt over and above my target at 2,457 to 2,470! Talk about sheer providence or LUCK!

Well, over the week, the Philippine benchmark posted the best gains among Asian bourses up 8.8% to a seven-year high (you know that...it’s splashed all over media!!!), while recording a 17.85% return on a year to date basis.

Yes, I have read and heard a mouthful as to the supposed causality behind the Phisix recent success, and am delighted to see SOME of my contemporaries seeing the daylight among the clutter of balderdash.

You’d be surprised to learn that compared to the nascent phase of an advancing Phisix in 2003 to 2004 which had been dominated entirely by foreign money, last week’s abbreviated trading week recorded vivacious trading activities by the local investors quite similar to the developments seen in early 2005, which pumped up the market’s turnover even if we exclude the huge cross transaction of Mr. Enrique Razon’s buyout of ANSCOR’s holding in International Container Terminal .

Put bluntly, this time around, the hefty gains that you see in the Phisix had not been limited to foreign portfolio flows, as local investors have initiated sizeable participation over the buying activities in the broadmarket, lending credence to my theory that local investors have been shifting to reinvest into local currency based assets on the basis of better profit returns opportunities comparable to previously parking their ‘savings’ into US dollar denominated ones. Needless to say, the Peso’s rise had been one of the major subliminal psychological triggers for local investor to the join the ongoing rush to accumulate equity assets listed in the Philippine Stock Exchange.

However, as in the previous runs since the Phisix cyclically reversed in 2003, foreign portfolio inflows have been the leading exponent of equity accumulations, despite the mephitic political mileu and this run makes it no different. Portfolio flows have reached a March 12, 2005 high of over P 3 billion pesos or in just four days where foreign inflows contributed to about 17% of aggregate turnover at P 3.013 billion. As usual, these torrential deluges of foreign capital are symptomatic of global excess capital seeking for profit opportunities or “money chasing too few profits”. Wayne Arnold of the New York Times captures our thoughts in his article, ``Turmoil in Asia Doesn't Dent Investors' Enthusiasm for Its Markets” (emphasis ed.)..

In the Philippines, the president is facing protests and accusations of corruption after warning in February that elements of the military were planning a coup d'état. Yet foreign purchases of Philippine stocks are at five-year highs, the benchmark index is up 3.4 percent and the Philippine peso has appreciated about 8 percent. To some extent, this remarkable sangfroid with regard to Southeast Asia stems from a faith that political turmoil is not undermining economic growth. But economists and analysts say there is a bigger factor: a glut of global savings that is making cheap capital available to both heavily indebted rich economies and riskier developing countries. The resulting avalanche of global investment capital has become largely impervious, they say, to the political risks that often buffet Southeast Asia's accident-prone economies.

Let me remind our readers that the fabulous developments on the Phisix essentially reflects on a belated move by our equity benchmark relative to its peers similar to the latest outburst by the Philippine Peso.

...and the Falling US Dollar Index For a Rising Phisix, Albeit Caution is Warranted

``Successful investing doesn't require above-average intelligence because it is not an intellectual challenge; it is an emotional one and, I believe, it is a challenge most of you are capable of meeting head on and winning. If there's anything 'clever' about what I do, it is recognizing what works and ignoring what doesn't.”-Mark Shipman: The Next Big Investment Boom

Going back to the equities markets; to broaden your perspective, you must be enlightened that today’s activities have NOT BEEN limited to the country but is seen in most parts of the world through major benchmarks.


Figure 3: MSCI Emerging Free and the Dow Jones 1800 Asia Pacific Index

World markets are being driven to record highs following the expectations of “stimulative” monetary conditions from signals that the US FED maybe going into a “pause” (discussed last week).

Markets in the US (2000-2001 high), Europe (2001 high), in Latin America and Asia have been treading in fresh watermark highs as reflected in Figure 3, the MSCI Emerging Free Index and the Dow Jones 1800 Asia Pacific Index. This shows that Emerging market bourses, such as Brazil, Mexico and India have set new record territories which bolstered the Emerging market benchmark, while Asia’s index likewise being buttressed by record gains in Singapore, aside from near record territories by other Asian bourses as Australia, Taiwan and etc. Bloomberg’s Chen Shiyin reports, ``The Morgan Stanley Capital International Asia-Pacific Index, a dollar-based index that tracks shares in 14 markets across the region, added 2.7 percent to 140.75 this week, surpassing the previous all-time high of 140.41 set on Feb. 23, 1989. All 10 industry groups that make up the measure advanced.”


Figure 4: US Dollar Index Loss; Phisix Gains

As explained last week, the falling US dollar trade weighted index has had a “stimulative” aftereffect to emerging market assets. As such we have been seeing an accelerated increase in the prices values of world equity indices, as well as in commodities to emerging market equities.

In particular, I have noted that the Phisix experienced its cyclical reversal when the US Dollar index peaked in 2003 backed by the Fed’s flooding of the global marketplace with superfluous liquidity to arrest any prospects of deflation. The Phisix climbed at the back of intense foreign buying then until early 2005 as foreign money played the US dollar diversification theme.

For most of 2005, as the US dollar recovered on the premise of interest rate/yield differentials while the Philippine market practically stood still or traded rangebound. As shown in Figure 4, the mid April collapse of the US dollar index has been inversely associated with a positive reaction from the Phisix once again bolstered by foreign portfolio flows.

What this basically shows is that the Phisix appears to have a strong negative correlation with the US dollar index. A weakening US dollar appears to feed upon the appetite of foreign portfolio flows into Philippine assets.


Figure 5: Phenomenal Growth of Commodity derivatives

As a measure to the exponential growth of world surplus liquidity contraryinvestor.com shows us of the bulging commodities trade underpinned by exploding derivatives held by US banks!

While global monetary authorities have the power to control the liquidity valves, as to where it flows is practically beyond their reach. Here the authors of contraryinvestors.com suggest that to profit from present liquidity flows simply means to “follow the money” (emphasis mine),

``...whether the Fed is willing to admit this or not, it has become the servant to the hedge fund managers, the prop desk traders, the structured finance masters of the universe, etc. Under this set of circumstances, our best near term investment returns lie where these aforementioned allocators choose to position the Fed liquidity largesse at any point in time. And that's currently in the hard asset complex. Simple enough? Until these forces or dynamics change, we need to stay long energy, long equities benefiting from higher commodity prices, in short duration fixed income if at all, as well as long precious metals.

In short, it would be hard to call for on an interim “top” on the present momentum of the Phisix yet, if the US dollar index continues to fall on the back of increased “stimulative” conditions that has prompted for augmented inflationary expectations. Further as the financial sector liability expansion continues to feed on inflating assets and or asset markets worldwide, heightened speculative leveraging creates their own source of liquidity...

Nonetheless, the world financial markets appears to be too complacent, wearing rose colored glasses...and a word of caution from Dr. Marc Faber...``Right now, risk appetite is at an extreme and everybody is bullish about something. Investors are also extremely optimistic about the global economy. Hence the significant rise in commodity prices. However, given tighter international liquidity and weakness in U.S. housing, and the potential for equity markets to undergo a nasty correction in the next three to six months, the global economy could — for a change, after having surprised on the upside for the last three years — disappoint. If such a scenario were to play out, U.S. bonds could rebound, while industrial commodities and precious metals could sell off. Therefore, short bond positions should be covered, and traders might consider buying ten-year treasuries at yields above 4.80%.”

In short, be wary of a short term jolt. Keep your mental stops on.Posted by Picasa

Monday, May 01, 2006

Improving Your Portfolio Returns by Seeing the Unseen

``There is nothing like losing all you have in the world for teaching you what not to do. And when you know what not to do in order not to lose money, you begin to learn what to do in order to win. Did you get that? You begin to learn!”- Edward Lefèvre, Reminiscences of A Stock Operator

I have been requested by some to help improve on their portfolio returns, something which I have been attempting to do through this newsletter since 2002. Let me reword, the reason for this newsletter is to help you identify and act on investment themes or trends with an objective to attain returns greater than what is offered by the respective benchmarks in the marketplace. Unless you obtain the services of a portfolio manager, which I highly recommend for the purposes of specialization, the task to improve on your portfolio essentially falls on you, as the investor/prospective investor.

However, as stated in numerous occasions investing is fundamentally or most importantly psychological more than anything else, in contrary to what is commonly known or assumed. In the words of author Edward Lefèvre in his investment classic (said to have written on the account of the legendary trader, Jesse Livermore), Reminiscences of A Stock Operator (emphasis mine), ``But not even a world war can keep the stock market from being a bull market when conditions are bullish or bear market when conditions are bearish. And all a man needs to know to make money is to appraise conditions.” If you have noticed, appraising psychological conditions that constitute the cycles have been the focal point of this outlook since I began this lowly information crusade. All other concerns have remained subordinate. And this applies not only to the stock market but to all aspects of the financial markets as well.

Moreover, investment forecasting is NOT a practice thaumaturgy (performance of magic or miracles). In alot of instances I found it intensely difficult and even frustrating to preach about absolute returns, when expectations of me are usually predicated on short term moves. I found a passage from Mr. Lefèvre’s book applicable to my plight (emphasis mine)...

``I NEVER hesitate to tell a man that I am bullish or bearish. But I do not tell people to buy or sell any particular stock. In a bear market all stocks go down and in a bull market they all go up...I speak in a general sense. But the average man doesn’t wish to be told that it is a bull market or a bear market. What he desires is to be told specifically which particular stock to buy or sell. He wants to get something for nothing. He does not wish to work. He doesn’t even wish to think. It is too much bother to have to count the money that he picks up from the ground.”

Essentially this is what the public fails, if not refuses, to understand; that cycles caused by psychological shifts by the investing community underpin the marketplace. While there maybe sizeable accounts of randomness or “noise” on its daily activities, fundamentally, markets, like any aspect of our corporeal life operates under cycles.

And accordingly, as stated above, in most instances, similar to the narrative of Mr. Lefèvre, I find that the average investors indeed want something for nothing, such that in most cases, I am often expected to deliver short term winning formulas or a nostrum which essentially is a deliverance from one’s “gamblers’ ticks”.

And this is where the stock touts as seen in most conventional brokers and their coterie of analysts thrive, by mostly advancing PAST information and projecting them into the future. By deluging you with stock particulars, they induce you to trade frequently, which basically go against the goal of achieving above average returns, in the treasured words of the Oracle of Omaha, Mr. Warren Buffett, ``For investors as a whole, returns decrease as motion increases.” These stock touts often cannot distinguish the proverbial ‘forest from the trees’ simply because it is not their interest to do so. Their revenues models are not derived from bolstering your returns but from churning transactions.

Further, by pounding on you with past financial details aggravated by the “implied effects” of current events, they foster upon the public the fundamental foibles of the average investors; the mental short cuts or “heuristics”, namely the survivalship bias, overconfidence, anchoring, Loss Aversion/prospect theory, framing, mental accounting/rationalization, Regret theory and the comfort of the crowd/fallacy of the typicality (see August 18 to 22, 2003, Stock Market 101 on Cycles, Investor Psychology and Behavioral Finance). For instance, journalists from the mainstream media are wont to paint the picture (“framing”) abetted by the experts, during days when the markets traded lower as oil prices coincidentally goes up, of a causality based on oil price movements on the market. Sounds familiar no?


Figure 1 Dow Jones World Stock Index (black line) and the WTIC Crude benchmark (red line)

Say it isn’t so! The Picture is a fact as Ludwig Wittgenstein, Austrian-British philosopher once wrote; the three year chart of Crude Oil West Texas Intermediate (WTIC) and the Dow Jones Word Index certainly disproves such assertion so far. Yet, as mentioned above, you would hear commentaries flooding allover mainstream media from the so called experts to the lay persons of the highly touted “inverse correlation”. Such is an example of mental short cuts called as the fallacious “rationalization” of events to the markets. ``Either they're trying to con you or they're trying to con themselves.” observes Warren Buffett on financial analysts.

This is not to suggest that such correlation will be perpetual. A correlation is a correlation until it is not. For me, the reasons why oil and global stock markets have shadowed each other are due to the following:

One, oil has not yet crossed the ‘threshold of pain’ as to drain liquidity away from the financial system.

Second, speaking of liquidity, inordinate amounts of money and credit has been flooding the global financial system, causing the purchasing power of fiat currencies to fall against assets or, as seen on a mirror viewpoint, excess money have been simply chasing for yields, driving a diverse range of asset prices higher...including oil.


Figure 2: Gavekal Research: US and Japan Dumping Money in to the System

Figure 2 from Gavekal Research shows that the Japanese monetary base has been allowed to double in very short periods of time or in about three years, thrice since 1971. In fact, according to Gavekal Research, the Japanese Monetary base is currently even larger than the US! They are suggesting that the gradual reversal of the current monetary Quantitative Easing (QE) policy and the prospective lifting ZIRP (Zero Interest Policy) could lead to a possible meltdown in global bonds bolstering my case (see March 27 to 31 edition, Listen To Your Barber On Higher Rates and Commodity Prices!), as exported Japanese capital ($1.8 trillion!!!...or about 15% of US GDP or 3% of US assets) may find its way back home. But that is another story for our future outlook.

Lastly, the synchronized movements of oil prices and equity assets could be reflective of a global economy running on full throttles.

So essentially, it does not necessarily follow that high oil prices would lead to a lower market, as the causal association has rather been flimsy or outright tenuous, for the time being. In fact based on the historical data, as shown by Figure 1, it could be said of the reverse; particularly higher oil prices have led to higher markets values for equity assets or in a different plane, higher assets values for global equities have led to higher oil prices! Take your pick.

Going back to the main issue, it is also in the marketplace where such inferences (the act of deriving a logical conclusion from a premised believed to be true), assumptions (something accepted as true without proof) and cognitive illusions (illusion of knowing) are largely utilized by the average investors as basis for their decisions, the major attributes of investor losses. Unless one learns how to separate the “chaffs from the grains”, when the tide goes out one will learn who’s been swimming naked or who’s been surfing on plain ol’ Lady Luck.

You see, rising markets breeds many soi-disant geniuses. Rising markets will similarly lead to investor overconfidence. And since markets operate on cycles this means that many of the late comers and their attendant ‘genius’ experts will get burned arising from sheer imprudence or recklessness in the future as the cycle turns. Count that as a fact, it always does. Greed, Fear and Hope always dominates the market, as it has been, since time immemorial. As George Santayana wrote in The Life of Reason, ``Those who cannot remember the past are condemned to repeat it.”

I have dealt frequently with the unseen variables over the mostly macro facets and on some domestic economic and financial market issues. The information I have imparted to you have not been conventional, yet, they would appear to have validated my prognosis over time’s progression. I know it could have been outright serendipity or just plain luck. But at least, I am pleased to have been fortunate or blessed enough to have rightly called on the major turns or inflection points in the financial markets, be it the Phisix, the Peso, the Mining index/industry, the US dollar, Gold or commodities. Thank you, Lord.

Yet, all these could also have been a matter of visual processing, or the sequence of steps that information takes as it flows from visual sensors to cognitive processing (wikepedia.org), at the margins. The picture below (Figure 3) is a test of your visual processing, something which is commonly applied to investing.


Figure 3: Visual Processing Test, from Robert Ringer of Early to Rise

According to Mr. Ringer, If you are able to spot the object above then your visual processing is probably good. If you can’t get it, then try rotating the picture clockwise or look at it on a landscape format. If you are still having a hard time figuring it out, then probably it is an indication that you have probably some difficulty with your visual processing.

This isn’t an abstraction or illusion, it’s an actual picture. It’s actually a picture of a cow or of a cow’s face.

The point is, to quote Mr. Robert Ringer, ``we often look directly at things, yet still do not see them.”

Posted by Picasa