Sunday, June 25, 2006

Bernanke is No Bubble Buster, Little Visible Signals of Unwinding Yen Carry Trade

``Cycles in markets do exist, but it's impossible to pinpoint how long they will last with any precision. Much depends on the actions of government officials and the intelligence of the public. Each time is different. I recall commentators calling for a six-year gold cycle, or a 10-year real estate cycle. They are all ephemeral, because, as Shakespeare says, our actions are "not in the stars, but in ourselves."”-Mark Skousen Invest U


Figure 1: Economagic: Fed Fund and the US S & P 500 benchmark

Much like the inflation bogey, the Federal Reserve raised by a “measured pace” on its interbank lending rate by 16 times from 1% to 5% since June 2004. Yet rising interest rates have not deterred the benchmark S & P 500 from climbing to multi-year highs until May 10th, as shown in Figure 1. In short, market expectations on the Fed and its policies, aside from its actualization; have not essentially spoiled the fun...until recently. So what has changed?

There are those who pin the blame on the neophyte FED Chief Ben Bernanke for smudging the Fed’s ascendancy over his recent media fumbling (remember the L'affaire Bartiromo at CNBC). In an effort to redeem the Fed’s ‘tarnished’ credibility, officials have undertaken a concerted makeover to regain a semblance of ‘control’ over its “inflation fighting capabilities” hence the continued rhetorical “hawkish” stance.

There are also those who argue that the marginalization of leverage or arbitrage plays have been prompted by Japan’s declared intent to normalize its money policies. Having thought to have funded the prevailing ‘carry’ trades, which could be exemplified by borrowing in Yen and investing in assets with greater yield spreads relative to the Yen, such as emerging market assets and/or commodities, etc., these arbitrage trades is said to have fostered an inordinate degree of leveraged speculative positions at the global financial markets.

With Japan’s economic recovery gaining some important headway, the previous undertakings to combat deflation through accommodative monetary policies (QE, ZIRP, and currency manipulation) have been promulgated to be reversed thereby allegedly serving as the proverbial “pin” to have pricked the lathered assets bloated by the Yen funded liquidity arbitrage. (See May 22 to 26 edition Jim Jubak/Gavekal: Yen Carry Tumult)

I am less convinced of this argument since the market’s reaction appears to say otherwise.


Figure 2: ADB’s Asiabondsonline: JGB’s 2 and 10 Year yields climbing higher

Repatriation of residents and government funds stashed overseas should in effect be seen with a rising Japan’s Yen and/or expanding stockmarket bellwethers (Nikkei and Topix) and/or Japan Government Bonds as shown in Figure 2. Unfortunately, none of them appears to be responding positively to such stimulus, in fact all of them have been victims of the recent onslaught.

Maybe Morgan Stanley’s Stephen Jen could be right arguing that relative to cumulative financial markets, the Yen arbitrage while having some effects could not be the catalyst for the collective decline (emphasis mine), ``I am not arguing that the BoJ policy has no effect on global asset prices. Rather, I am refuting the view that there is something extra special about JPY carry trades. When interest rates rise in Japan, capital outflows from Japan would clearly be adversely affected, ceteris paribus, and some risky assets could be hurt. I do not challenge this point. But it is unreasonable, in my view, to think that BoJ tightening would trigger a collapse in global equities, most commodity prices, etc. Even massive money printing by the BoJ failed to support the Nikkei for years and so I don’t see how money from Japan could have such a big impact on the world. Monetary tightening by the BoJ will have no more and probably less of an effect on asset prices than if the Fed or the ECB tightens.” Hmmm.

There is also the case of heavily levered Hedge Funds absorbing significant or outsized losses which has led to a contagion (some of which are said to be 200-300 times levered more than invested capital, according to a Hedge Manager interviewed at Bloomberg), aside from suspicions about the state of “innovative products” in the form of derivatives, where 85% of the outstanding derivatives in the US have been interest rate based bets, and where 96% of US derivatives bets have been concentrated on ONLY 5 banks(!!!), according to the BIS in October 2005.

Forbes’ mainstay guru Gary Shilling argues that the credit induced mortgage boom in the housing sector is in the process of an implosion from its own weight (emphasis mine), ``The speculative housing craze is crashing from its own excesses, not Federal Reserve action.

In addition, another possible angle is that the recent rate hikes which appears as “coordinated” across the globe could be construed as IN RESPONSE TO (note: not the cause!) the initial bout of outflows, where interest rates have been driven up to curb the massive outflows, which has, over a very short term period, destabilized and wreaked havoc on domestic currency values relative to the US Dollar.

As the only proponent of liquidity based market movements among my domestic contemporaries, the present developments have not been unexpected, considering that as early as November of last year, we discussed the incipient signs of risks arising from liquidity compression (see November 21 to 25, 2005 edition, Declining Global Liquidity: Believe It...or Not?).

I have argued that inflation, in the monetary definition, has long been imbedded into the global monetary system (see November 14 to 18, 2005, Inflation Cycle A Pivotal Element to Global Capital Flows), and responsible for the majority of the movements of the Philippine financial markets. Such that rising gold prices relative to most if not all currencies in the past have likewise reflected on this phenomenon (see March 27 to 31, Listen To Your Barber On Higher Rates and Commodity Prices!), and that the present concerns of higher inflation (as reflected in consumer prices) and attendant interest rates increases are natural consequences to the past policies adopted by government authorities worldwide. As in the past, central command, conventionally thought to be as messiahs to the world’s multi-dimensional problems, always miscalculates, if not abuses. Yet we never learn.

Now the draining of US dollar based liquidity has its belated effects percolating into the US economy today, compounded by the persistent high levels of energy prices, which appears to rein on the trailblazing surge in economic growth brought about by rampaging asset prices particularly in the real estate industry.

Consumer spending has basically driven the economy which has been essentially funded by surging home prices. Yet, underpinning both consumer spending and soaring property prices have been massive growth in credit. ``The problem is that after allowing a late 1990s stock market bubble and a 2003-2006 housing bubble, the Fed has basically lost control. It feels the necessity to fight inflation until further signs of economic softening show up, and by that time it is too late to avoid a likely recession” comments the comstockfunds.com.

In my June 5 to 9 edition, (see US Recession Watch: A Fed CUT in June or August?), I have laid my contrarian analysis anew where I contended that the activities global financial markets could be portentous of this deceleration or softening. Since the US has been the key growth engine on the consumption side with China as the major production platform for the world, an economic slowdown would translate to respective growth reductions on its trade partners mostly dependent on the US markets for revenues. And such is the reason why, I think, commodities, with the exclusion of gold) and emerging markets have adjusted downwards. So the lagged effect of diminished liquidity aggravated by high energy prices has, in tandem reduced growth prospects in the US, which again may spillover to the world and manifested in financial markets.

On the other hand, noted economist Henry Kaufman interviewed by Kathleen Hays says that (emphasis mine) ``These are not extraordinarily repressive interest rates. Today, anyone who really wants to borrow can borrow. Today, anyone who wants to borrow creates Credit. And the Federal Reserve is not yet at that point where there is some pain in the system.” Mr. Kaufman believes that rates would have to go further than 6% in the coming 12 months with possible 50 points increases in the near future due to the Fed’s prevailing policies, Mr Kaufman adds, ``The Federal Reserve is going to have to decide when to abandon this measured response of 25 basis points. That’s a very difficult chore for them, considering how long they have pursued this policy here in the past. Secondly, I think as financial market participants we will continue to create a lot of Credit until there is much more uncertainty in the interest-rate structure. I think there is going to be significant volatility in the financial markets over time. ”

Mr Kaufman believes that the US economy can still endure more of rate increases before any pain can be evinced. The markets are signaling inchoate dislocations, which could be interpreted as doing so otherwise. Except for the 10 year treasury bonds yields, the equity benchmarks have not broken down YET and may even surprise to the upside to uphold Mr Kaufman’s view.

However, given the developments in the bond markets, yield inversions plus rising yields on the intermediate end have not behaved favorable to equity benchmarks in the past. This downcast outlook is likely to foreshadow the economy’s diminishing tolerance level for tightening.

Moreover, given that it is political season again in the US, question is, can the incumbent party afford to inflict pain on its citizenry, which could represent a sure recipe for electoral defeat?

Furthermore, given the ideological leanings of the Fed Chief (Friedman “monetarist” adherent) would he risk overshooting and face his dreaded nightmare of DEFLATION? Bubble bustin’ ain’t Bernanke’s game, I think.

The inflationary backdrop may go into a reprieve in the interim as the softening of economic growth takes hold. But unless Bernanke does a Paul Volker, i.e. boldly raise rates until its chokes economy and inflation despite the uproar (unpopular), I think the seeds of a long term inflationary environment have been deeply rooted and would accelerate over the fullness of time. Posted by Picasa

Thursday, June 22, 2006

Gold’s back....Phil Mining Index leads the Phisix?

The recent emergence of a global “risk aversion” led to convulsive liquidations in a majority of asset classes with commodities and emerging bourses suffering the most after delivering the best returns over the past 3 years.

However, following the dramatic selling scare over the past month, it appears that gold prices, a leading representative of the commodities class, appears to have settled down or may have manifested signs of a bottom.


As you can see above (courtesy of stockcharts.com), Gold bounced off its 200-day moving averages following its recent low at $542, while technical indicators MACD seems to be in the process of segueing into the bullish "golden cross" and Relative Strength Index appears to indicate a forward momentum.

The Phisix including its Mining Index component like its peers abroad endured the recent spate of shellacking. However, activities in the gold market appear to have driven the mining index higher despite the lackluster foreign driven selling performance of the Phisix (blue line chart below).


As you can see from the chart above, the Philippine Mining Index lagged the gold market for 2 days only (vertical red arrow) while recent recovery (red trend line arrow) shadows that of the rallying gold.

And with technical factors pointing towards a recovery in the gold market, the mining index is likely to lead the domestic market once again. Fundamental-wise, a rallying gold could foreshadow the Fed taking a breather SOON. Time to ante up.Posted by Picasa


Sunday, June 18, 2006

Whiff of Stagflation? Gone in May...Risks Still Large

``When I was young, people called me a gambler. As the scale of my operations increased I became known as a speculator. Now I am called a banker. But I have been doing the same thing all the time.”- Sir Ernest Cassel (1852-1891), British Merchant Banker and Capitalist


What’s probably lingering in most of the investor’s mind today is whether the recent sell-off has been ‘overdone’ and if the selling pressures have ‘turned’ (meaning if the ‘correction’ is over), given the downpour of liquidations over a very short time frame.

Candidly speaking, I do not hold a crystal ball to know the exact or definite answer but can, at best, discern on the probabilistic outcomes based on the adverted factoids, e.g. ‘rising’ inflation and interest rates, and other multifarious variables which may have influenced the present activities, such as the Japanese Yen carry and arbitrage trade, protracted period of investor complacency or “low volatility”, decelerating US-led global economic growth, contraction of global liquidity, hedge fund or derivatives based losses, the Bernanke and US Fed “credibility” factor, etc..

Highly Correlated Markets

From what has been taken into account, today’s increasingly “globalized” and technology enabled financial market integration have set forth a “domino” effect as highlighted by the selling contagion across asset classes, from bonds, commodities, currencies to equities worldwide. In other words, since the advent of the new millennium, diverse asset classes have developed a rather “close interdependence” or have seen “increased correlation” among its activities in the financial markets. So unless we learn to accept the truisms of a ‘macro’ dictated framework for financial markets analysis we are likely to miss proverbial “the trees for the forest”.

For instance, analyst Gary Halbert of profutures.com (emphasis mine) expounds on such associations, ``Even commodity prices are starting to mimic the equity markets. Imagine commodities like oil and precious metals increasingly moving in tandem with stocks. For purposes of example, I will cite the Goldman Sachs Commodity Index (GSCI) which tracks the prices of 24 traditional commodities markets (energy, metals, grains, food, lumber, etc.). As recent as 2000, the GSCI had a negative correlation of 14% with the S&P 500 Index, meaning that commodities tended to move up when stocks moved down and vice versa. According to the Merrill Lynch study released in March, commodities have recently shown a positive correlation of 33% with the stock markets.”

A correlation is a correlation until it isn’t. What was once negatively correlated and had been used as portfolio diversification for the functional intent to “spread risks” has now evolved against fulfilling its purpose. This goes to illustrate that the attendant integration of financial markets abetted by a profusion of worldwide liquidity has led to investors (especially the highly sophisticated Hedge Funds) into tapping different asset classes using diverse methodologies, such as relative value arbitrage strategies, event-driven strategies, directional or tactical strategies, for the hunt of above average profits.

Mr Halbert adds (emphasis mine), ``Six years ago, emerging market stocks (as measured by the MSCI EAFE Index) had only a 32% correlation with the S&P 500 Index. According to the recent Merrill Lynch study, that correlation had vaulted to 96%! Emerging stocks are now trending in line with the US S&P 500 Index.This basically explains the underlying rationale behind the cross asset feebleness of late.

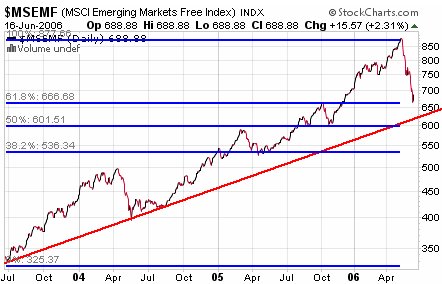
Naturally, an empirical dissection of recent events depends on the frame of reference taken by the observer. For instance, the concurrent carnage seen in the emerging asset class as reflected by the Morgan Stanley Emerging Free Markets Index, which serves as bellwether to the equity performances of developing economies’ markets, shows that on a year-to-date basis the previous highfliers, as of Friday’s close down by 2.5% from a gain of over 24% in May 10th, which feels like a bear market due to the relentless selling.


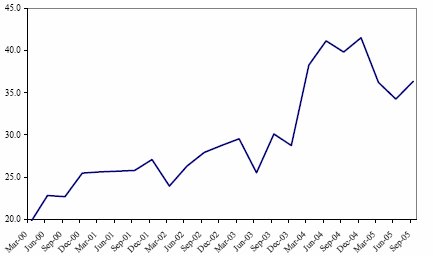
Figure 1: MSCI Index Uptrend Still Intact

However, taken into the context of its three year performance as shown in Figure 1, the emerging market benchmark, after gaining by over 160% in three years, has retraced by about 38% from its peak. Moreover, despite the present selloffs the above chart shows that its 3 year trend remains unviolated, which means that the bulls remain the dominant force relative to a longer time frame despite the present selloffs.

So if you ask me, what future lies ahead for the emerging market bourses, as well as for the Phisix, my reply would be ‘until proven otherwise, the longer term bullish momentum still presents as buying opportunities...albeit until signs of stability or a bottoming out from the frenetic selloff emerges’.

Let me quote Mr. Ivan D. Martchev of Global View Points with a similar view (emphasis mine), ``I do believe that emerging markets over the long term have a very bright future. But anyone involved in emerging markets will tell you that the best buying opportunities are when there’s blood on the streets. And in the emerging market universe, there tends to be more bloodshed than in developed markets; that’s simply how it’s always worked, and how it will always work, until they finally emerge. Simply put, it can get worse.”

US: Final Phase of Business Cycle

``A lower dollar will not resolve the structural challenge the US is facing. A lower dollar will not re-create the US manufacturing industry. A lower dollar will not turn America into a nation of savers. We believe the pressures on the dollar will persist as long as there are not fundamental changes that will truly promote savings and investments. And to make it perfectly clear, we do not have an “ownership society” as long as the banks are the ones owning our homes.” Axel Merk, Merk Hard Currency Fund

The prospects of possibly going worse before getting better could still be deemed to be large. And as indicated in my previous outlook, the largest contributing factor to the present anxiety, for me, is the tempestuous developments in the US financial markets perforating into the global economy, notwithstanding the imbalances caused by the US dollar standard system.

Like your analyst, Austrian economist Hans Sennholz believes that the concomitant by global central banks are an attempt to resolve a bigger issue, ``Fears of growing imbalance and potential crisis finally prompted central banks to raise their rates, at first the Fed, then ECB, and now also the Bank of Japan.”

Furthermore Mr. Sennholz thinks that the present business cycle in the US is nonetheless headed for stagnation and or recession let me quote Mr. Sennholz at length (emphasis mine),

``Most Americans probably never heard a frank and impartial explanation of the business cycle. They do not realize that economic stagnation and recession are the final phase of a business cycle, the readjustment phase. A cycle begins when the Federal Reserve System, in order to stimulate the economy or assist government deficit financing, lowers its discount rate below the actual market rate at which the supply of and demand for savings are evenly matched. Or it may decrease interest rates through open-market operations of buying government securities. Capital at bargain rates excites many businessmen and encourages them in their investment decisions. They may expand and launch many new projects which make business thrive and boom. But as soon as goods prices and wage rates begin to rise, businessmen need additional funds. As long as the Fed provides them, the boom can continue and even accelerate. It comes to an end when the Fed ceases to throw new funds on the loan market or the quantity launched no longer suffices to feed the boom. At that time, the readjustment, that is, the recession begins.”

``The present cycle undoubtedly began after the bursting of the stock market bubble in 2000 and the terror attacks on the United States in 2001 when central banks everywhere braced for deflation and recession. In fear and trepidation they lowered their interest rates, the Bank of Japan to zero, the Federal Reserve to one percent, and the European Central Bank (ECB) to two percent, the lowest levels since World War II. In most countries the policy seemed to work as housing construction, which always is interest-rate sensitive, came to life again. Even the doubling of oil prices and other energy costs could not dampen the excitement. Goods prices rose moderately due to low-cost imports and some relocation of production, but business profits improved visibly.

``Artificially low interest rates not only stimulate economic production but also excite capital markets. As corporate profits rise, stock prices tend to soar. Real estate prices increase as buyers can shoulder greater mortgage debt. Even the loan market may flourish as foreign banks, for various reasons, acquire large quantities of American I.O.U.s. Massive trade deficits always add their quandary and risk. Last year, the U.S. balance-of-payments deficit amounted to $805 billion or 6.4 percent of gross national product. This year, it is expected to be even larger.

Whiff of Stagflation? Gone in May...Risks Still Large

I have noted in last week’s outlook of the present dislocations in the financial markets could be symptomatic of this unraveling disorder. Where Hoisington Investment Management Company in their first quarter outlook observed that 11 leading economic indicators (LEI) have been pointing down with the exception of stock prices and industrial commodity prices as measured by the Journal of Commerce, these apparently, with the recent turn of events, have turned down too, increasing the likelihood of Mr. Sennholz view that the business cycle has gradated into its final phase.

While, of course, one may note of the extreme oversold conditions resulting to the huge end of the week snapback rally in major US equity benchmarks, underlying economic trends appears to have signaled a downturn.


Figure 2 courtesy of Northern Trust on M2 Money Supply % change compared to Real GDP

As shown in Figure 2, Real Money stock M2 supply has led real GDP since the 60’s where meaningful declines in the real money stock resulted to a similar retrenchment in economic growth. Northern Trust Chief Economist Paul Kasriel comments (emphasis mine), ``I know that real M2 growth is now considered passé as an indicator of monetary policy or as a leading indicator. The Fed never mentions it, not even St. Louis Fed President Poole, a former member of the monetarist Shadow Open Market Committee. But for some odd reason the Conference Board chooses to keep PCE-price-adjusted M2 money supply in its index of Leading Economic Indicators. I suppose the odd reason is because the correlation between the Conference Board’s real M2 growth and real GDP growth is a not-too-shabby 0.60% (see Chart 2). So, we’ve got real M2 growth and the flat yield curve both suggesting that monetary policy is restrictive and the Fed on June 29 will raise the funds rate again. I can hardly wait to see how fast and by how much the consensus lowers its second-half real GDP growth forecasts after the advance Q2 real GDP data are released.”

The largely moderate view of BCA Research turned glum stating that headwinds have now intensified for US consumption spending in the next few quarters on a squeeze from higher rates, high energy prices and most importantly a downturn in housing prices, notes BCA...


Figure 3 BCA Research: Consumer Spending at Peak

``Retail sales growth peaked in January and the deceleration should continue as consumer incomes are being badly squeezed by increases in “unavoidable costs”. The share of income that is dedicated to essential spending - food, energy, medical care, and financial obligations (interest payments) - is at a record high. Importantly, a key tailwind, namely housing wealth gains, is fading fast. The Fed wants to be viewed as tough on inflation, but an interest rate hike at month-end is likely to be the last for an extended period, because a sustained downshift in overall spending growth is underway. Bottom line: a period of below-trend economic growth looms.”


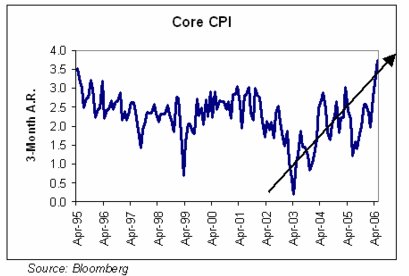
Figure 4: Core CPI courtesy of Barry Ritholz RR &A

With equities priced for an overdrive, recent actions in the market appear to appropriately re-rate on the toned down or much chastened outlook on the world’s main economic engine.

Notwithstanding, the recent surge in US inflation outlook led by the jump in Owner’s Equivalent Rent as shown in Figure 4, likewise discussed in our May 15 to 19 edition (see US led Global Market Correction) have effectively turned the corner for the inflation data. A growing whiff of stagflation???

In addition, recent moves by China to curtail its economic overheating by raising bank reserve requirements after an unexpectedly strong economic data.

Finally, one of Wall Street’s favorite axiom, “Sell in May and Walk away” seems to have lived off its daunted reputation.


Figure 5: Chart of the Day Sell in May

Most of the gains in the US have been from November to April, which means that present activities could also represent seasonal weakness aside from the previously stated fundamental reasons.

All in all, if US based jitters continue to lead the directions in the global financial markets over the interim, specifically, a tightening money environment, lower growth prospects, broadening inflation data and subsiding earnings prospects aside from continued trends by global economies to seal excess liquidity leakages from its past accommodations and emerging risks of financial mishaps from hedge funds or derivatives, the risks potentials remain higher than prospective returns suggesting that any intermittent rallies from oversold conditions should not be mistaken for anything else except as a technical bounce.

Trade the Phisix on Opportunities; Maintain Lean Exposure

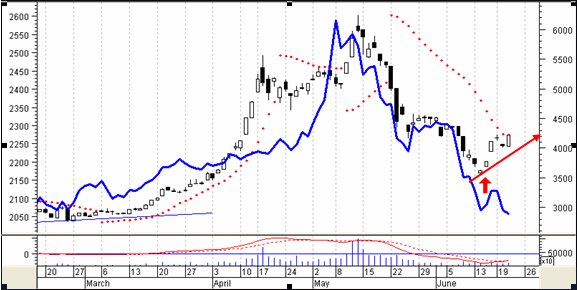
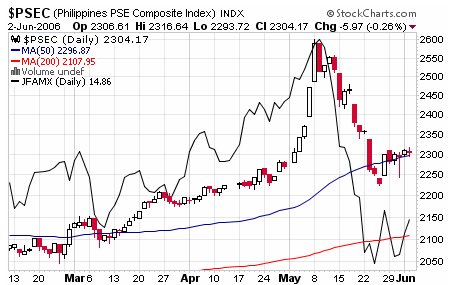
Over at the domestic market, the Phisix continues to be plagued by bleak sentiment brought about by the worldwide selloff. In fact, based on the technical picture as shown in Figure 6, the havoc wreaked by the series of foreign money selldown has effectively damaged its three year trend line signaling a possible trend reversal. Ugh.

The rallies during the last two trading days of the week, which echoed the rally in Wall Street had been patently feeble, as manifested by strong opening and weak closing while rising on lean volumes, which in technical jargon is known as a “ Dead Cat’s Bounce”. As previously described, despite local optimism, the lack of firepower by local investors has been dampened by foreign selling.


Figure 6: Phisix 3-year trend line broken!

While the prospects of a downward action for the Phisix, which may reflect activities in the global markets, could continue, I am predisposed to think that the present stockmarket cycle will either lead the Phisix to test the 1,887 or equivalent to a 50% retracement at worst or consolidate from the present levels, given that it has shed a hefty 38% from its peak, given the present circumstances.

The odds for the Phisix to return to the 1,000 level remain remote, unless the world possibly enters into a depression or another explosive political turbulence fazes the market in the absence of foreign buying. Yet, if such a scenario, a low probability high impact one does comes to pass, then the Phisix would still be drifting on a bottoming phase (reckoning from its 2002 bottom) at worst, instead of an advancing phase from present dynamics. However, the prospect of a declining phase or a break of 1,000, I think, has an infinitesimal chance.

This implies that present exposures to the market should be adjusted mainly towards trading opportunities, meaning “buy on dips and sell on resistance”, as to benefit from countertrend rallies emanating from marked selloffs.

Of course, unless some signs of stabilization manifests in the global markets, if not stark divergences among the performances of distinct asset classes or among regional equity bourses, then it would be best or prudent to remain lightly invested or underweight equities.

Awaiting Asia’s Markets to Diverge from the US

``The next half century will see a massive exchange of goods for assets that will not only shift the center of the world economy eastward but also negate the destructive impact of the age wave on asset prices and retirement opportunities.” Jeremy Siegel, The Future for Investors


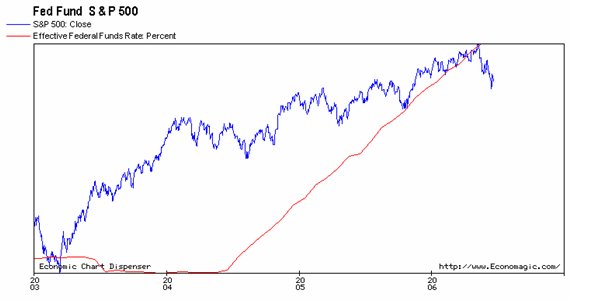
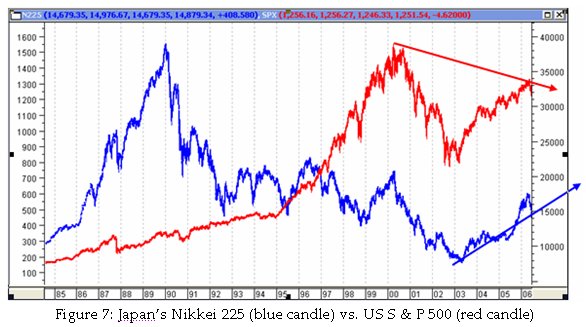
Because your analyst is a staunch adherent of cycles, over the long term my view is that Asia’s stock market cycles may reflect more of a resurgent Japan’s Nikkei than of the declining US Standard & Poor’s 500, as shown in Figure 7 on the basis growing intraregional trade, and deepening economic ties, as well as, the region’s attempt to further integrate its financial markets.


Figure 8: IMF growing share of Asia’s economy to the world

As shown in Figure 8, Asia’s rapid economic growth clip, according to the IMF, based on weighted purchasing power parity, has made the region’s GDP share contribution relative to the world greater than that of the US and the EU. Aside from the regionalization trends, Asia has been mostly underpinned by growing trade surpluses, rising foreign exchange reserves, dynamic demographic trends, liberalization of economies and swelling middle classes, such that it won’t be long when the present trends of correlation diverges.

All these do not, of course, discount the litany of risks involved.

For instance, China’s banking system is said to be in a precarious state due to its outsized debts almost equal to its foreign exchange reserve surplus. Moreover, growth of China’s excess foreign reserves have been more than the combined trade surplus and the accounted foreign direct investments inflows suggesting that speculative capital in anticipation of the Remimbi’s appreciation have padded into the system, principally into its real estate industry, such that any reversal of expectations could allegedly lead to a stampede out of remimbi and back into the “shorted” US dollar.

In addition, Asia’s mercantilist economic policies are likely to be affected by a slowdown in their major export market; the US. Notwithstanding, the declining demographical trend or the shrinking population of Japan, aside from its huge fiscal liabilities, the largest among the developed nations.

You also have the brewing political animosity between China and Japan, over the latter’s war atrocities, aside from the sovereignty squabble for oil and gas drilling at the Diaoyu islands – or Senkaku in Japanese. We must not forget the unusually quiescent North Korea of late.

Relative to risk and potential returns, coming from a low, Asia appears to have more upside potential than the US which is coming from lofty grounds.

Sunday, June 11, 2006

US Recession Watch: A Fed CUT in June or August?

``The job of the Federal Reserve is to take away the punchbowl just when the party is getting good." Former Fed Chairman William McChesney Martin

Instead of inflation as the culprit of the recent turmoil, key financial bellwethers appear to indicate of the contrary. As shown in Figure 1, the US Dollar index appears to have benefited from the recent shocks.


Figure 1: US Dollar Index Double bottom

A strong dollar denotes of a restrictive money environment. With global central banks in a consonant motion to lop off excess liquidity, these developments are hardly conducive for equity investments.

In addition, US 10-year yields have broken down (see Figure 2)!


Figure 2 US 10 Year benchmark Yields Breaking down?

Three things to bear in mind. One is that the present attempt by the benchmark US Treasury yields to breakdown from its support level could not be indicative of heightened INFLATIONARY expectations in distinction to what media or mainstream analysts have been speculating about.

Fixed income treasuries rally on the account of expected economic weakness. With global bonds (including emerging markets) appearing to show signals of bottoming out, the bond markets seems to suggests a coherent view of a global economic growth deceleration.

Second is that the present yield curve has gone flat with negative biases to fore. At less than 5%, relative to the FED interbank rate, the yield spread between the 10 year benchmark and the FED rate has gone marginally negative. If the FED continues to raise its short term rate on June 29th to 5.25%, this effectively inverts the yield curve for as long as the longer end stays at present levels. The inverted yield curve indicator has correctly called on the majority of the recessionary economic downturns in the US during the 20th century.

Mr. Van Hoisington and Lacy Hunt of the Hoisington Investment Management Company see similar risks in their recent outlook (emphasis mine)...

``In assessing the movement of these important financial economic and monetary leading indicators, it is our conclusion that a significant slowdown will embrace the United States before 2006 is completed. Furthermore, if the year over year growth rate of real M2 turns negative and the yield curve inverts for more than three months, the probability of recession will rise to over 50% on a statistical basis. Judgmentally we are already over 50%.”

This leads me to the third premise. That the bond markets dictate where the FED RATE direction goes and NOT the FED leading the bond markets. This is an important misconception deeply ingrained in the mindset of the average investors; that government policies dictate markets.


Figure 3 Courtesy of Elliott Wave’s European Market Watch

As shown in Figure 3 courtesy of Elliott Wave’s European Market Watch, the US treasury 3 month yields have in the past determined the policy actions of the Federal Reserves. Markets have essentially dictated on policy actions rather than what is commonly believed.

According to Mr. Vadim Pokhlebkim, Elliott Wave European market Watch (emphasis mine), ``Bond yields change daily, and central banks have no control over them: Yields (and prices) are set by the market. After years of observing the timing of monetary policy decisions, we’ve noticed one surprising fact: Central banks are almost never proactive when it comes to changing interest rates. Usually, they only react to what the bond market dictates. In other words, central banks’ decisions generally lag the bond market.”

Moreover, recent declines in the major US equity markets benchmarks may validate such bleak forecasts.


Figure 4 From Elliott Wave International, Dow Jones Industrial Average and the quarter-by-quarter performance of the US economy.

The stock market leads the economy, according to Robert Prechter of Elliott Wave international, ``Much of the time, the trends are allied, but if physics reigned in this realm, they would always be allied. They aren’t. The fourth quarter of 1987 saw the strongest GDP quarter in a 15 year span (from 1984 through 1999). That was also the biggest down quarter in stock prices for the entire period. Action in the economy does not produce reaction in stocks. The four-year period from March 1976 to March 1980 had not a single down quarter of GDP and included the biggest single positive quarter for 20 years in either side. Yet the DJIA lost 25% of its value during that period. Had you known the economic figures in advance and believed the financial laws are the same as physical laws, you would have bought stocks in both cases. You would have lost a lot of money.”

Last week, I mentioned that the incumbent Fed Chief Ben Bernanke and former Fed Chief Alan Greenspan acknowledged of the possibility of an ‘orderly’ housing industry induced economic growth ‘moderation’ in the US.

Since the US Federal Reserves future policy action is said to be “data dependent” which means its future course of action depends on its forecasts and on the effects on the incoming economic data on such forecasts, putting aside the assumption that the market dictates on the Fed policies, the $64 question is what if the Fed’s forecasts proves to be wrong as in the previous instances.

According to David Rosenberg, North American economist of Merrill Lynch (emphasis mine), ``the Fed overshot in the other direction in 2003 after overshooting to the upside in rates in 2000, and this is what business cycles are made of - policy mistakes."

``Bear in mind there was no evidence of a Nasdaq crash in spring of 2000 either. But given that Greenspan has been wrong at every critical juncture (emphasis mine) in his entire career, we know housing will collapse sooner or later...Actually, his position is peculiar, to say the least. He claimed there was a bubble in stocks in 1994; he embraced the productivity miracle in 1999-2000, looking for upside in the economy as shown by Fed minutes; then, after the bubble burst, claimed that bubbles could only be detected after they pop. Now he is claiming "very orderly and moderate cooling…where prices will not go down." This is, of course, reminiscent of esteemed economist Irving Fisher's statement in October 1929: "Stock prices have reached what looks like a permanently high plateau." wrote Mish Shedlock of whiskeyandgunpowder.com


Figure 5: Economagic.com: Dow Jones and the Fed Funds Rate

According to Bloomberg’s Prashant Rao and Deborah Finestone, ``Traders this week raised bets Fed policy makers will lift lending rates to 5.25 percent on June 29, as central bank officials suggested the Fed will remain vigilant to keep inflation from accelerating. Interest-rate futures are pricing in an 84 percent chance of a quarter-point increase in the Fed's key rate this month, up from 48 percent a week ago.”

In short, while today’s market could be pricing in another rate hike, market consensus has been essentially tussling over a quarter point rate increase and a pause. This leads us to the next UNSEEN variable. Figure 5, courtesy of economagic.com, shows of the Dow Jones Industrial Averages and the Fed Funds rate since 1990. Notice that at the onset of the past two recessions (1990 and 2001) marked by the red lines, had been accompanied by severe price declines in the Dow Jones benchmark. Subsequently, in both cases, the FED Rates COLLAPSES as liquidity was injected back into the system!

This suggests that IF the FED ends up chasing its own tail, as had been in the past, continued massive declines in the key equities benchmarks could be a harbinger of an ongoing recession instead of an impending one!! Notwithstanding concomitant to notable declines in benchmark US Treasury yields. And instead of a HIKE or a PAUSE, the likelihood is for a cut at the next June FOMC meeting or in August 8th. Again this is strictly conditional on the performances of both the equities and bond markets.

As of Friday’s close at 10,891.92, the Dow Jones Industrial Average is a meager 6.6% away from its May 10th high of 11,670.19, hardly a sign of a reversal YET. All these could be an instance of Aesop’s “Boy Who Cried Wolf” though. However, until the world financial market resolves its present impasses the probabilities of risks remains greater than potential returns.

As for the Philippine equity market, which had been highly dependent on foreign money, the ongoing global rush to exit levered positions on a declining economic growth backdrop is hardly an auspicious landscape for investing. Sans foreign money and sufficient local volume to meet the onslaught of foreign outflows, our Phisix becomes vulnerable to the vagaries of political sentiment. I would suggest for you to avoid catching the proverbial “falling knife.” Stay clear until the dust settles.

Thursday, June 08, 2006

Global Markets: Free Fallin'

From Tom Petty's Free Fallin'...

And Im free, free fallin
Yeah Im free, free fallin
Free fallin, now Im free fallin, now im

From Bloomberg: "Stocks in Europe, Asia and emerging markets tumbled on concern higher interest rates worldwide will stifle spending and earnings growth.

Europe's Dow Jones Stoxx 600 Index slid 2.4 percent to 306.65 at 9:41 a.m. in London, with mining and oil stocks leading a drop in all of the measure's 18 industry groups. Shares of BHP Billiton, the world's biggest mining company, and BP Plc, Europe's biggest oil company, both retreated.

Asian shares were headed for the biggest loss in two years. The Morgan Stanley Capital International Asia Pacific Index dropped 3.3 percent to 119.59, the most since May 10, 2004.

U.S. stock-index futures also slumped, and an MSCI measure for global emerging markets fell for a fourth day, wiping out this year's gains."

Monday, June 05, 2006

Stockcharts.com’s John Murphy: US DOLLAR AT CRUCIAL JUNCTURE

I noted that most key global financial market benchmarks have been trading in critical threshold levels. This means that at this juncture the markets will have to determine whether the recent shakeout serves as a signal of an “inflection point” or simply a typical “correction”.

In converse, in the case of the US Dollar index, the recent bounce off its steep decline could be extrapolated as either a “pause” in its dominant downdraft trend or a possibly signal a reversal/ “rally”. The interest rate expectation factors are likely to hold sway on the directional flows of this major indicator during the forthcoming trading sessions. As Stockcharts.com’s John Murphy notes, where the direction of the US dollar is headed for, the likely inverse path for the prices of commodities. I’d like to share Stockcharts.com’s John Murphy invaluable technical insights about the US Dollar Index...

Stockcharts.com’s John Murphy: US DOLLAR AT CRUCIAL JUNCTURE (emphasis mine)

The chart below compares the Dollar Index (green line) to the CRB Index (purple line) since last September. The main message to be drawn from the chart is that the two markets have been trending in opposite directions which is their natural tendency. Dollar peaks last November and again in March coincided with CRB upturns. A dollar bounce during the first quarter coincided with a CRB selloff. The recent minor bounce in the dollar may have contributed to the recent slide in commodities. That's why commodity traders need to watch the dollar especially closely at this point. That's because the dollar is at a crucial chart juncture.


Back in March I wrote a column about a possible "head and shoulders" bottom being formed by the Dollar Index. The next chart is an updated look at that possible chart pattern. The horizontal line drawn over the 2005 peaks near 92 is a possible "neckline". The middle trough formed at the start of 2005 is a possible "head", while the early 2004 trough is a possible "left shoulder". If the current selloff is a "right shoulder", it shouldn't fall below the left shoulder. The two green circles show that level to be just above 84. The Dollar Index is testing that support level at the moment. To turn the chart pattern bullish, the USD would have to rally from this level and exceed its neckline at 92. It's a long way from doing that. If it doesn't hold near 84, it could drop all the way back to its early 2005 low near 80. Technical indicators are mixed. The 9-week RSI is in oversold territory under 30. But the weekly MACD lines are still negative. Since I'm a believer in the maxim that it's easier to continue a trend than to reverse one, I think odds favor a dollar move to the downside. That would be even more likely if today's weak jobs data encouraged to Fed to take a pause in June. That would be bullish for gold and other commodity markets. That's why a lot rides on the trend of the dollar. That's also why the final chart is so worrisome. Going back to the mid-1980's, it shows the dollar in a long-term secular decline. It also shows how important the support line is along the 80 level. It held at the start of 2005 and prevented a major breakdown. If the current level of 84 doesn't hold, that long-term support line at 80 will be threatened again.


Sunday, June 04, 2006

IMF Finance: Country Focus: ASEAN-4

The near-term growth outlook for the ASEAN-4 (Indonesia, Malaysia, Philippines, and Thailand) is favorable, thanks to strong export growth. But sustaining medium-term growth requires reviving domestic demand, especially investment.


Sources: IMF, World Economic Outlook database; CEIC Data Company LTD; and IMF staff calculations. Posted by Picasa

Heightened Volatilities Prevail

``There's no way all this debt can ever be paid off or even carried by stable economic systems. Forget that. This debt must be carried, handled, by ever increasing amounts of paper. That alone is a basis for perma-inflation. Maybe we've got a new word here -- "permaflation." Richard Russell of the Dow Theory Letters

ACTIVITIES in the global financial markets, as well as in the domestic markets, have shown some semblance of abatement from the recent intense selling pressures although indications are, in my point of view, that the probabilities of risks are still far greater than potential returns hence maintain my hands-off stance at the moment until signs of a clearer trend emerges.

Most of the present activities had been blamed towards the inflation ‘bugbear’ when as previously discussed, inflationary pressures have long been embedded into the world’s financial and economic landscape, whose transmission mechanism have been mostly been manifested through the rising variegated asset classes, which has eventually transfused into prices of essential goods and services.

Various keynote institutional analysts have labeled the present gyrations in the in the financial markets mostly as phraseological “risk premia repricing” or “rising risk aversion” or “normalization of risk factors”. In short, euphemisms for a fundamental change in market sentiment. Where global financial markets appeared to have factored in or assumed lesser degree of risks or adopted a high degree of complacency in the projecting the immediate past for pricing present trends, the precipitate alteration of directional paths underscores this shift of psychological outlook.

For instance, the US S & P 500 VIX index ($VIX), shown in Figure 1, or a market volatility indicator calculated by measuring option activities and is used as a gauge for investor sentiment has moseyed along for a great deal of time at near record low levels which means that investors in the US equity markets, particularly the S & P 500, have been rather “self-indulgent”.


Figure 1 S & P VIX Index Breakout

The recent breakout of the sentiment indicator is a reason to be cautious, according Ivan D. Martchev of Global View Points (emphasis mine),

``But while short-term market timing models all call for a dead-cat bounce, longer-term indicators suggest there’s much more potential for the selling to continue. The rapid selling in the Nasdaq 100, even after badly underperforming in 2006, is an indication that institutional investors have decided to get serious about playing defense. That's not going to change in a matter of days or even weeks.

``The S&P 500 Volatility Index (VIX) rose well above its October 2005 spike. This is the first time “the fear gauge” has risen above any major spike in its precipitous decline during the past three years. The index is clearly bottoming, carving higher lows after having declined as low as 9.88 in July 2005. This is very different behavior than what we’re used to. And given how depressed the VIX is, it can rise a long way from here.

Oooh...what a ghastly perspective in terms of technical outlook. Yet, this is what I have been saying long ago, to lift anew a great quote from the late economics professor Hyman Minsky, “Stability is unstable” or that the appearance of stability could be a breeding ground for complacency ergo future instability.

US Epicenter of Global Market Volatilities

Morgan Stanley’s Chief economist, Stephen Roach suggests that the hubbub in today’s financial markets has been an oddity, not been event driven, and could have been due to self-implosion due to excess speculation, quoting Mr. Roach from his Risk Bubble article (emphasis mine)

``It is on a par with the big reversals of the past. What is particularly interesting is that this outbreak of risk aversion has occurred in the absence of a financial crisis and in the absence of a major shift in the underlying fundamentals of the global economy...Absent the "pin" — normally thought to be an interest rate spike — investors have no fear of bubbles. Yet, this imagery is actually quite misleading. Yale Professor Robert Shiller has long stressed the tendency of asset bubbles to implode under their own weight (see Irrational Exuberance, second edition, 2005). In other words, it doesn’t always take that unpredictable "bolt from the blue" to send overvalued assets crashing back down to earth. To stretch the image a bit further, if the weakest portion of the bubble’s membrane fails, damage can quickly spread to the rest of the asset class.”

Since markets supposedly function as “future discounting mechanisms”, it should follow that in spite of the absence of the proverbial “pin”, these perturbations could be portentous of an impending dislocation rather than be reactive to one, in contrast to Mr. Roach’s opinion. Instead of being an outright effect, it could be construed as being ‘symptomatic’ to an underlying cause.

I have stated in my recent past outlooks that the markets could be adducing to a US centric-world economic growth slowdown or corollary to the belated effects of the coordinated tightening by Global central banks and to even the resonant calls on the ramifications of the present curtailment of the YEN carry trade arbitrage.

Empirical evidences appear to bear me out:

One, US Fed Chief Bernanke sees a housing slowdown, recently CNN Money quotes Mr. Bernanke, ``It looks to be a very orderly and moderate kind of cooling at this point.” In addition, you have Former Fed Chair Alan Greenspan echoing the same concerns that ``housing boom is over”, although noting that there is ``no evidence home prices are going to collapse.''

Of course, would it be sensible for present or past officials to prognosticate for a “collapse” as to likely trigger a financial panic? The answer is quite obvious. Yet given the law of unintended consequences, what the financial markets could be telling us at present is something we don’t naturally want to hear....a possible risk of a BUST!

The performance of the housing market in the US has manifested of a strong correlation to the consumer spending dynamics as shown in Figure 2.


Figure 2: courtesy of John Maudlin/ BCA Research: Falling Housing and real consumer spending?

What these officials could be implying is that given the close correlation of the housing dynamics to consumer spending, the backbone of the US economy, these means that consumer spending will also backtrack (and so with Asia’s and the emerging market’s export led growth) and that the US economy would see a marked deceleration soon; as to the extent or degree of the slowdown is something that has yet to be seen.

Some analysts including the widely respected BCA Research tells us that another liquidity propelled rally, due to a possible pause by the US FED on its march to normalize interest rates, could ensue on the premise of low inflation data from the major world economies belonging to the OECD, an attendant retreat in inflation in the US due to its expected growth slowdown and possible rally in global bonds in anticipation of a slowdown of global growth. This perspective is quite convergent to the projections of Deutsche Bank which I presented last week (see Deutsche Bank: Fed’s Monetary Approaches Equals Different Outcomes).

However in stark contrast, John P. Hussman, Ph.D. of the Hussman funds argue against such rose colored glass expectations (emphasis mine), ``It doesn't help to argue that the Fed will stop tightening soon, because the end of a tightening cycle has historically been followed by below-average returns for about 18 months.

Yet, all these polemics come in the perspective of the possibility a Fed pause. However, during the Federal Open Market Committee Meeting last May 10, its minutes manifested discussions of the possibilities of even raising by 50 basis points!!! Which means while the apparent consensus have been looking for a pause, incidental probabilities dictate that a 50 basis points increase could be the axiomatic “elephant in the room”!

Now the question remains, will the Fed take its pause or will it raise rates to “quell inflation” or in camouflage, defend the embattled US dollar (my long held view)? If the latter, by how much?

Falling US Dollar Leads to Stagflation?


Figure 3 Discordant Signals Falling US dollar Falling US Treasury yields (courtesy of stockcharts.com)

A falling currency is seen as “stimulative” and “inflationary”, yet as of last week, the US dollar trade weighted index appears to be rolling over, as seen in Figure 3, apparently looking towards a test to its recently marked lows (emitting inflationary signals). On the other hand, US Treasury 10 year benchmark yields (black line) appear to have broken down from its peak, signifying either a “sharp slowdown in inflationary expectations” and or an “economic growth slowdown” or both.


Figure 4 US Dollar Index St Louis Model Breaks down! (courtesy of contraryinvestor.com)

The St. Louis Federal Reserve’s methodology in computing for its US dollar trade weighted index is more representative of the country’s trading patterns than the New York’s Board of Trade (NYBOT) model, according to contraryinvestors.com (emphasis mine)...

``The bottom line is that approximately 2/3rd's of the US Dollar Index is keyed off of Euro area currencies. And unbelievably enough, the USD Index does not contain any relative currency weighting at all to key trading partners such as Mexico and many Asian countries such as Korea, Thailand, Taiwan, Singapore, Hong Kong, etc. It just so happens that the St. Louis Fed does calculate an alternative trade weighted dollar index that is much more representative of the true US trade situation globally, importantly inclusive of Mexico, China and many Asian currencies...Unlike the widely quoted, largely Euro area currency driven US Dollar Index, the St. Louis trade weighted dollar index has now broken below the late 2004 and early 2005 lows. It's telling us that it's a good bet the headline US Dollar Index follows. If indeed this comes to pass, we have to believe the consensus will be taken a bit aback in terms of heightened inflationary concerns.”

If contraryinvestor.com is right about their projections of a continued downdraft of the US dollar then what may strike as the UNSEEN variable could be a “stagflationary” environment, or characterized by low/stagnant growth and high inflation (a scenario we discussed since 2003)!

The Curtailment of the Yen Carry Trade: Getting A Larger Audience

Second, is that the backstop of the synchronized global rate hikes has possibly prompted for the retrenchment of the Yen Carry trade arbitrage.

I noted that the economic recovery prospects in Japan has reduced its need to flood its banking system with excess cash/reserves and thereby go about restoring normalcy to its monetary policies by lifting its easy money policies such as the QE Quantitative Easing and eventually the ZIRP Zero Interest Rate Policies (see last week’s Jim Jubak/Gavekal: Yen Carry Tumult and Apr 24 to 28 edition, Improving Your Portfolio Returns by Seeing the Unseen).

Where global investors used to lever funds from an almost zero interest yielding yen to arbitrage investments in diverse asset classes, such as US treasuries, emerging market debts and or equities or even commodities, the prospects of normalizing Japan’s monetary policy effectively lowers the economic incentive to straddle between the yield differentials between currencies, where the arbitrage opportunity lies.

It has been widely suspected that the recent selloffs in the global financial markets had been linked to the liquidity crunch or deleveraging brought about by Japan’s move to tighten its money policies. ``The unwinding of yen-carry trades exacerbated sell-offs that started with a slide in the U.S. dollar and falling commodity prices.” notes Bloomberg Asian analyst William Pesek Jr.

Mr. Pesek further observes that ``What makes the yen-carry trade so worrisome -- and easy to dismiss as a potential problem for markets -- is that no one really knows how big it is. It's not like the BOJ has credible intelligence on how many companies, hedge funds or mutual funds borrowed in yen -- or how much -- and put the money into assets elsewhere.”

Well, Gavekal Research whom has done a persnickety work tracking down yen capital flows has estimated that about US$1.8 trillion worth of Japanese capital found its way into the global financial markets in sundry assets, mostly to US treasuries. This is equivalent to around 15% of US GDP or 3% of US assets.

In other words, with the previous massive capital outflow from Japan’s residents plus a heavily yen denominated leveraged global financial community, any drastic moves to imbue or absorb back excess reserves or raise rates could further unsettle and destabilize the global financial markets.

With the Japanese governments’ apparent acknowledgement of the global market’s fallout, which had been “aggravated” from its pronounced reversal from its present “anti-deflation” policies, it has pumped back a record 1.5 trillion yen into the money markets last May 29th. This action suggests that Japan’s government, cognizant of the probable negative repercussions posed to the global financial markets, may go slow in its attempt to restore normalcy with its monetary policies.

This simply shows that the world markets will have to adjust and learn to live with the newfangled risk environment posed by Japan’s recovery, in the mellifluous words of Bloomberg’s Mr. Pesek, ``The world has anxiously awaited Japan's recovery, and its arrival is good news for Asia. Yet there's a catch: As Japan raises its interest rates, it may export higher borrowing costs everywhere else.”

Until then, the likelihood is that markets would remain volatile while it adjusts to present realities.

Philippine Assets: Vulnerable to Liquidity Crunch

What has all these got to do with Philippine financial markets? Almost everything.

For the Phisix, which has been predominantly backstopped by foreign buying since 2003, question is how much of these portfolio investments have been levered to the Yen carry arbitrage or through various channels intermediated by the hedge fund dominated highly sophisticated leveraged/credit system.

The massive conflated sellout in almost the entire spectrum of asset classes simply validates my analysis that today’s markets have been largely macro driven brought about by the technology enabled financial market integration and increased globalization.


Figure 5: stockcharts.com Phisix and JP Morgan Fleming Emerging Markets

Once a similitude of a liquidity crunch occurs, as in the recent case, our asset class despite being a nominal laggard compared to its neighbors or its peers, would likely reflect the same degree of activity but of a more subdued intensity. As an illustration, the Phisix in red candlestick closely tracking (peaks and troughs-have been almost as one) the movements of the JP Morgan Emerging Market Index...

Need I say more?


Figure 6: IMF Growing Domestic Investor Holdership of RoPs (%)

And of the bond markets, despite the improving percentage of ownership of RoPs by domestic investors ($10 billion), mostly by banks (81%), insurance and pension companies (14%), foreign money still dominates ownership of the $28 billion outstanding, according to the IMF. Given the above, the likelihood is that the dynamics in the bond markets despite its fundamental differences may somewhat reflect that of the Phisix. Posted by Picasa

Understanding Math of Expectations Differentiates Gambling from Calculated play

``Think of how stupid the average person is, and realize half of them are stupider than that.” George Carlin, US Comedian and Actor


Last week, I’d been posed a wily question at my blogsite on whether, given my present outlook, what constitutes a calculated play and a gamble?

I’d like to share to you my response. We are living in a statistical world of frequencies and probabilities such that the impacts or effects of our choices could be actually be measured by certain available variables during the time of reckoning. This is known as the concept of the mean (also called average or expectations).

Because of the complexity of the structural makeup of the financial markets, in most circumstances the profusion of variables could lead a participant to overlook certain variables or to overemphasize on some, given one’s innate biases. And this leads to what we may call as asymmetry.

In the financial playing field there is what you call an asymmetry of odds and the asymmetry of outcomes. Asymmetry in odds suggests that the distribution of probabilities is not a level 50-50% but with one aspect of the probability higher or greater than the other, while asymmetric outcomes mean that the payoffs are not the equal.

Let me ‘frame’ you a case which I lifted from mathematician Nicolas Taleb ``Fooled by Randomness”...

``Assume I engage in a gambling strategy that has 999 chances in 1,000 of making $1 (event A) and 1 chance in 1,000 of losing $10,000 (event B).


Event Probability Outcome Expectation

A 999/1000 $1 $.999

B 1/1000 -$10,000 -$10

Total -9.001

``My expectation is a loss of close to $9 (obtained by multiplying the probabilities by the corresponding outcomes). The frequency or probability of the loss, in and by itself, is totally irrelevant; it needs to be judged in connection with the magnitude of the outcome. Odds are that we would make money by betting for event A, but it is not a good idea to do so."

What Mr. Taleb suggests is that most people (including those with advanced degrees or MBAs) would be enticed to act on the winning odds (Event A) due to the inordinate focus on the frequency despite the understanding that an occurrence of a low probability event may affect a greater deal relative to the outcome than the combined wins. This blatant omission, despite the mathematical fact, is likely to lead to the decimation of one’s portfolio.

In other words, the difference between a calculated play and a gamble is matter of understanding the ‘concept of mean’ or of knowing one’s profit or loss expectations arising from the mathematical computation of events as determined by its probabilities and its potential outcome.

Edward Lefévre who wrote on behalf of legendary trader Jesse Livermore, in Reminiscences of A Stock Operator, notes of the importance of understanding probabilities even as a trader, quoting Mr. Lefévre at length,

``Observation, experience, memory and mathematics—these are what the successful trader must depend on. He must not only observe accurately but remember at all times what he has observed. He cannot bet on the unreasonable or on the unexpected, however strong his personal convictions may be about man’s unreasonableness or however certain he may feel that the unexpected happens frequently. He must bet always on probabilities—that is, try to anticipate them. Years of practice at the game, of constant study, of always remembering, enable the trader to act on an instant when the unexpected happens as well as when the expected comes to pass.”

Applied to the present risk environment, this is where, in my view, the probabilities of an outsized returns are greatly less than the potential losses until mitigating signs say otherwise.