But whereas -- after an injunction had been judicially intimated to me by this Holy Office, to the effect that I must altogether abandon the false opinion that the sun is the center of the world and immovable, and that the earth is not the center of the world, and moves, and that I must not hold, defend, or teach in any way whatsoever, verbally or in writing, the said false doctrine, and after it had been notified to me that the said doctrine was contrary to Holy Scripture -- I wrote and printed a book in which I discuss this new doctrine already condemned, and adduce arguments of great cogency in its favor, without presenting any solution of these, and for this reason I have been pronounced by the Holy Office to be vehemently suspected of heresy, that is to say, of having held and believed that the Sun is the center of the world and immovable, and that the earth is not the center and moves—Recantation of Galileo (June 22, 1633)
In this issue
Phisix: As Risks Mounts, PANIC BUYING Grips the PSE!
-Pavlov’s Zombies Runs Amuck at the PSE!
-More Signs of Hissing Global Casino Bubble
-A Boom for the Government and Politically Connected Elites
-2Q GDP Growth has been based from the Money Illusion
-DEBT Drives Growth: Credit to GDP May Have Likely Passed Pre-Asian Crisis Highs
-More Sanitized Alarm Bells from the BSP Governor
-Bubbles Are About “Something For Nothing”
Phisix: As Risks Mounts, PANIC BUYING Grips the PSE!
Pavlov’s Zombies Runs Amuck at the PSE!
Ivan Pavlov (1849-1936) was a Russian physiologist whose major contribution to the field of psychology was his introduction of “classical conditioning”. Classical conditioning according to Wikipedia.org is a kind of learning that occurs when a conditioned stimulus (CS) is paired with an unconditioned stimulus (US)[1].
In his famous experiment using dogs, Mr. Pavlov observed that when meat powder has been placed into their mouths, dogs salivate. The prospect of food represents the unconditioned stimulus. But Mr. Pavlov wanted to demonstrate how dogs can be taught to salivate even without the unconditioned stimulus; so he did by the repetition of the ringing of the bell prior to giving the meat powder. So each time Mr. Pavlov rang the bell, dogs would slabber at the prospects of meat powder. So the bell provided the signal trigger (conditioned stimulus) to initiate a reflex response to the unconditioned stimulus.
I recall of this seeming Pavlovian response in the 2013 Paramount Picture about a Zombie pandemic called World War Z. Somewhere in the Middle East, a walled city separated humans from the undead. However when the zombies hear of the continuous chanting of paeans over the wall, signal conditioned zombies frantically piled atop each other in a desperate reflex response rush to reach the humans. Eventually the zombies breach the walls and goes on to infect the entire city. You can see the scene here.
This week’s fantastic 3.0% Phisix spurt is an example of delusion oriented frenzied activities (see bubble psychology chart below) almost similar to Zombies piling atop each other (World War Z picture from the Examiner[2]).
Market participants has not only been disregarding risks and flagrantly overpaying for excessively overvalued securities predicated on the “g-r-o-w-t-h” signals, importantly markets appear to have been conditioned to believe that prices will not only rise forever but will EXPLODE to the firmament soon. At any rate, the snowballing psychology from the 'fear-of-missing out' has been prompting for an orgasmic scramble to bid up prices AT ANY LEVEL!
I previously warned that the BSP Governor’s warning on complacency and chasing the market comes a little too late[3].
Manias, which operate around the principle of the “greater fool”, signify a self-reinforcing process.
Rising prices induce more punts which lead to even higher prices as the momentum escalates. Suckers draw in more patsies into a mindless wild and frenetic chase to scalp for marginal “yields” and or from the psychological fear of missing out and or from peer pressures all predicated on the belief of the eternity of a risk-free one way trade. The intensifying hysteria will continue to be egged on by the beneficiaries from such invisible political redistribution both in public and private sectors, supported by bubble ‘expert’ apologists and media cronies.
Therefore, recklessness will compound on the accrued recklessness. Again this isn’t just a problem of overvaluations (from which the BSP’s perspective has been anchored) which merely is a symptom, instead this represents deepening signs of intensive misallocations of capital expressed through the massive contortion of prices and the disproportionate distribution of resources on a few sectors at the expense of the others that which has mostly been financed by debt accumulation, thereby elevating risks of financial instability or an economic meltdown. The BSP’s increasing use of communications with sanitized “alarm bells” signify on such emerging risks
And like typical Ponzi schemes, the manic process goes on until the ‘greater fools’ run out, or that every possible ‘fool’ has already been “IN” (crowded trade), or that borrowing costs has reached intolerable limits to expose on foolhardy speculative activities
The BSP chief goes on to raise the specter of capital outflows again this week. More on this later.
Has this really been about growth?
Let me cite two examples
First SM Investment [PSE SM]. SM reported first half earnings for 2014 down by 2.5% where EPS declined from Php 35 per share to Php 34. Yet SM share prices have been up 13.29% year to date, although underperforming the index. The result from this massive bid up of SM’s share has been to balloon earnings multiple. So higher multiple begets even HIGHER multiple! SM has the second largest free float market cap weighting in the Phisix benchmark at 9.16% as of Friday’s close.
Next PLDT [PSE: TEL]. The Phisix largest market cap telco company (12% Phisix weighting as of Friday) has posted a meager 2% increase in Net income over the same period[4]. Yet the stock has been up by a whopping 28.36% also as of Friday. Given its weight, PLDT has been partly responsible for boosting the stunning 23.82% yield of the Phisix year to date.
The public has been buying into the promise for more “g-r-o-w-t-h”. Yet history suggests that PLDT’s EPS growth rate has been consistently within less than 5% rate (or less than statistical GDP). Over the past 3 years (2011-13), PLDTs EPS CAGR has been at 3.77%. If 2010 will be included, the 4 year CAGR drops to a negative (-9.83%)!
PLDT’s prices have become disconnected with reality.
As a side note, PLDT’s mogul has been touted to run for Vice President in the 2016 national elections. Has the current push on his firm’s stock been engineered to finance the forthcoming elections campaign in 2016? Wouldn’t it be pleasant for MVP’s political plans be subsidized by stock market punters?
Yet from the perspective of the 2 biggest market cap, such massive bidding up of securities has hardly been about “fundamentals” but about a run similar to the frantic zombies scaling up the wall
Now even if we look at the high growth issues, returns on investments gambling (ROG) have already exceeded whatever ‘growth’ attained for the year. So further price increases would extrapolate to multiple expansion and NOT growth.
Yet the higher price level, the deeper the fall. As Newton’s Third law of motion states: To every action there is always opposed an equal reaction
More Signs of Hissing Global Casino Bubble
And speaking of gambling, the global gambling industry seems to have really hit the skids.
Apparently since my writing, the bear market in Macau’s stocks has only deepened.
Even share prices of Singapore’s Genting [G13.SI]—operator of Resort’s World Sentosa has been slammed (left). Tepid revenue increase from domestic and regional high rollers and 94% hotel occupancy rate has failed to stem a plunge in 2Q profits, which according to Channel News Asia has been due to the sluggish growth in the mass market segment[6]
The spillover has apparently reached US peers. Stocks of casino majors WYNN Resorts [WYNN Nasdaq] Las Vegas Sands [LVS: NYSE] and MGM Resorts International [MGM: NYSE] has been under pressure in the face of the record high for the S&P.
In Atlantic City New Jersey, two casinos the Showboat and the Revel closed last week[7]. The mega casino Revel, despite the majestic interior design[8], has failed to attract gamblers in a highly competitive market. Atlantic City started the year with 12 casinos. Last week’s closures add to the earlier two which means 4 closed casinos in Atlantic City this year! Excess capacity brought about by zero bound rates appears to be taking its toll.
The US Dow Jones Gambling Index has been reflecting on the troubles currently experienced by the casino bubble industry (right window). Following the peak in early March, the Gambling Index appears to have crossed the bear market threshold last week. Or a 20% loss in just 4 months. Easy up, Easy down.
One probable reason why gambling industry could have been foundering could be that gamblers have found an alternative. And that alternative comes without the necessity of leaving the abode. The alternative I mention here is the stock market. Although record US stocks has emerged amidst declining volume.
None of this really matters to domestic stock market participants.
The domestic casino players such as Bloomberry Resorts [PSE: BLOOM] or SM’s subsidiary, Belle Corp’s [PSE: BEL] City of Dreams, have proclaimed that their casinos will serve as an “alternative” to Macau which caters to Chinese gamblers and to other Asian players.
Yet as noted above, share prices of Macau and Singapore casinos have already been revealing signs of substantial weakness that seems as being transmitted through the hissing property bubble in China.
And add to this the Chinese government’s anti-corruption measure which seems more like a political inquisition or in the words of prominent short seller and China bear Jim Chanos “Soviet-style 1930s purge through a social media”[9].
And may I add that in spite of the levitation in Chinese equities, Chinese companies have commenced at posting losses at a record pace. From Asian Nikkei[10] (bold mine): A record number of listed Chinese companies bled red ink over the six months ended June 30 as oversupply issues persisted in the manufacturing sector and the government's frugality order hurt sales of luxury goods. Out of 2,556 companies listed in Shanghai and Shenzhen, 366, or about 14%, logged net losses. The manufacturing sector, including steel and nonferrous metals, accounted for the largest share with 247. Falling housing prices hit the real estate business hard, and 26 companies in the sector posted losses.
So in China, rising stocks comes along falling earnings, or if not “red ink”. Funny but haven’t rising stocks been supposed to discount higher future cash flows?
And the spreading of property related distress has likewise begun to squeeze on profits even for China’s largest banks.
Again from another Asian Nikkei article (bold mine)[11]: With China's economy slowing, earnings among smaller companies are stagnating. This, combined with the souring property market, is taking a toll on lenders. Though bad loans make up only around 1% of total lending by China's banks, they are already putting a squeeze on profits…China's four biggest banks are Industrial & Commercial Bank of China, China Construction Bank, Agricultural Bank of China, and Bank of China. For the January-June half, they reported a collective net profit of 472.5 billion yuan, a rise of just 9.6% from the first half of 2013, compared to the double-digit growth of the past. The biggest of the four, Industrial & Commercial Bank of China, reported the least growth. Its net profit rose just 7.0%, the smallest gain since right after the Lehman shock, when net profit in 2009 grew just 2.9%. The rise in bad loans, especially from companies in the manufacturing and wholesale and retail sectors, is one of the main factors behind the smaller profit growth. With the economy slowing in the first half and exports losing steam, there was a surge in bad loans from smaller companies in coastal provinces such as Guangdong, Jiangsu and Shandong, said Bank of China Vice President Zhang Jinliang.
And domestic casinos are banking on Chinese gamblers to sustain their growth?
And this supply side growth has been an Asia affair, Vietnam has been slated to open 5 casinos[12]. So if most within the region will be adding to supply in the face of deterioration demand, then the logical outcome won’t be ‘g-r-o-w-t-h’ but instead would parallel developments at the Atlantic City, N. J.
Nonetheless misperceptions from ‘this time is different’ will persist…until it won’t.
SM Investments began to pre-market its Php 8.7 billion (US $200 million) City of Dreams IPO via Premium Leisure Group where Belle Corp reportedly will divest or sell its shares[13]. This would be an interesting IPO. Will this be gobbled up by international investors or exclusively by locals?
Unfortunately Belle has underperformed the Phisix up by a paltry 4.67% y-t-d.
Bloomberry riding on the coattails of the financial system’s 30% money supply growth has posted Php 2.31 billion profits in the first half of 2014 reversing last year’s Php 1.02 billion loss[14]. And so because of signal trigger of “g-r-o-w-t-h”, punters has been into a buying frenzy on BLOOM shares which sent the share prices up by almost half 46% (year to date)!!
Yet as the Dow Jones Gambling Index shows easy up equals easy down.
A Boom for the Government and Politically Connected Elites
In the context of the current mania in Philippine stocks, part of the mounting imbalances can be seen via a “disproportionate distribution of resources on a few sectors at the expense of the others”
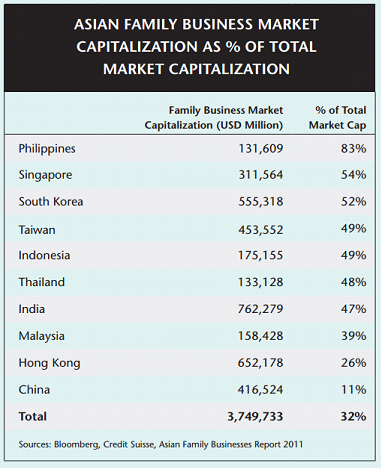
This squares with my comment last week where I wrote[15]: Analyst Martin Spring observes that for the Philippines, “just 40 of the country’s richest famillies account for, control and enjoy the benefits of 76 per cent of annual production”, if Mr. Spring’s estimates are anywhere near the truth, then the 2Q 2014 6.4% growth represents “growth” mostly for these elite 40 families.
All one has to do is to look at media and observe where money has been flowing through.
Let me cite some examples. Shopping mall giant SM Prime Holdings recently raised Php 20 billion through the capital markets with the issuance of 6, 7 and 10 year bonds with 5.1%, 5.2006% and 5.7417% coupon rates respectively[16].
It’s really fantastic to see how “40 of the country’s richest famillies account for, control and enjoy the benefits of 76 per cent of annual production” have been absorbing much of the nation’s savings or resources at essentially free of financing costs.
It’s not just that people have been piling desperately into stocks, but rather current environment reveals how the 40 families have been reaping a shocking windfall from financial repression policies by inducing investors to frenetically reach for yields even at real negative returns or a net loss from the bond and preferred share markets!
Total Market capitalization as % of GDP has reached 105.6 in 2012 as per the World Bank, chart from Tradingeconomics.com. In 2013 since the Phisix yielded only 1.33% as compared to a statistical 7.2% GDP, a back of the envelop calculation posits that the said ratio must have declined to possibly 99.73. However, considering the 1H GDP at 6%, coming amidst a 26.8% return at the end of June, this implies a market cap to GDP at a stunning record of 120.53 way way way past the pre-Asian Crisis!
This shows two very important things.
One, the grotesqueness of mispricing or excessive valuations.
Warren Buffett calls the Market cap to GDP as the best single measure of valuations[17]. In an Fortune article in December 2001 in an ex post analysis of the dot.com bubble bust, Mr. Buffett wrote, (bold mine)
On a macro basis, quantification doesn't have to be complicated at all. Below is a chart, starting almost 80 years ago and really quite fundamental in what it says. The chart shows the market value of all publicly traded securities as a percentage of the country's business--that is, as a percentage of GNP. The ratio has certain limitations in telling you what you need to know. Still, it is probably the best single measure of where valuations stand at any given moment. And as you can see, nearly two years ago the ratio rose to an unprecedented level. That should have been a very strong warning signal.
Mr. Buffett warns why consensus “g-r-o-w-t-h” story is unsustainable.
For investors to gain wealth at a rate that exceeds the growth of U.S. business, the percentage relationship line on the chart must keep going up and up. If GNP is going to grow 5% a year and you want market values to go up 10%, then you need to have the line go straight off the top of the chart. That won't happen.
I have pointed here earlier how ASEAN equity market bellwethers based on market cap to GDP has reached absurd levels[18]. (see charts here)
Two, given that 80+% market cap has been controlled by elites, this reveals where growth really went to or who are the prime beneficiaries[19] of the current boom in stocks.
So BSP’s policies have in effect been a transfer mechanism to the government and to politically connected elites.
Such invisible transfers have been justified by the brainwashing of the public coursed through mainstream media.
2Q GDP Growth has been based from the Money Illusion
And as I have been saying here, those extensive rechanneling of resources to the elites are being used in a race to build “supply”, which has been the major source of imbalances. This comes even when final demand has exhibited signs of a slowdown.
The BSP reported inflation rate for August remains at 4.9%[20]. As a side note, I find it peculiar for the BSP to even talk about “core inflation”—which excludes food and energy—when food plus energy comprise the bulk of the average statistical Philippine consumer. Based on BSP’s own CPI basket, food and energy (which housing is part of the category) represent 61.45% of household consumption! This obsession to statistically correlate with developed economies is just plain misleading.
As discussed last week, the 2Q “plunge” in investments highlights a fall in “future” final demand. This comes along with the current downshift in household consumption which means a decline in “current” final demand. If sustained, then the 2Q dynamics will hardly provide the g-r-o-w-t-h story in the coming months. And this statistical mirage has been the basis for the delirious overpayment by the consensus.
With only less than 20% of GDP, OFW Remittances and BPO outsourcing will only provide subsidiary support. Yet these factors are sensitive to exogenous events.
I previously noted that exports saved day. I found out this has only been partly true. While exports did grow, what really defined 2Q growth from international trade was a collapse in imports (-4.0% in May and -3.0% in June)!!! The amplified Exports less Imports delivered the gist of growth.
But why has imports collapsed? Certainly this has not been due to “truck ban” as imports and exports transit through the Philippine Ports Authority. And certainly if imports had been constrained say due to anti-smuggling measures, then given the massive credit growth 18.52% in the banking system for the quarter, this would incite an upside spiral in consumer prices.
The most logical explanation is that based on the 4.9% inflation last June, this suggest that supply pressures had been met partly by domestic production (thus the spike in food manufacturing) and by imports through the black market or smuggling, for inflation rates to have maintained at current levels. Or the other hand, it could be that inflation rate has been vastly understated.
Under an inflationary environment numbers are deceiving. Let us say entity X produces 100,000 units a year priced at 10 currency units each. Let’s say the currency unit is the Philippine peso. This extrapolates to an annual Peso output of 1,000,000.
Let us say due to inflation, prices per unit increased by 10% or Php 11. Let us further assume the output remains fixed. At the end of the year, Peso output will be valued at Php 1,100,000. So there will be growth in Peso value transactions but not in the actual output.
And even if output declines, for as long as the decline will not be equal or be more than the inflation rates, the numbers will reveal “growth”. You can apply this to a firm, an industry, or a nation.
This is called the “Money Illusion” where people tend to see and think in nominal terms rather than in real terms[21].
So given the rampant surge in food prices during this period, the brisk Peso based growth from food manufacturing, which incidentally accounted for 37% of the manufacturing output based on constant prices, can manifest or may have most likely reflected on money illusion rather than real output growth.
All told, outside manufacturing, there has been little support to the 2Q statistical economy except through the bubble sectors, particularly trade and real estate.
Thus the kernel of 2Q 2014 6.4% growth must have been through the money illusion.
It’s even a wonder why despite a sustained and even accelerating surge in the growth of banking credit to the Fishing industry, not only has “growth” been negative for three straight quarters, but likewise, there has been little signs of credit distress or even credit tightening to the sector. This tells of the possibility that bank loans may not have ended on its registered industry or use.
DEBT Drives Growth: Credit to GDP May Have Likely Passed Pre-Asian Crisis Highs
I have been right that capex for the bubble industries will likely be channeled through bond markets in addition to bank borrowing. This defines the difference between pre-2009 and today. Last March I wrote[22]: Notice too that most of the proposed capex financing in 2014 will be raised via debt (bonds) rather than equity. This adds to another unseen variable for the mainstream, what if for some reason or another, a black swan event occurs from anywhere from around the world, which like in 2008 will have a contagion effect? The Philippines was hardly exposed to dangerous debt levels in 2008. Although the US crisis had an impact, this wasn’t enough rattle the economy hardly tainted by debt. But it has been a different story today as shown above whether seen in nominal peso or in %. Like almost every emerging market economy, the Philippines have immersed herself in debt. The above graphics based on BSP data only covers banking loans. It excludes local currency and foreign currency denominated bonds, as well as, offshore bank dollar or foreign currency based borrowing.
Traditional debt hasn’t been enough. Bank of the Philippines [PSE: BPI] Family Savings bank will now employ financial engineering by using pools of Auto Loan mortgages as part of securitized collateral to obtain Php 5 billion credit[23]. In short, BPI will now employ Asset Backed Securities (ABS) to expand access to credit. Nice.
The consensus hardly realizes where “demand” which underpins current growth comes from. All they do is to read statistics and project them into the future. They hardly understand the origins of “growth”.
Take the real estate industry. It is seldom for consumers to buy properties in cash. So the biggest source of financing is either through bank house mortgages or in-house financing provided by developers.
For the lower income stratum, the major form of financing have been from government agencies at subsidized mortgaged rates—again paid for again by lower purchasing power of the peso. So the underprivileged thinks that they are being subsidized by the government. They do not realizing that whatever subsidies they see on the surface has been negated by the loss of purchasing power.
And that’s why the money illusion principle has been very powerful political tool used by authorities. Like magic, people look at the effects of the trick rather than how the trick has been conducted. So the sheep are easily fleeced.
The former (bank loans) and the latter (loans from government agencies) have been monitored by the Bangko Sentral ng Pilipinas (BSP). In house financing, on the other hand, comprises one segment of the shadow banking industry as discussed last year[24].
In-house finance is basically a vendor finance scheme, where the sellers provide credit to buyers for the latter to acquire the former’s products. Investopedia further adds[25] (bold mine): By doing this, the company increases its sales even though it is basically buying its own products. This is a sneaky method a company can use to increase sales. It is also very risky, as the companies it lends money to are usually not very financially stable and may never pay back the money. If they don't pay back the debt, the lending company will just write-down the loss as a bad debt.
Applied to the real estate industry, the customers include retail individual buyers.
But where will developers get to fund vendor finance scheme? Outside internal cash flows, by primarily borrowing from banks and secondly from the capital markets as we are seeing today. They can also come from equity issuance or from placements from individuals or from corporations.
Last year I noted that based on World Bank data, Philippine shadow banks accounted for 35% of total financial assets and rising. See chart here
A recent report which spotlights Harvard’s Carmen Reinhart recent speech in the Philippines shows that these numbers may have increased due to BSP regulations.
From Interaksyon[26] (bold mine): The HSBC report showed that shadow-banking in the Philippines has been rising, especially in the real estate (in-house financing by developers), conglomerate-related nonbank lending, and pawn-broking. These make up 35 to 40 percent of total financial assets. HSBC said the increase in shadow banking has been fueled by the limits on bank loans on real estate and intra-conglomerate lending.
If true then we may have a bulging China-like Shadow Banking System which has been operating outside the radar screen of the BSP.
So first we are seeing the emergence of Wall Street like financial engineering in the formal economy, and next, a swelling of the shadow banking that has partly been the source of growth for the real estate sector. Doubly Nice.
And what all these suggest to us has been that zero bound rates have artificially “increased” demand by means of vendor (debt) financing and secondly encouraged risky lending behavior in order to satisfy the credit driven artificial increase in demand.
Sustainable? No bubble?
I have discussed last week how BSP’s policies has transformed the Philippine economic model towards increasing dependence on debt. Since 2009 the rate of credit growth has far been exceeding the growth in the statistical economy. The 20% credit boom in 2011 which has been carried through until today (or in 2013 based on the chart) appears to have resulted to a plateauing the GDP growth rates. This peaking of growth rates have been in conjunction with declining rate of credit growth.
What has been more disturbing has been growth in the credit-to-GDP levels.
As of Q4 of 2012 Domestic credit-to-GDP ratio was at 50.4 percent according to the BSP Governor Amando M Tetangco, Jr at speech at the Euromoney Philippine Investment Forum in March 2013[27]
While GDP grew at 7.2% in 2013, banking loans to the real economy expanded 15.3% (December 2013 year on year) a back of the envelop calculation tell us that (15.3-7.2=8.1) Philippine the credit to GDP ratio in 2013 has reached 58.5 (50.4+8.1).
If we include the banking loan growth during 1H 2014 at 18% vis-à-vis the 6% GDP then we arrive at (18-6=12+58.5) a credit to GDP ratio as of June 2013 at 70.5!
Putting all these into perspective we note that based on the chart from Tradingeconomics.com at the end of 2013 credit-to-GDP has surpassed the 1984 high, the consequence of which has been an inflationary recession. And as of June 2014 we have broken beyond the Pre Asian crisis highs of 62.2. WOW!
Market to GDP at all time highs! Credit to GDP also in fresh milestone highs! Simply AMAZING, if not TERRIFYING!!!
And that’s ONLY the official banking sector loans which doesn’t include shadow banks, loans raised from domestic capital markets as well as credit obtained from international banks and credit markets.
If my back of the envelop calculation is anywhere accurate then this fulfills my predictions in March of last year[28] (bold added): Since 2011, the ratio has grown at an average of 9.31% a year. At this rate, we will surpass the 1995 levels of 54.85% in 2013, and will almost reach the 1997 high of 62.2% in 2014 and far exceed the 1997 levels thereafter. Yet there is nothing constant in social events for us to rely on numerical averages. There are two ways were the ratio could explode higher that risks amplifying systemic fragility: One, even if domestic credit growth remains static, the denominator [GDP] slows meaningfully, and Second, domestic credit growth accelerates far more rapidly than the rate of GDP growth. The latter is the more likely the scenario, given today’s progressing manic phase. In other words, given the current rate of debt buildup, we will reach or even surpass the pre-Asian Crisis high anytime soon, regardless of the assurances of the BSP.
The seeming panic to finance requirements by firms of the politically connected elite with free money, frenzied borrowing and lending activities at the domestic banking system combined with the panic buying at the Philippine stock exchange has been indicative of seething risks of financial instability awaiting for an outlet valve to ventilate all these cumulative imbalances.
One last thing, how much leverage has been used to finance the funding requirements by firms of the politically connected elite? Does the BSP know?
More Sanitized Alarm Bells from the BSP Governor
In her May 2014 speech Harvard’s Carmen Reinhart has a sugarcoated warning on the Philippines. From the same article (bold mine): "Do not let the credit upgrades go into your head." This was the lesson Carmen Reinhart, Harvard John F. Kennedy School of Government professor of international finance system, imparted to the audience of the Financial Times-First Metro Philippines Investment Summit on Monday. In her speech on global economic and financial outlook, Reinhart pointed out that Mexico had been bestowed with credit upgrades by the major rating agencies right before it succumbed to a crisis. The economist said the danger with credit upgrades is complancency amid the increase in capital inflows, a result of the euphoria from the seal of approval from debt watchers. "Post-capital flow bonanza episodes are more crisis prone; it results to banking crises," Reinhart warned
Along Ms. Reinhart’s tune, after extoling the supposed strength of the Philippine economy, the BSP chief, Amando M Tetangco, Jr has ONCE AGAIN raised the specter of a massive capital flight out of Philippine assets
In a speech[29] before the Asian Bankers' Philippines International Banking Convention. Makati City last August 29, 2014, Mr Tetangco warns (bold mine): Moving forward, part of the challenge is to recognize that gains are never absolute. In this imperfect world, there is always something that can be made better or something that market needs to change in time especially since we operate in a global environment that is in constant change. Among others, heightened financial and trade integration make our own domestic operations vulnerable to external factors. The most significant of these factors is the speed and degree of normalization of monetary policies in advanced economies and how these would impact their own growth prospects. Geopolitical risks that could impact trade and prices of international commodities add to our list of challenges. On the domestic front, as I mentioned near the top of my remarks, the risks that tilt future inflation to the upside are mainly weather and supply side-related, as well as those stemming from volatilities in the financial markets. The BSP has acted pre-emptively to ward off these inflation threats through calibrated tightening of policy stance. We have earlier raised RR and increased SDA and the policy rates. We have opted to act in this manner so that banks and other stakeholders would be guided in their own assessments of the risks they face in their transactions. We will not hesitate to make further adjustments, if these are needed, in order to keep inflation expectation well-anchored and therewith limit the occurrence of second round effects. We will also continue to work with other agencies of government to address supply bottlenecks that affect movement of good and services. We will likewise remain vigilant that none of these effects pose risk to financial stability.
The good governor has always elevated malignant forces to external factors. This foreign bogeyman as I have been saying may have been meant to serve as scapegoat or as escape hatch against any untoward developments.
Bizarrely, inflation has once again been attributed to “mainly weather and supply side-related” but this time with a striking add-ON “stemming from volatilities in the financial markets”.
Unfortunately Mr. Tetangco doesn’t bother to even explain how the “calibrated tightening of policy stance” (monetary policy) will solve the mainly weather (nature) and supply side-related (real economy) influences of inflation.
Will calibrated tightening of policy stance remove typhoons, earthquakes, tsunami, drought or others? This logic transforms the BSP into a deity!
Will calibrated tightening of policy stance increase the supply of rice, other food products as well as the general products in the economy? How? Will tightening work like a magic wand such that goods will grow or emerge ex nihilo (out of nothing)?
And the surprise is how will calibrated tightening of policy stance reduce inflation risks “stemming from volatilities in the financial markets”?
The only explanation for the calibrated tightening of policy stance to influence all of the above is through the CREDIT CHANNEL.
Whatever happened to aggregate demand policies? In 2009 the BSP chief justified this by saying that “Asia must boost domestic consumption and end its dependence on exports…Maintaining an expansionary monetary policy stance to the extent that the inflation outlook allows?[30]”
From the initial phase of “expansionary monetary policy” the burst of money supply growth from credit expansion unbacked by savings has vastly distorted the pricing mechanism that has paved way for the intensive misallocation of resources. The skewed pricing mechanism has led to outsized demand or overconsumption of resources by the bubble sectors at the expense of under consumption of resources or lack of investments for other non-bubble areas as agriculture.
So when the 30%++ money supply filtered over to the general economy as consequence from credit expansion that has emerged from earlier “expansionary monetary policy stance”, price inflation spread from the bubble sectors to areas where investments lagged thereby exposing the maladjusted production structure of the economy.
Thus the weather and the “supply side-related” factors of the economy are symptoms of such maladjustments. And so with the coming volatilities in the financial markets which ironically seems like a reiterative signaling from the BSP honcho. Why??? Why does the BSP chief keep repeating this?
And by tightening, artificially based demand that has been pillared by credit expansion unbacked by savings from the previous “expansionary monetary policy” will be reduced.
That’s how calibrated tightening of policy stance affects the supply side inflation and financial volatilities.
But that’s not all.
The unfortunate part is that unproductive activities that has emerged and became dependent on the preceding loose money environment will begin to fall apart or will prove to be unviable. Yet the larger the diversion of real savings into speculative unproductive ventures or wealth consuming activities, the larger the scale of the disorderly adjustments.
Bubbles Are About “Something For Nothing”
And that’s how these policy interventions create bubbles.
These bubbles emerge from the concept of “something for nothing” which has been enshrined as social policies.
Economic bubbles are based on a belief founded that one can borrow and spend to prosperity. Economic bubble policies solely look at spending in a homogenous or quantitative dimension without assessing at the qualitative nature of spending. Bubble policies have also been blind to the quality of debt which means they are equally blind to balance sheet constraints from unbridled credit expansion.
Perhaps it may not be about being blind, but about appearing to be blind. Perhaps economic bubble policies have been more about protecting political and economic interests of the powers that be and their private sector cohorts under the mantle of a bogus and fallacious economic theory founded on unfettered spending.
That bubbles emerge from the concept of “something for nothing” can be clearly seen from the accelerating zombie like panic buying in stocks. Punters have come to believe that stocks are essentially a free lunch, where wealth may be obtained by the perpetual inflation of equity securities.
Worse we have come to a point where stocks have not only been seen as in an eternal uptrend but instead the pace of ascent will now segue into a vertical blast off phase.
Such desperation to see parabolic price movements can be equally seen in the deeply embedded one way trade conviction where any dissenting opinion would be considered politically incorrect and blasphemy, thereby like Gallileo would be condemned as an outcast
The feverish stock market buying has similarly been resonated by the free lunch funding of politically connected elite via the capital markets and the reacceleration of credit binges in the banking sector.
Yet this hasn’t just been a Philippine affair.
Indonesian gamblers have pushed the JKSE to its 2013 highs. The Phisix is just 1.85% away while the Thai SET is also 3.6% off
This Indonesian blow off phase comes even as experts raise worries over the renewed deterioration of fiscal and trade balance[31]. Yet what the consensus fails to see is that despite 5 interest rate increases totaling 175 bps, Indonesia’s public and private sector debt has been surging. So while the economy reveals signs of increased slackening, borrowed money appears as powering stocks, and importantly, Indonesia’s property bubbles.
Jakarta’s property bubble has grabbed the top spot in the world in the luxury home market with a stupefying 25+% in returns in just 6 months[32]!!! 25% as against 22% in stocks, and that’s considering last Friday’s close. Tremendous.
Again price levels of equities have been rendered immaterial, instead it is the foundations (debt) that matter now.
A timely warning from the late Astronomer Carl Sagan
One of the saddest lessons of history is this: If we’ve been bamboozled long enough, we tend to reject any evidence of the bamboozle. We’re no longer interested in finding out the truth. The bamboozle has captured us. It’s simply too painful to acknowledge, even to ourselves, that we’ve been taken. Once you give a charlatan power over you, you almost never get it back.


#mediaviewer/File:RPGDPInflationTreasury.jpg)