``When I was young, people called me a gambler. As the scale of my operations increased I became known as a speculator. Now I am called a banker. But I have been doing the same thing all the time.”- Sir Ernest Cassel (1852-1891), British Merchant Banker and Capitalist
What’s probably lingering in most of the investor’s mind today is whether the recent sell-off has been ‘overdone’ and if the selling pressures have ‘turned’ (meaning if the ‘correction’ is over), given the downpour of liquidations over a very short time frame.
Candidly speaking, I do not hold a crystal ball to know the exact or definite answer but can, at best, discern on the probabilistic outcomes based on the adverted factoids, e.g. ‘rising’ inflation and interest rates, and other multifarious variables which may have influenced the present activities, such as the Japanese Yen carry and arbitrage trade, protracted period of investor complacency or “low volatility”, decelerating US-led global economic growth, contraction of global liquidity, hedge fund or derivatives based losses, the Bernanke and US Fed “credibility” factor, etc..
Highly Correlated Markets
From what has been taken into account, today’s increasingly “globalized” and technology enabled financial market integration have set forth a “domino” effect as highlighted by the selling contagion across asset classes, from bonds, commodities, currencies to equities worldwide. In other words, since the advent of the new millennium, diverse asset classes have developed a rather “close interdependence” or have seen “increased correlation” among its activities in the financial markets. So unless we learn to accept the truisms of a ‘macro’ dictated framework for financial markets analysis we are likely to miss proverbial “the trees for the forest”.
For instance, analyst Gary Halbert of profutures.com (emphasis mine) expounds on such associations, ``Even commodity prices are starting to mimic the equity markets. Imagine commodities like oil and precious metals increasingly moving in tandem with stocks. For purposes of example, I will cite the Goldman Sachs Commodity Index (GSCI) which tracks the prices of 24 traditional commodities markets (energy, metals, grains, food, lumber, etc.). As recent as 2000, the GSCI had a negative correlation of 14% with the S&P 500 Index, meaning that commodities tended to move up when stocks moved down and vice versa. According to the Merrill Lynch study released in March, commodities have recently shown a positive correlation of 33% with the stock markets.”
A correlation is a correlation until it isn’t. What was once negatively correlated and had been used as portfolio diversification for the functional intent to “spread risks” has now evolved against fulfilling its purpose. This goes to illustrate that the attendant integration of financial markets abetted by a profusion of worldwide liquidity has led to investors (especially the highly sophisticated Hedge Funds) into tapping different asset classes using diverse methodologies, such as relative value arbitrage strategies, event-driven strategies, directional or tactical strategies, for the hunt of above average profits.
Mr Halbert adds (emphasis mine), ``Six years ago, emerging market stocks (as measured by the MSCI EAFE Index) had only a 32% correlation with the S&P 500 Index. According to the recent Merrill Lynch study, that correlation had vaulted to 96%! Emerging stocks are now trending in line with the US S&P 500 Index.” This basically explains the underlying rationale behind the cross asset feebleness of late.
Naturally, an empirical dissection of recent events depends on the frame of reference taken by the observer. For instance, the concurrent carnage seen in the emerging asset class as reflected by the Morgan Stanley Emerging Free Markets Index, which serves as bellwether to the equity performances of developing economies’ markets, shows that on a year-to-date basis the previous highfliers, as of Friday’s close down by 2.5% from a gain of over 24% in May 10th, which feels like a bear market due to the relentless selling.
Figure 1: MSCI Index Uptrend Still Intact
However, taken into the context of its three year performance as shown in Figure 1, the emerging market benchmark, after gaining by over 160% in three years, has retraced by about 38% from its peak. Moreover, despite the present selloffs the above chart shows that its 3 year trend remains unviolated, which means that the bulls remain the dominant force relative to a longer time frame despite the present selloffs.
So if you ask me, what future lies ahead for the emerging market bourses, as well as for the Phisix, my reply would be ‘until proven otherwise, the longer term bullish momentum still presents as buying opportunities...albeit until signs of stability or a bottoming out from the frenetic selloff emerges’.
Let me quote Mr. Ivan D. Martchev of Global View Points with a similar view (emphasis mine), ``I do believe that emerging markets over the long term have a very bright future. But anyone involved in emerging markets will tell you that the best buying opportunities are when there’s blood on the streets. And in the emerging market universe, there tends to be more bloodshed than in developed markets; that’s simply how it’s always worked, and how it will always work, until they finally emerge. Simply put, it can get worse.”
US: Final Phase of Business Cycle
``A lower dollar will not resolve the structural challenge the US is facing. A lower dollar will not re-create the US manufacturing industry. A lower dollar will not turn America into a nation of savers. We believe the pressures on the dollar will persist as long as there are not fundamental changes that will truly promote savings and investments. And to make it perfectly clear, we do not have an “ownership society” as long as the banks are the ones owning our homes.” Axel Merk, Merk Hard Currency Fund
The prospects of possibly going worse before getting better could still be deemed to be large. And as indicated in my previous outlook, the largest contributing factor to the present anxiety, for me, is the tempestuous developments in the US financial markets perforating into the global economy, notwithstanding the imbalances caused by the US dollar standard system.
Like your analyst, Austrian economist Hans Sennholz believes that the concomitant by global central banks are an attempt to resolve a bigger issue, ``Fears of growing imbalance and potential crisis finally prompted central banks to raise their rates, at first the Fed, then ECB, and now also the Bank of Japan.”
Furthermore Mr. Sennholz thinks that the present business cycle in the US is nonetheless headed for stagnation and or recession let me quote Mr. Sennholz at length (emphasis mine),
``Most Americans probably never heard a frank and impartial explanation of the business cycle. They do not realize that economic stagnation and recession are the final phase of a business cycle, the readjustment phase. A cycle begins when the Federal Reserve System, in order to stimulate the economy or assist government deficit financing, lowers its discount rate below the actual market rate at which the supply of and demand for savings are evenly matched. Or it may decrease interest rates through open-market operations of buying government securities. Capital at bargain rates excites many businessmen and encourages them in their investment decisions. They may expand and launch many new projects which make business thrive and boom. But as soon as goods prices and wage rates begin to rise, businessmen need additional funds. As long as the Fed provides them, the boom can continue and even accelerate. It comes to an end when the Fed ceases to throw new funds on the loan market or the quantity launched no longer suffices to feed the boom. At that time, the readjustment, that is, the recession begins.”
``The present cycle undoubtedly began after the bursting of the stock market bubble in 2000 and the terror attacks on the United States in 2001 when central banks everywhere braced for deflation and recession. In fear and trepidation they lowered their interest rates, the Bank of Japan to zero, the Federal Reserve to one percent, and the European Central Bank (ECB) to two percent, the lowest levels since World War II. In most countries the policy seemed to work as housing construction, which always is interest-rate sensitive, came to life again. Even the doubling of oil prices and other energy costs could not dampen the excitement. Goods prices rose moderately due to low-cost imports and some relocation of production, but business profits improved visibly.
``Artificially low interest rates not only stimulate economic production but also excite capital markets. As corporate profits rise, stock prices tend to soar. Real estate prices increase as buyers can shoulder greater mortgage debt. Even the loan market may flourish as foreign banks, for various reasons, acquire large quantities of American I.O.U.s. Massive trade deficits always add their quandary and risk. Last year, the U.S. balance-of-payments deficit amounted to $805 billion or 6.4 percent of gross national product. This year, it is expected to be even larger.
Whiff of Stagflation? Gone in May...Risks Still Large
I have noted in last week’s outlook of the present dislocations in the financial markets could be symptomatic of this unraveling disorder. Where Hoisington Investment Management Company in their first quarter outlook observed that 11 leading economic indicators (LEI) have been pointing down with the exception of stock prices and industrial commodity prices as measured by the Journal of Commerce, these apparently, with the recent turn of events, have turned down too, increasing the likelihood of Mr. Sennholz view that the business cycle has gradated into its final phase.
While, of course, one may note of the extreme oversold conditions resulting to the huge end of the week snapback rally in major US equity benchmarks, underlying economic trends appears to have signaled a downturn.
Figure 2 courtesy of Northern Trust on M2 Money Supply % change compared to Real GDP
As shown in Figure 2, Real Money stock M2 supply has led real GDP since the 60’s where meaningful declines in the real money stock resulted to a similar retrenchment in economic growth. Northern Trust Chief Economist Paul Kasriel comments (emphasis mine), ``I know that real M2 growth is now considered passé as an indicator of monetary policy or as a leading indicator. The Fed never mentions it, not even St. Louis Fed President Poole, a former member of the monetarist Shadow Open Market Committee. But for some odd reason the Conference Board chooses to keep PCE-price-adjusted M2 money supply in its index of Leading Economic Indicators. I suppose the odd reason is because the correlation between the Conference Board’s real M2 growth and real GDP growth is a not-too-shabby 0.60% (see Chart 2). So, we’ve got real M2 growth and the flat yield curve both suggesting that monetary policy is restrictive and the Fed on June 29 will raise the funds rate again. I can hardly wait to see how fast and by how much the consensus lowers its second-half real GDP growth forecasts after the advance Q2 real GDP data are released.”
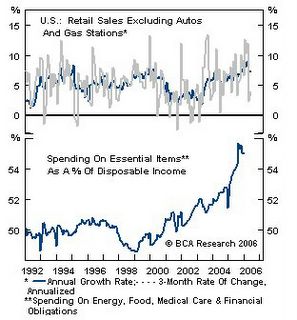
The largely moderate view of BCA Research turned glum stating that headwinds have now intensified for US consumption spending in the next few quarters on a squeeze from higher rates, high energy prices and most importantly a downturn in housing prices, notes BCA...
Figure 3 BCA Research: Consumer Spending at Peak
``Retail sales growth peaked in January and the deceleration should continue as consumer incomes are being badly squeezed by increases in “unavoidable costs”. The share of income that is dedicated to essential spending - food, energy, medical care, and financial obligations (interest payments) - is at a record high. Importantly, a key tailwind, namely housing wealth gains, is fading fast. The Fed wants to be viewed as tough on inflation, but an interest rate hike at month-end is likely to be the last for an extended period, because a sustained downshift in overall spending growth is underway. Bottom line: a period of below-trend economic growth looms.”
Figure 4: Core CPI courtesy of Barry Ritholz RR &A
With equities priced for an overdrive, recent actions in the market appear to appropriately re-rate on the toned down or much chastened outlook on the world’s main economic engine.
Notwithstanding, the recent surge in US inflation outlook led by the jump in Owner’s Equivalent Rent as shown in Figure 4, likewise discussed in our May 15 to 19 edition (see US led Global Market Correction) have effectively turned the corner for the inflation data. A growing whiff of stagflation???
In addition, recent moves by China to curtail its economic overheating by raising bank reserve requirements after an unexpectedly strong economic data.
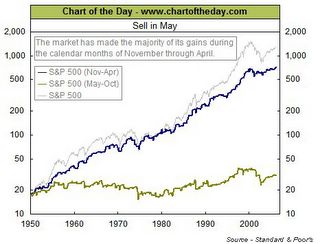
Finally, one of Wall Street’s favorite axiom, “Sell in May and Walk away” seems to have lived off its daunted reputation.
Figure 5: Chart of the Day Sell in May
Most of the gains in the US have been from November to April, which means that present activities could also represent seasonal weakness aside from the previously stated fundamental reasons.
All in all, if US based jitters continue to lead the directions in the global financial markets over the interim, specifically, a tightening money environment, lower growth prospects, broadening inflation data and subsiding earnings prospects aside from continued trends by global economies to seal excess liquidity leakages from its past accommodations and emerging risks of financial mishaps from hedge funds or derivatives, the risks potentials remain higher than prospective returns suggesting that any intermittent rallies from oversold conditions should not be mistaken for anything else except as a technical bounce.
Trade the Phisix on Opportunities; Maintain Lean Exposure
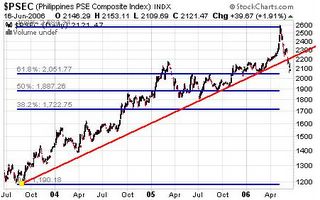
Over at the domestic market, the Phisix continues to be plagued by bleak sentiment brought about by the worldwide selloff. In fact, based on the technical picture as shown in Figure 6, the havoc wreaked by the series of foreign money selldown has effectively damaged its three year trend line signaling a possible trend reversal. Ugh.
The rallies during the last two trading days of the week, which echoed the rally in Wall Street had been patently feeble, as manifested by strong opening and weak closing while rising on lean volumes, which in technical jargon is known as a “ Dead Cat’s Bounce”. As previously described, despite local optimism, the lack of firepower by local investors has been dampened by foreign selling.
Figure 6: Phisix 3-year trend line broken!
While the prospects of a downward action for the Phisix, which may reflect activities in the global markets, could continue, I am predisposed to think that the present stockmarket cycle will either lead the Phisix to test the 1,887 or equivalent to a 50% retracement at worst or consolidate from the present levels, given that it has shed a hefty 38% from its peak, given the present circumstances.
The odds for the Phisix to return to the 1,000 level remain remote, unless the world possibly enters into a depression or another explosive political turbulence fazes the market in the absence of foreign buying. Yet, if such a scenario, a low probability high impact one does comes to pass, then the Phisix would still be drifting on a bottoming phase (reckoning from its 2002 bottom) at worst, instead of an advancing phase from present dynamics. However, the prospect of a declining phase or a break of 1,000, I think, has an infinitesimal chance.
This implies that present exposures to the market should be adjusted mainly towards trading opportunities, meaning “buy on dips and sell on resistance”, as to benefit from countertrend rallies emanating from marked selloffs.
Of course, unless some signs of stabilization manifests in the global markets, if not stark divergences among the performances of distinct asset classes or among regional equity bourses, then it would be best or prudent to remain lightly invested or underweight equities.
Awaiting Asia’s Markets to Diverge from the US
``The next half century will see a massive exchange of goods for assets that will not only shift the center of the world economy eastward but also negate the destructive impact of the age wave on asset prices and retirement opportunities.” Jeremy Siegel, The Future for Investors
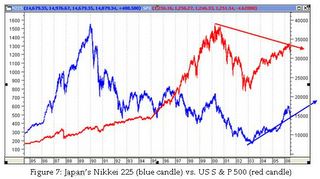
Because your analyst is a staunch adherent of cycles, over the long term my view is that Asia’s stock market cycles may reflect more of a resurgent Japan’s Nikkei than of the declining US Standard & Poor’s 500, as shown in Figure 7 on the basis growing intraregional trade, and deepening economic ties, as well as, the region’s attempt to further integrate its financial markets.
Figure 8: IMF growing share of Asia’s economy to the world
As shown in Figure 8, Asia’s rapid economic growth clip, according to the IMF, based on weighted purchasing power parity, has made the region’s GDP share contribution relative to the world greater than that of the US and the EU. Aside from the regionalization trends, Asia has been mostly underpinned by growing trade surpluses, rising foreign exchange reserves, dynamic demographic trends, liberalization of economies and swelling middle classes, such that it won’t be long when the present trends of correlation diverges.
All these do not, of course, discount the litany of risks involved.
For instance, China’s banking system is said to be in a precarious state due to its outsized debts almost equal to its foreign exchange reserve surplus. Moreover, growth of China’s excess foreign reserves have been more than the combined trade surplus and the accounted foreign direct investments inflows suggesting that speculative capital in anticipation of the Remimbi’s appreciation have padded into the system, principally into its real estate industry, such that any reversal of expectations could allegedly lead to a stampede out of remimbi and back into the “shorted” US dollar.
In addition, Asia’s mercantilist economic policies are likely to be affected by a slowdown in their major export market; the US. Notwithstanding, the declining demographical trend or the shrinking population of Japan, aside from its huge fiscal liabilities, the largest among the developed nations.
You also have the brewing political animosity between China and Japan, over the latter’s war atrocities, aside from the sovereignty squabble for oil and gas drilling at the Diaoyu islands – or Senkaku in Japanese. We must not forget the unusually quiescent North Korea of late.
Relative to risk and potential returns, coming from a low, Asia appears to have more upside potential than the US which is coming from lofty grounds.


