``So gold went down because of Volcker and high interest rates and oil went down because of increased supply and also high interest rates. In other words, it's best to think of commodites themslves as money, whether it's oil or gold or wheat.”-Eric Janzen iTulip
One of the more curious episodes in today’s global financial markets is the hullabaloo over the energy dynamics.
Amidst the recent price decline of oil and gas prices as well as its sibling metals, mainstream commentators and analysts piled atop each other to claim the “bursting of the commodity bubble”. Their arguments centered on a single dimensional premise that “higher prices translate to higher supplies”.
While, of course, there is merit to such argument; however, the oil economics is apparently more complex than what is commonly assumed by the public.
For starters, like the currency and interest rate markets, the oil markets operate NOT under free markets, but are heavily distorted by collective government’s hand.
In short, political expediencies dictate on international oil economics more than the other way around. As a result, the increasingly opaque state of market realities leads to a more pronounced investment-underinvestment cycle. For instance, the lack of transparency among the actual reserves by oil-producing states implies for inaccurate forecasts for the supply side of the oil economic equation. The world’s largest oil field, Saudi’s Ghawar was said to have been last audited for its “field-by-field” proven reserves estimates in 1975!
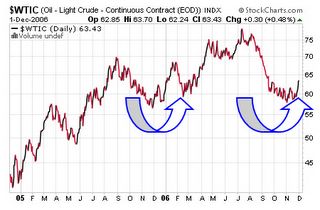
In my previous outlook, courtesy of Jeff Clark of Growth Stock Wire (please see Lagging Mines: Not For Long I Suppose October 16 to 20), he pinpointed that Oil stocks found their seasonal bottom in October since 2001 and has consistently done so. Such seasonal strength could be playing out today, as Oil stocks, as represented by the OIH benchmark, appears to have signaled a rebound in oil prices, represented by the (WTIC) West Texas Intermediate Crude, as shown in Figure 1. The WTIC benchmark leapt 7% over the week.
The double bottom formation appears to indicate a firming momentum for oil prices going forward and may attempt to test its July 14th record high close of $78.71 per barrel over the coming months.
It has been a previous concern of mine that the recent decline of oil prices could have reflected a weakening of demand from the two major growth engines of the world, particularly the US and China. However, the asynchronous signals emanated from the different asset markets, particularly the performances from the base metals group and global stocks, have confounded this concept.
Altogether it seems that far from real economics, global liquidity appears to dictate on the present whereabouts of the diverse asset markets. Put on a different lens, it is not merely demand-supply dynamics that drives world economies today but of the endless creation and intermediation of money and credit (such as structured finance, carry trades, derivatives) that creates an illusionary demand channeled through asset inflation. It has increasingly been a “finance-based” highly levered global economy rather than “real” based one.
Today’s rally in crude oil comes in the face of a supposedly “negative” development for the energy benchmark....above average inventories! According to Bloomberg (emphasis mine), ``Crude inventories fell 360,000 barrels to 340.8 million barrels last week, the Energy Department reported on Nov. 29, leaving supplies 14 percent above the five- year average.”
Yes, crude oil inventories fell this week but are way above its 5-year average, yet oil prices rallied. Why? Bloomberg suggest a simplified answer, ``OPEC decided in October to reduce output by 1.2 million barrels a day starting in November to halt sliding prices.”
You expect OPEC, the purveyor of 40% of today’s oil supplies, to fulfill its avowed mission? Over the past years, the member countries have repeatedly cheated on each other, to pad their reserves in order to get a bigger slice of sales quota. Does one expect them to comply today, given present “high revenue” opportunities? Yet at the end of the day, it’s all about the color of money, isn’t it?
If they [collective oil-producing governments] can’t be candid enough to reveal their true state of proven reserves estimates, can we yet trust them to act on helping resolve the world’s energy or global financial or economic imbalances? How keeping data confidential from each other ever lead to mutual cooperation, beats me? If you trust governments, I surely don’t.
Which leads us to the next premise, the falling US dollar. Does today’s news likewise carry the rational that the collapsing US dollar has been ONE of the major catalysts for today’s rallying oil? Apparently not.
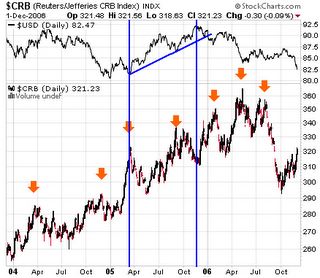
Figure 2, shows you that in the past three years, all peaks of the commodity benchmark, the CRB Index, have coincided with a trough in the US dollar Index. In 2005 where the US dollar staged a mighty rebound (marked by the uptrend in the upper pane and the two vertical lines), the CRB’s gains had been contained. It appears that today’s rallying oil prices has once again mirrored the travails of the US dollar.
Why so? Given that the demand-supply dynamics of a commodity (oil) is in equilibrium, this should translate to a price level which neither goes up or down. However, the fall of purchasing power of the underlying currency (traded in US dollars) causes the price level of the commodity (oil) to go up. So in essence, it is not only your typical supply-demand dynamics that influences oil but also the state of the purchasing power of the US dollar!
Simply, a falling US dollar translates to higher oil prices!
Let me quote Elliott Gue of the Energy Letters, ``The really big jump in demand came from the
In other words, if the Asian region constituted the “marginal demand” that has driven oil and commodity prices to these levels, its trend of firming currencies, which equates to lower oil prices, should further push demand to even greater levels that should offset any softening from the US.
Further yet, while commodity bears habitually make a comparison to the tech bubble, commodities are real assets compared to simply equity or financial based assets. To paraphrase investment maven Jim Rogers, gold or oil or commodities in general cannot go to zero, while shares in Enron can (and did)!
Of course, that is conditional on oil or gold or other commodities not being “grown on laboratories” similar to the miracle of the printing press where money can be issued limitlessly. Where something scarce and something abundant is compared for value, obviously the scarcer one gets the higher rating. As Voltaire. (1694-1778) once said, “Paper money will eventually return to its intrinsic value - nothing”.
So higher oil prices are not solely a function of demand and supply dynamics but also a manifestation of the US dollar’s declining purchasing power! 


No comments:
Post a Comment