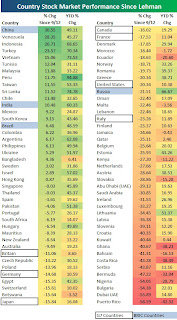
This from Bespoke, ``The S&P 500 is still 20.34% below its level just before the Lehman collapse, and 49 of the 82 countries shown below have done better. Also, 28% (23) of the countries are up since Lehman. As shown, China is up the most since September 12th with a gain of 30.55%, followed by Venezuela (28.35%), Indonesia (26.71%), Turkey (23.57%), Vietnam (15.06%), and Tunisia (12.04%). Three of the four BRIC countries are up, with Russia the only one down at -21.51%.
``The US ranks 2nd to last in terms of performance for the G7 countries. Even though a number of market indicators are back to their pre-Lehman levels, the market itself here in the US still has a lot of work to do. If you think we're at least headed back to September 12th levels, you're expecting a further gain of 25% for stocks." (emphasis added)
The implied assumption here is that the Lehman collapse (after Lehman syndrome) could have been an anomaly, hence stockmarkets have set course for a "reversion to the mean".
Nevertheless, the story has been the same: emerging markets have far outpaced developed markets.
This shouldn't be a surprise though, since the former had apparently been a victim of the contagion effects more than as the source of the crisis.
Structurally, emerging markets are likely to continue outperforming since developed markets are still undergoing the angst of the adjustment process coming off a bubble bust.
No comments:
Post a Comment