Fast and furious rally in emerging market currencies and stocks eh?
The above represents Bloomberg's Africa/Middle East's BGCC 200 Index.
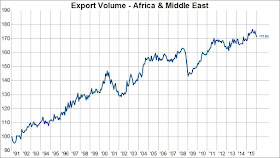
Well, Gavekal Capital presents a stunning deck of charts with their accompanying explanation on the shocking crash of Middle East exports over the past 18 months (bold mine)
The value of exports out of Africa and the Mideast, according to CPB World Trade Monitor, have absolutely collapsed over the past 18 months. In USD terms, the value of exports (volume * price) have fallen by over 59% since July 2014. This is greater than the the peak to trough fall during the Asian Financial Crisis (43%), the 2000 Tech Bust (29%) or during the Global Financial Crisis (51%). Also keep in mind that the latest data is only through January 2016 so the peak to trough decline could still be accelerating lower. If we decompose the value index into the volume index and price index we see that volume has only declined by about 3% while the price index is down over 61%.
This latest free fall has had a major impact on the CAGR for Africa and Mideast export value going back to 1991 (when the data series begins). Prior to this decline, the CAGR since 1991 was 8%. The last 18 months has brought the CAGR since 1991 below 4%! We can only imagine that that this will have significant adverse effects for government budgets in this part of the world.
It shows also why collapsing exports has incited a stampede to the US dollar, e.g. January spike in Saudi riyal's forward rates.
It also hints that whatever equity gains accrued over the past two months have likely signified as a massive dead cats' bounce than a recovery.
Finally, this likewise provide clues as to what may likely happen to Philippines OFW remittances


No comments:
Post a Comment