Two interesting charts that I would like to share with this week.
First of which I believe that First Philippine Holdings has crossed a major inflection point, from which a state of indecision as reflected by the symmetrical triangle as shown in the chart below have been recently broken.
While some may argue that the developments in First Philippine Holdings (FPH) could be related to its proposed listing of its subsidiary First Gen or due to its dividend (P 1 cash ex-date October 18, special cash P 1 ex-date October 18), my inclination is that both these issues has little to do with the present breakout. I have been fundamentally bullish on the issue primarily because the company deals profitably with the sectors that I think would be the prime movers of the Philippine economy, particularly the energy and the infrastructure sectors, alongside my favorite the mining sector.
As you will note from the above chart, FPH is an uptrend given its one year outlook. However, since the Phisix peaked in March due to the spate of foreign outflows, FPH has moved lower during March to June and effectively consolidated from July to the present. It has formed what technicians would say as ‘higher lows’ where the bears have been unable to push prices lower than the previous. In effect, the symmetrical triangle is a manifestation of a stalemate between the bears and the bulls. However, it usually suggests of a continuation of the underlying trend, which in FPH’s case is an uptrend.
Last week, FPH broke out of the “sphere of indecision” with Friday’s activities built on heavy volume and a spike in share prices up about 6%. It tested its resistance level at 44.5 but closed a fluctuation lower or at 44. I believe that the momentum has switched greatly in favor of the bulls this time with a resistance breakout due possibly next week.
I would recommend a buy on breakout on this issue as it crosses the 44.5 level. The resistance levels are as follows 46.5, 49.5-50, 53-53.5, 61.5-63.5 and a stop loss on a break of 40.5 or 39 being key support levels.
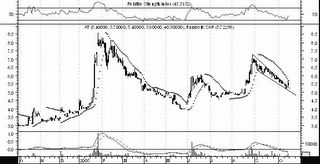
The second issue which I would like to share to you is Atlas Consolidated and Mining Corp (AT).
Since its peak in February, the copper-nickel mining company has fallen in line with its industry mates but unlike the others has resolved to keep its uptrend intact as shown in the above chart. Since its recent peak in late August, AT has been on a decline forming a bullish ‘falling wedge’ pattern. As you would notice in the past, AT has the penchant for short term spikes, which incidentally allows you the opportunity for trades, if history would rhyme.
On Friday, it broke out of the falling wedge pattern on heavy volume. Aside, the technical indicators appear to support a next run. Relative Strength Index (RSI) shown on the upper window has bounced off its oversold levels while on the lower window the Moving Averages Convergence Divergence (MACD) appears to have crossed, emitting bullish signals.
If Atlas would replicate its recent two spikes, I think it has an upside potential of 7.5 to 8 before retracing again. I would recommend a trade, buying at current levels and selling at the support levels, which should translate to about 30% in returns. Again, a stop loss at a break of the 5.2 support level considered, which translates to a loss of about 10%. In effect, your reward risk ratio is about 3:1. 


No comments:
Post a Comment