All week long business headlines spoke about “pressures” on the BSP to raise the local rates and the Phisix incrementally advanced. On Friday the BSP made good on its “pressure” and raised rates, the Phisix fell and mainstream analysts were facilely attributing these to interest rates. Call these crass analyses. First, local interest rates have low correlation to the Phisix. Second, a quarter point increase is hardly a reason to cause a contraction, as the scale of the increase is marginal. Third, most local analysts are off tangent as to forget that foreign money are the main drivers of the Philippine equity markets, such that raising rates in fact benefits the Peso and the Phisix as to maintain the spread differentials between the rate framework of the US dollar and the Philippine Peso. Think of the
As the Mr. Jen of Morgan Stanley argues, for as long as the Fed tightens it will be very difficult for the USD/Asia to trade lower. That seems to be the case as key global currencies weaken against the US dollar including those from
During the previous week I argued that global liquidity conditions are likely to spillover the country’s equity assets and to be further bolstered by the technical picture; it appears that such conditions have reemerged as foreign money have reversed from three consecutive weeks of outflows to inflows. The Phisix jumped by 2.6% on a “late cycle rally” which has been an ongoing regionwide if not worldwide phenomenon, although what really concerns me is the tepid volume accompanying the rise.

![]()
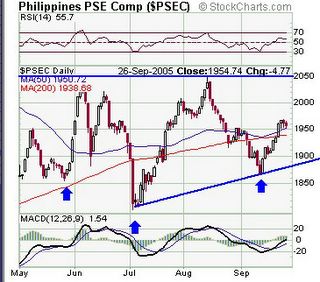
 The chart above of the Phisix courtesy of stockcharts.com shows of a successful breach of the 50-day (blue line) and 200 day (red line) moving averages. The previous resistance levels are now reckoned as the current support levels. Yet, technical indicators such as the relative strength index (RSI) shown on the upper window, as well as, the MACD on the lower window are suggestive of a likely continuation of the present momentum.
In addition I would like to point out of two technical patterns that seem to highlight bullish undertones for the Phisix, again shown in the chart above. The lower blue line depict of an interim uptrend while the resistance is marked by the “flat” horizontal line. Both lines seem to denote of a convergence or a manifestation of a bullish “ascending triangle” formation. Further the lower three blocked arrows appear to indicate of a massive reverse “head and shoulder” formation whose neckline is likewise at the resistance levels of 2,050. A successful breach of the neckline would likely see the Phisix target the 2,300 vicinity.
Again barring any unforeseen events, global liquidity flows will remain as the key drivers of global equity markets. The Institute of International Finance (IIF) projects private capital flows to emerging markets to reach $345 billion in 2005 topping the record inflows of $323 billion in 1996.
No comments:
Post a Comment