The consensus hardly ever questions how statistics are arrived at. The fundamental assumption is that government numbers are accurate representation of reality (a gospel truth) from which the mainstream have likewise moored their "analysis" on. They never question the underlying motives behind those numbers.
Yet some people can feel or notice of the real world difference between what money can buy at current terms and how governments indicate the growth level of inflation rates.
Yet some people can feel or notice of the real world difference between what money can buy at current terms and how governments indicate the growth level of inflation rates.
The following article below by The Consumer Price Illusion (hat tip zero hedge) reveals how US government’s CPI inflation have been smothered. (bold original)
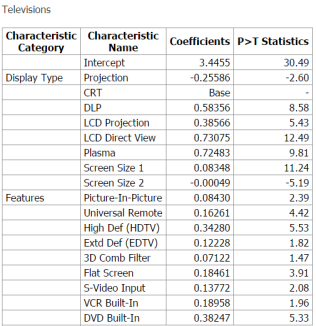
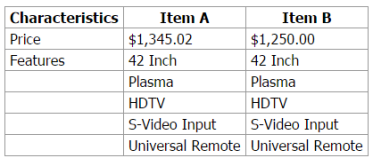
Have you heard the one about CPI?Suppose that a TV manufacturer retires a product and replaces it with a newer, better, and much more expensive one. If the new TV costs 5 times more than the old one, how can wemanipulate the hell out ofmassage the price of the old TV to make it look like the price fell? By using the dark arts of econometrics, my son!If you believe the public comments made by the world’s central bankers, the prices that consumers pay for items are not rising fast enough; in some places like Europe they worry that prices might actually fall (a tragedy for the possessing classes, as their manic one-way long bets might not work then).Central bankers are terrified of this outcome. Setting aside for a second the apparent insanity of this logic for your average consumer, who experiences price rises on a near continuous basis, let’s examine in detail one of thejokesgauges economists use for measuring prices: the Consumer Price Index (CPI).Ostensibly, the CPI is a linear combination of the “prices” of things/stuff consumers could actually purchase weighted by a percentage that the “ideal consumer” spends on any particular stuff/thing in his “ideal” basket. The main problem here is that the “prices” used are not the prices a consumer would actually pay; instead the real price for an item is scaled by what the BLS calls a “Hedonic Quality Adjustment (HQA)”. The HQA was designed to solve a real world problem economists face: the market keeps pumping out new and better devices. In practice the HQA is used to artificially depress the prices used in the calculation of the CPI.Intuitively, the HQA scales prices by their “perceived” quality. We’re not talking about human perception here, but that of a kitchen sink regression model created by BLS economists. Essentially it throws every quality an item might possess into a linear model and performs a regression of these qualities against the prices found in the market for a given product. The prices that feed into the CPI can be intuitively modeled as:This means that as far as the CPI is concerned, prices can “decrease” for three reasons:
Next time one hears media or experts utter "low" inflation keep in mind Mark Twain's warnings on statistics: Lies, Damned Lies and Statistics


No comments:
Post a Comment