The total wealth of a
country is the total value of goods and services it produces. When real estate
prices rise much faster than this value, there has effectively been a large
wealth transfer from those who don't own real estate to those who do—Michael
Pettis
In
this issue:
Q3 2024: Philippine Real Estate Enters Deflationary Spiral
Post-Pandemic Recession!
I. Q3 2024: Philippine Real Estate Sees First Deflationary
Spiral Since the Pandemic Recession!
II. A Brief Insight into the Differences Between
Pandemic-Recession Real Estate Deflation and Today’s Economic Landscape
III. Despite Declines in New Housing Loans, Total Real Estate
Consumer and Supply-Side Loans Surge, Unaffected by High Cap Rates
IV. Real Estate’s Falling
GDP Contribution and Increased Bank Lending Share Point to Heightened
Concentration Risks
V. Q3 2024 Real Estate Deflation Means Lower Sectoral and
National GDP; Slower Retail Sales Amidst Greater Supply Side Expansion
Translates to More Vacancies
VI. Real Estate Deflation Amidst Near Full-Employment? What
Happens When Unemployment Soars?
VII. Property Sector Woes: From Price Deflation to Income
Losses and Increased Debt Loads
VIII. Property Sector Woes: From Liquidity Strains to Soaring
Bank NPLs?
IX. Will the BSP Launch QE 2.0 Soon?
X. Conclusion: Two Ways to Bankruptcy: Gradually, then Suddenly
Q3 2024: Philippine Real Estate Enters Deflationary Spiral
Post-Pandemic Recession!
Philippine
real estate prices experienced their first deflationary spiral in Q3 2024 since
the pandemic recession, highlighting worsening imbalances in the sector. We
explore the potential economic implications and possible policy responses.
I. Q3 2024: Philippine Real Estate Sees First Deflationary
Spiral Since the Pandemic Recession!
The
Philippine consumer economy is hurting—and hurting badly.
This
pain is being reflected across several fronts, including the country’s most
popular investment: real estate.
Businessworld, December 30: HOUSING
PRICES nationwide declined in the third quarter, the first
contraction in over three years, data from the Bangko Sentral ng
Pilipinas (BSP) showed. The Residential Real Estate Price Index (RREPI) fell by
2.3% year on year in the July-to-September period. This was a reversal of the
2.7% growth in the second quarter and 12.9% expansion in the same period a year
ago. This was also the first time the RREPI posted a decline since the 9.4%
drop recorded in the second quarter of 2021. (bold added)
And
more news excerpts (all bold mine)
GMANews.com December 12, 2024: The
oversupply of condominium units has shot up to an equivalent of 34 months as
of November amid the sudden increase in availability of units, according to
data released by Leechiu Property Consultants (LPC)… There
were 4,971 new units launched in October and November, versus the 4,375 units
sold during the period. Year-to-date, condominium take up was recorded at
25,565 units, equivalent to 63% of that recorded in the comparable period of
2023 while project launches stood at 13,226 or half of the previous year. Golez
earlier also noted that the oversupply was due to a mix of high interest
rates and external concerns, as well as a shift in preference to
single-detached homes and properties in nearby provinces.
Inquirer.net November 16, 2024: Vacancies
in Metro Manila’s prime and grade A office market hit a 20-year high as of the
end of the third quarter this year, with rental rates declining for the fourth
straight quarter. A report from global commercial real estate services firm
Cushman and Wakefield puts the average office vacancy rate at 18.2 percent, the
highest since the second quarter of 2004. “The Metro Manila office market is
exhibiting a slower-than-expected recovery in Q3 2024,” Cushman & Wakefield
director and head of tenant advisory group Tetet Castro said in a statement.
Businessworld, November 12, 2024: DEMAND
for office space outside Metro Manila has been “less robust” as office
occupiers now have smaller space requirements, real estate
services firm JLL Philippines said. “After the pandemic, I think the demand
has weakened in general because for the key cities outside Metro Manila
like Cebu and Iloilo, we’re still seeing a bit of takeup, but for the other
peripheral areas, it’s not as robust anymore,” JLL Philippines Head of
Research and Strategic Consulting Jan-Loven C. de los Reyes said at a briefing
last week…
Businessworld, October 30, 2024: THE
OFFICE VACANCY rate in Metro Manila is projected to reach 20.5% by the end
of the year, driven by the influx of new office space and the departure of
Philippine offshore gaming operators (POGOs), according to property consultancy
firm Colliers Philippines…As of the end of the third quarter, Colliers data
showed that office space vacancy rose to 18.6% from 18.3% the previous quarter
due to space resulting from POGO lease terminations and non-renewal of
pre-pandemic leases.
My Initial Insights:
1. Polls indicate that the challenges faced
in Q3 are likely to extend throughout the rest of 2024 and beyond.
2. Mounting mismatches between
weakening demand and rising supply have led to either increasing vacancies
or a glut.
3. Even the most bullish industry advisors
have been forced to admit or confront the harsh reality facing the
sector. However, they often put on a cosmetic face or a polished façade,
promoting hope of recovery with little explanation beyond reliance on
GDP growth.
4. While real estate prices may seem
"sticky," they are actually sensitive to liquidity and interest
rates. Consequently, price declines reflect intensifying liquidity strains. In
other words, vacancies have drained liquidity from many leveraged landlords
and real estate owners, forcing them to sell properties at lower prices.
5. The inflationary boom has morphed into
a deflationary bust, where fear has replaced greed.
6. Mainstream thinking has consistently
overlooked the root of the issue: trickle-down policies that foster a
"build-and-they-will-come" ideology, relying on the assumption of
perpetual credit-driven demand fueled by low inflation and interest rates-or an
everlasting regime of easy money.
Although we have been addressing this topic
for some time, I will be quoting extensively from my May 2023 article: (bold and italics original)
There has been little
realization that the industry has invested primarily in the foundation of the
so-called "integrated community structure," anchored on urbanization
and its extension of "satellite communities."
Espousing the
contortion of Say's Law, "supply creates its own demand," through
"build and they will come," the race to build became the industry’s
bedrock.
Yet, the dynamic
preference of consumers became one of the challenges of this model.
And so, influenced by
digitalization and pandemic policies, the transformation to
hybrid/remote work has rendered a massive "sunk cost" or capital
decumulation—signified by oversupply.
…
The thing is, though
office spaces are the concern here, all other segments of the property sector
constitute part of such "integrated communities," which therefore
extrapolates to interconnection.
By extension, it also
means that the paradigm of "integrated community" is codependent not
only on the vibrancy of the office properties but also residential, shopping
malls, hotels, logistics and commercial hubs, and other related structures.
Indeed, the dilemma
of the office segment, the weakest link of the commercial real estate sector
(CRE), should spread to other areas.
Aside from the
misallocation of capital, financing these imbalances through debt signifies a
double whammy or the acceleration of capital consumption.
The point having been
made, these clusters of entrepreneurial errors are products of the distortion
of money via the BSP's easy money regime.
II. A Brief Insight into the Differences Between
Pandemic-Recession Real Estate Deflation and Today’s Economic Landscape
Here’s
a deeper dive into this developing seismic event.
The
first article noted: "This was also the first time the RREPI posted a
decline since the 9.4% drop recorded in the second quarter of 2021."
Figure
1The
last time deflation plagued the BSP’s Real Estate Price Index was in Q3 2020
(-0.4%), Q1 2021 (-4.2%), and Q2 2021 (-9.4%). (Figure 1, upper window)
However,
the difference between then and now is that policymakers responded to the
pandemic-induced economic shutdown that led to five consecutive quarters of GDP contraction—a full-blown
recession with aggressive measures.
Authorities
reacted to this unprecedented disruption with a record fiscal deficit.
Simultaneously, the BSP flooded the banking system with a historic Php 2.3 trillion of liquidity, aggressively cut interest rates to historic lows (2% from November 2020 to April 2022), significantly reduced the banking system’s Reserve
Requirement Ratio (RRR) from 14% to 12%,
implemented unprecedented capital, operational, and regulatory relief measures and subsidies, and placed a cap on the US dollar-Philippine peso exchange rate. The Finance Chief even ordered the SSS and GSIS to buy stocks and
support the PSEi 30.
All
these collective actions were taken to prevent credit deflation and support
collateral values—which back bank-issued loans—by reflating the
bank-dominated financial system.
Fast
forward to today, there has been no recession yet. Despite elevated interest
rates, bank credit flows have been oozing.
III. Despite Declines in New Housing Loans, Total Real Estate
Consumer and Supply-Side Loans Surge, Unaffected by High Cap Rates
Still,
the RREPI fell into deflationary territory, led by properties in Metro Manila,
which posted a 14.6% contraction—the second-largest decline since the
18.3% shrinkage in Q2 2021. (Figure 1, lower chart)
Areas
outside the National Capital Region (AONCR) have experienced a sharp slowdown but remain on a growth path.
Importantly,
AONCR was barely affected by deflation during the pandemic era. Given the
recent dynamics, it might not be exempt this time.
Figure
2The
BSP tacitly attributed this turn of events to the shrinking demand for new
housing loans. (Figure 2, topmost table)
In Q3 2024, the number of residential real estate loans
(RRELs) granted for all types of new housing units in the Philippines
contracted by 15.7 percent y-o-y. Specifically, loans granted in the NCR
and AONCR decreased by 20.3 percent and 13.0 percent, respectively. Notably,
the double-digit y-o-y contraction in RRELs in the Philippines, NCR, and
AONCR in Q3 2024 was significant, yet not as severe as the decline in
housing loan availment observed during the pandemic, which began in Q2 2020.
(BSP, 2025) [bold added]
However,
a mere lack of demand for new loans is insufficient to cause a
contraction.
Nevertheless,
theoretically, since real estate prices are duration-sensitive and
influenced by changes in long-term interest rates, these shifts also impact capitalization
rates (cap rates), which in turn affect property values.
Rising
interest rates typically lead to higher cap rates, as investors demand a higher
return to compensate for the increased cost of borrowing and the higher risk
associated with interest rate changes.
Consequently,
higher cap rates generally lead to lower property values, as expected returns
must adjust to match the new rates. Therefore, the adverse impact of higher cap
rates on property values translates to diminished demand from investors.
Notwithstanding
the contraction in new property consumer loans, aggregate real estate consumer loans hit a record high of Php 1.061 trillion in Q3, although its growth rate fell
from 13.5% in Q2 2024 to 8.07%. (Figure 2, middle graph)
On
the supply side, real estate bank loans reached a record Php 2.686 trillion in
Q3 2024, with quarterly YoY growth accelerating from 3.86% in Q2 2023 to 13.9%
in Q3 2024.
In
aggregate, total bank loans (net of interbank lending) rose to a record Php
13.24 trillion, with quarterly YoY growth also accelerating over the past five
quarters.
Thus,
higher cap rates were hardly a factor; instead, the vibrant growth in
supply-side bank lending likely contributed to more
"build-and-they-will-come" supply.
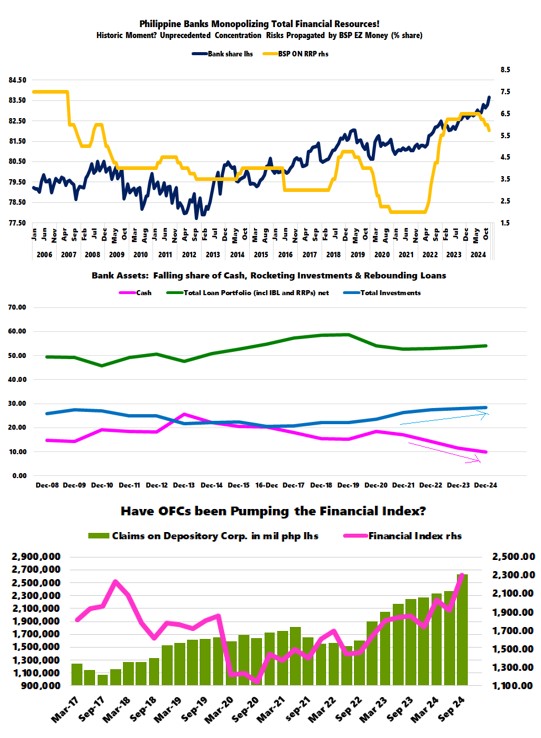
IV. Real Estate’s Falling
GDP Contribution and Increased Bank Lending Share Point to Heightened
Concentration Risks
Furthermore, reports like this can be
misleading: "Banks’ real estate exposure ratio dropped to 19.55% at
end-September from 19.92% at end-June and from 20.55% at the end of September
2023—the lowest real estate exposure ratio recorded in five years, or since the
19.5% level as of September 2019."
This
is because the data on Real Estate Loans (REL) as a share of the Total Loan
Portfolio (TLP) can signify many
things. In this instance, the decline in REL/TLP is not primarily due to
banks lending less to the sector or becoming more judicious or cautious.
Rather, banks have been lending more aggressively to other sectors,
particularly consumer credit cards and salary loans.
In
the realm of consumer loans, the share of real estate loans fell from a record
high of 45.06% in Q4 2021 to 36.4% in Q3 2024, despite record peso real
estate consumer loans. The 8.6% gap was filled by credit cards, which
increased their share from 22.3% in Q4 2021 to 29% in Q3 2024. (Figure
2, lowest diagram)
Meanwhile, the share of salary loans jumped from 8.3% to
13.22% over the same time frame.
In statistics, there are many ways to "skin
a cat."
Unless funds are designated through escrow
accounts, banks have virtually no control over how loan proceeds are
spent. Some of the credit card and salary loans—or even loans declared
for production purposes—could have been diverted to real estate mortgage
payments, property purchases, or even stock investments.
The
fact that real estate credit growth remains buoyant suggests that most of the
borrowed money may have been used for refinancing, with modest amounts
allocated to acquiring second-hand properties (for consumer loans) and
for property development expansion (supply-side loans).
This also tells us that while new buyers
played a smaller role in borrowings, more experienced buyers and property developers
significantly contributed to the sector’s bank borrowings.
On
this note, despite lackluster growth, the real estate sector’s relative
strength—compared to the overall weaker performance of other sectors—prompted a
surge in its share of GDP in
Q3 2024.
The
value-added contribution of the sector, which posted a 5.4% real GDP
growth, amounted to 5.9% of national GDP.
In
the meantime, the real estate sector’s share of Universal-Commercial bank
portfolios amounted to 20.46% in Q3.
Figure 3
Thus, a sector contributing 5.9% of GDP holds
a 20.5% share of UC bank portfolios—representing significant concentration
risks. (Figure 3, topmost chart)
Notably, this is based on the official
definition of the banks’ real estate portfolios, whose actual exposure may
already be understated.
V. Q3 2024 Real Estate Deflation Means Lower Sectoral and
National GDP; Slower Retail Sales Amidst Greater Supply Side Expansion
Translates to More Vacancies
Of
course, we’d also argue that the price deflation in Q3’s RREPI, which indicates
slower spending across the industry, means less than the advertised GDP. Again,
the sector reported 8.8% nominal GDP and 5.4% real GDP. (Figure 3, middle
image)
A
lower real estate GDP should shave off a few more percentage points from Q3’s
GDP of 5.2%.
But
here’s another potential discrepancy: According to the BSP, buyers of new
properties have been less influential in driving demand for real estate.
In
particular, condominium prices plummeted by 9.4% in Q3 2024—the third largest
of the five quarterly contractions from 2020 to the present.
However,
as a proxy, the performance of the top five listed developers (SM Prime, Ayala
Land, Megaworld, Robinsons Land, and Vista Land) tells a different story. Their
Q3 2024 real estate sales surged by 19.76% YoY, suggesting no signs of
retrenchment in new property sales.
This
raises a critical question: Were the BSP numbers inaccurate, or have
property developers been overstating their real estate sales? (Figure 3 lowest
graph)
As
a side note, the property sales of the top five developers are not limited to
residential condos; however, the comparison provided is for estimation purposes
only.
Figure
4But
there’s more.
The
slowing rental income growth of the top four developers (SM Prime, Megaworld,
Robinsons Land, and Vista Land) appears to align with the moderating revenue
growth of the top six non-construction retail chains (SM Retail, Puregold,
Robinsons Retail, Metro Retail, SSI Group, and Philippine Seven). (Figure 4, topmost diagram)
In
Q3, rental income for developers increased by 7.12%, while retail chains saw 6%
growth. Both figures peaked in 2022 (Q2 and Q3, respectively) and have been on
a downtrend since.
This
slowdown also reflects the growing mismatch between sales
growth rates and the expansion of selling areas for retail chains
and shopping malls, which has resulted in increasing vacancies.
VI. Real Estate Deflation Amidst Near Full-Employment? What
Happens When Unemployment Soars?
Intriguingly,
despite unprecedented consumer bank borrowing rates and levels, the data signals
intensifying signs of strained consumers—despite the supposedly near-full
employment rate. (Figure 4, middle window)
This
also suggests that either the government’s labor data has been significantly
stretched, or that consumers are increasingly burdened by the sustained
loss of purchasing power in their wages and incomes, or by escalating balance
sheet leverage.
Worst
of all, it could be both.
What happens when the employment rate falls?
Even more important, what happens when consumer credit slows or even
retreats?
VII. Property Sector Woes: From Price Deflation to Income
Losses and Increased Debt Loads
Of
course, deflation in the industry translates to weakened demand.
While
property firms may attempt to mask this through possible overstatements of
sales, internal pressures—such as diminishing liquidity, rising debt burdens,
and increasing servicing costs—are likely to result in the eventual
emergence of losses.
When
deflation gripped the industry in 2020–2021, the top five developers recorded
net income losses over four quarters.(Figure 4, lowest chart)
Currently,
while net incomes are at all-time highs, their growth rate has been eroding.
Figure
5Furthermore,
debt levels continue to climb to record highs, accompanied by rising interest
rate expenses. On the other hand, cash reserves have recently dropped and
stagnated. (Figure 5, topmost and middle graphs)
Coming
down the pike, the likelihood of income deficits combined with a drain in
business liquidity may result in even greater reliance on debt financing to
sustain operations—even as collateral values deteriorate.
If
these developments have already impacted the top five developers, what more
for marginal industry players—the mom-and-pop operators?
VIII. Property Sector Woes: From Liquidity Strains to Soaring
Bank NPLs?
Considering
that banks hold significant exposure to real estate, the next phase will
likely result in a surge in non-performing loans (NPLs).
When
deflation engulfed the sector in 2020-2021, real estate consumer NPLs surged
and continued to rise even when the RREPI index peaked at 14.1% in Q2 2023. (Figure
5, lowest chart)
NPLs
hit a record Php 21.7 billion in Q2 2024 but slightly declined to Php 21.28
billion in Q3 2024.
Due
to credit expansion outpacing NPL growth, these numbers have been obscured as a
function of ratios. They will likely become more prominent once credit
expansion materially slows.
Or
what is likely to follow, after mounting losses and the depletion of liquidity,
is a rise in NPLs—starting with smaller players and gradually affecting
larger industry participants, in a "periphery-to-core" dynamic.
IX. Will the BSP Launch QE 2.0 Soon?
In
addition to surging public debt, the RREPI Q3 2024 deflation provides context
for the BSP’s recent actions, which mirror a shadow of the pandemic recession
playbook. These include the reduction of the Reserve Requirement Ratio (RRR)
from 9.5% to 7%, effective October 2024, and the ongoing easing cycle, marked by the second and third interest rate cuts in
the ONRRP in Q4 2024.
Furthermore,
it explains the record-high 11-month public expenditures, reflecting the "Marcos-nomics" fiscal stimulus
aimed at offsetting the decline in private sector demand.
Figure
6 These
policies have combined to momentarily bolster liquidity, which had been eroding
from 2021 to 2023, as reflected in the YoY changes in M1. (Figure 6, topmost
visual)
Lastly,
the Php 2.3 trillion injections by the BSP were partly channeled through its net claims on the central government (NCoCG).
Interestingly,
despite the supposed economic normalization, the BSP’s NCoCG remains elevated,
prompting the IMF to request that the BSP become more transparent about its
"balance sheet strategy."
For
instance, notes Inquirer.net,
"the IMF said the BSP may want to publish more information about the size
of its portfolio of government securities (GS), which remains 'substantial'
despite declining since the central bank’s large purchases of state bonds
during the COVID-19 pandemic."
The
BSP’s NCoCG stood at Php 650 billion as of November 2024, which is vastly above
its 2002-2019 monthly average of Php 32.7 billion. (Figure 6, middle chart)
The
BSP also holds Php 1.178 trillion worth of domestic
securities (as of September 2024), accounting for 14.6% of its total
portfolio. (Figure 6, lowest graph)
The
essence here is that by partly maintaining its quantitative easing (QE), the
BSP remains heavily involved in controlling liquidity conditions in the banking
system, where the real estate industry represents a significant counterparty.
This
signifies the 'ratchet effect theory' in action, where temporary solutions to
address specific problems become a permanent part of the legal landscape. (Matulef,
2023)
The
Php 64 trillion question is: should current developments in the real estate
sector deteriorate, would the BSP launch QE 2.0?
X. Conclusion: Two Ways to Bankruptcy: Gradually, then Suddenly
All
told, despite the profusion of liquidity and the embrace of easy money
policies, deflation in the Philippine real estate industry has emerged and could
worsen.
This
highlights the widening mismatch between vigorous debt-financed
supply-side growth and weakening consumer demand—primarily driven by the
erosion of the peso's purchasing power and the extended balance sheet leverage
resulting from trickle-down policies, including the crowding-out effect.
Although
the challenge for policymakers would be to allow market forces to take
command—cleansing household, corporate, and government balance sheets while
rebuilding savings through productive undertakings—this would translate to a
vastly diminished GDP and, more importantly, reduced political boondoggles. As
such, this route is unlikely to occur.
Nonetheless,
authorities are likely to "fight the last war" by pursuing
path-dependent, free-money policies aimed at boosting aggregate demand and GDP,
while ignoring all other factors.
Lastly,
because the consensus believes these trends represent a temporary phenomenon,
isolated from the pandemic's events and previous easy money policies, the
"build-and-they-will-come" mentality is likely to prevail, driving an
even greater debt-financed "race-to-build supply"—thereby
exacerbating existing imbalances.
As American
novelist Ernest Hemingway wrote in The Sun Also Rises:
"How
did you go bankrupt? Two ways. Gradually, then suddenly."
___
References:
Prudent Investor, Philippine Real Estate:Mainstream Expert Worried Over Increasing Demand-Supply Gap; Q1 2023 Data ofTop 5 Listed RE Firms and the Property Index, May 28, 2023
Bangko Sentral ng Pilipinas, Residential Real
Estate Prices Decline in Q3 2024, December 27, 2024, bsp.gov.ph
Michael
Matulef, Beyond
Crisis: The Ratchet Effect and the Erosion of Liberty August 18, 2023,
Mises.org
Ernest
Hemingway, The Sun also Rises
Chapter 13, 1926 Project Gutenberg Canada