Showing posts with label US Treasuries. Show all posts

Sunday, August 23, 2026

Why Isn't Gold Acting Like a Safe Haven—Yet? Part III: Is This Gold's Next Leg Up?


First of all there is need to remember that the gold standard did not collapse. Governments abolished it in order to pave the way for inflation. The whole grim apparatus of oppression and coercion—policemen, customs guards, penal courts, prisons, in some countries even executioners—had to be put into action in order to destroy the gold standard. Solemn pledges were broken, retroactive laws were promulgated, provisions of constitutions and bills of rights were openly defied. And hosts of servile writers praised what the governments had done and hailed the dawn of the fiat-money millennium.—Ludwig von Mises 

In this issue: 

Why Isn't Gold Acting Like a Safe Haven—Yet? Part III: Is This Gold's Next Leg Up?

I. Introduction: From Finding the Bottom to Explaining the Reversal

II. The Gold Cycle: Cyclical bear, Secular bull

III. The New Plaza Accord: Intervention and Its Shrinking Half-Life

IV. Deepening Interventions Becomes Gold's Catalyst

V. When Former Headwinds Become Tailwinds

VII. Central Banks as Dip Buyers, and the Fund-Flow Tailwind

VI. Risk-Off, Inflationary, and Fiscal Signals Converge

VII. Central Banks as Dip Buyers, and the Fund-Flow Tailwind

VIII. Bottom line: Gold Is Pricing the Limits of Intervention 

Why Isn't Gold Acting Like a Safe Haven—Yet? Part III: Is This Gold's Next Leg Up? 

Intervention was supposed to stabilize currencies and bonds. Instead, each attempt is exposing the imbalance underneath—and gold is beginning to price it.

I. Introduction: From Finding the Bottom to Explaining the Reversal 


Figure 1 

This piece started as an attempt to answer whether gold had found a bottom. Events overtook the question. In the space of a week, gold cleared its 200-day moving average at $4,501, broke above $4,600, surpassed the 38.2% retracement of its decline from March's record, and confirmed the rounding-bottom pattern that had been forming since June. It was gold's third straight weekly gain—and its third strongest week of the year. 

The question of the bottom is no longer the interesting one. 

What's worth asking now is whether this is the start of gold's next leg toward its late January record near $5,400-$5,600, and — more importantly for this series — why it's happening.

Part I and Part II of this series argued gold's early-2026 weakness was a liquidity-stress phenomenon, not a failure of its safe-haven role — the gold-oil ratio compressing as energy-importing economies scrambled for dollars, gold sold because it remained liquid enough to fund margin calls, not because confidence in it had broken. Gold peaked above $5,500 intraday in late January, fell in a rounding top that hardened into a roughly 28% decline into late June, then based and turned. That much was covered in the earlier articles. 

What has changed is the pace and the trend—and, as the following analysis shows, the trigger. 

II. The Gold Cycle: Cyclical bear, Secular bull 

Gold's advance since the Nixon shock of August 15, 1971, has never moved in a straight line. It has progressed through a series of secular cycles, with cyclical bear markets occurring within the larger structural trend. Those corrections have varied considerably in both depth and duration.


Figure 2

The shortest cyclical bear market under a secular bullmarket was the 2008 decline, at roughly 26%, which resolved within about eight months. The deepest was the 2011–2015 decline, at roughly 48%, which lasted four years and marked the hiatus before the current cycle. February–June's roughly 28% decline over four months therefore looks much closer, in depth and duration, to the 2008 cyclical correction than to the 2011–2015 secular break. (Figure 2, topmost pane) 

Importantly, the structural forces behind the current advance have not disappeared. Central-bank de-dollarization, fiscal dominance, a geopolitical order drifting toward blocs, a deepening war economy, asset bubbles, and persistent inflation remain part of the monetary and institutional environment supporting gold. 

A liquidity-driven correction can therefore interrupt a secular advance without terminating the forces that produced it. If the current reversal holds, the February–June decline may prove to have been another cyclical bear market nested within the larger secular bull—not the end of the cycle itself. 

And if that interpretation is correct, the current advance would represent the third major leg of gold's post-Bretton Woods secular bull, following the 1970s advance and the 2001–2011 bull market. (Figure 2, middle graph) 

III. The New Plaza Accord: Intervention and Its Shrinking Half-Life 

On July 31, Japan's Ministry of Finance confirmed a coordinated yen-buying intervention with the US—the first joint action since 2011—after the yen slid toward 40-year lows near 163 to the dollar. 

The September 1985 Plaza Accord is the obvious comparison, but the history deserves care. Gold began rising in February 1985, before the Accord, and rallied roughly 50% from the Accord through November 1987—so gold did respond. (Figure 2, lowest image) 

What the Accord did not do was deliver gold's secular low. The dollar devaluation it engineered helped inflate Japan's property and stock bubble, which peaked in 1990 and produced the “lost decades,” with aftershocks plausibly extending through the 1994 Tequila crisis, the 1994 bond crisis (Great Bond Massacre), and the 1997 Asian financial crisis

Gold's actual secular bottom wasn't etched until the post-Asian-crisis, post-dot-com years around 1999–2001, symbolically marked by Gordon Brown's UK gold sales near the trough. 

The 1980–1999 gold secular bear was, in effect, the salad days of the dollar standard. 

A Plaza-style intervention can produce a real, tradeable cyclical gold rally without stabilizing the underlying system. Plaza's deeper legacy was several years of instability surfacing elsewhere, not durable currency-regime repair.


Figure 3

The yen's own history since 2022 makes the point more directly. Japanese authorities have repeatedly intervened to support the yen, yet each intervention has ultimately been followed by renewed downward pressure. (Figure 3, topmost pane) 

The pattern has been remarkably consistent: intervention produces an abrupt reversal, but the underlying trend eventually reasserts itself. 

That is the shrinking half-life in practice. The more fundamental forces driving the currency remain in place, so each intervention has to work harder to produce the same effect—and the market increasingly treats the intervention itself as evidence of the underlying imbalance. 

That caution has aged well. It took the bond market almost two weeks to fully erase the initial effect of the Fed-BoJ intervention. Then, on August 19, with 30-year Treasury yields pushing above 5.30%—the highest since 2007—the Treasury unexpectedly doubled its long-end buyback capacity, from a $2 billion to at least a $4 billion cap per operation, effective September 9. Yields fell instantly, equity futures jumped, and gold spiked. 

The Treasury's buyback program had already been operating since May 2024. The August move therefore wasn't the introduction of a new tool, but an expansion of an existing one. The important point is what happened despite that intervention: long-term yields had continued rising, suggesting diminishing returns from efforts to absorb duration and stabilize the long end. (Figure 3, middle image) 

This time the effect lasted one day! By Friday, the 30-year yield had regained the entire drop and then some, closing at 5.27%, while the 10-year sat at 4.74%—a single basis point from its pre-intervention high. 

Wolf Richter's account of the episode is worth noting for its diagnosis: the rise in long-term yields wasn't market dysfunction requiring correction, but the consequence of the government having to sell roughly $1 trillion in new debt over three months to fund the deficit, with buyers demanding compensation for inflation risk, the fiscal trajectory, and the sheer volume of paper that must clear the market every few months. Those pressures cannot be resolved by a signaling exercise from the Treasury secretary. 

Treasury Secretary Bessent himself all but conceded the point on CNBC the following morning, repeatedly describing the move as "signaling." 

Nor is Treasury the only official-sector actor absorbing government debt. The Federal Reserve's balance-sheet reduction ended in December 2025, after which it began purchasing Treasury bills and other short-term Treasuries to maintain an ample supply of reserves. Its outright Treasury holdings have subsequently been rising, reaching roughly $4.54 trillion by August 19, 2026. FRED (Figure 3, lowest visual) 

This may not be technically classified as quantitative easing (QE), but economically it represents renewed official-sector absorption of Treasury securities. And the more revealing point is what has happened alongside it: long-term Treasury yields have continued to rise. 

The implication is straightforward: despite the labeling, official-sector absorption of Treasury debt is increasing, yet it is not preventing the market from demanding higher yields on longer maturities. That is evidence of diminishing intervention effectiveness, not evidence that the underlying pressure has been resolved.


Figure 4 

And the underlying pressure is not static. The US national debt has now crossed $40 trillion, while interest costs have continued to accelerate. According to the figures cited by ZeroHedge, interest expense had already reached roughly $1.37 trillion in 2026, about 20% above the comparable period a year earlier. (Figure 4, topmost and middle images) 

This is where intervention encounters a structural problem. Deficit spending creates the borrowing requirement; rising yields increase the cost of servicing that borrowing; and higher interest costs, in turn, enlarge the deficit and require still more borrowing. The market is therefore confronting a moving target: official-sector intervention may temporarily absorb Treasury supply or suppress yields, but the fiscal requirement generating that supply continues to expand. 

The effectiveness of intervention consequently diminishes as the underlying imbalance grows. What might once have been sufficient to stabilize the market becomes progressively less effective when the volume of debt, the interest burden, and the compensation demanded by investors are all rising together. 

Two interventions in three weeks have produced only temporary relief, while the fiscal, currency, and bond-market pressures behind them have quickly reasserted themselves. That is the more important signal for gold. Yields of 10 and 30 year treasuries were at milestone highs (Figure 4, lowest diagram)


Figure 5 

Japanese Government Bons (JGB) yields tell a similar story. 

They remain below their immediate pre-intervention spike, but have begun climbing again, touching a fresh three-decade high near 2.94% on August 18 before easing only slightly. Figure 5, topmost image) 

The same pattern is emerging in Japan: intervention can alter market prices temporarily, but it does not remove the underlying pressure on the currency and sovereign bond market. 

IV. Deepening Interventions Becomes Gold's Catalyst 

For gold, however, the significance is different. 

Gold had already been trading around and holding the $4,000 level from late June through early August. 

First, the Fed-BoJ intervention provided the catalyst for the first lift-off from that base, reinforcing $4,000 as the floor. 

Then, Bessent's Treasury backstop came afterward, adding fuel to an advance that was already underway. 

The initial decline in long-term yields quickly disappeared, but gold retained its momentum

The result was the sequence described at the beginning of this piece: gold broke its 200-day moving average at $4,501, moved above $4,600, surpassed the 38.2% retracement of its March decline, and confirmed the rounding-bottom pattern that had been forming since June. 

The significance therefore goes beyond the failure of either intervention to suppress yields. The interventions themselves are becoming part of the mechanism driving gold higher. Attempts to contain currency and bond-market pressures are adding to the monetary and financial imbalances that gold is increasingly pricing. 

This is where the comparison with the Plaza Accord becomes more interesting. The 1985 agreement did not simply weaken the dollar; it set in motion adjustments that eventually surfaced elsewhere in the financial system. 

Today's bilateral intervention comes against a far more leveraged fiscal and monetary backdrop, with sovereign debt, currency instability, and official-sector intervention increasingly interacting with one another. 

If history rhymes, the contemporary bilateral Plaza Accord may mean more than a break of the recent high—it may mark the beginning of sharply higher gold prices

V. When Former Headwinds Become Tailwinds 

WTI crude was up roughly 5% this week, back above $86, as the US-Iran standoff over the Strait of Hormuz shows no sign of resolving and Washington prepares tighter sanctions. (Figure 5, middle graph) 

That is worth pausing on because oil-driven dollar demand was the mechanism Part I and Part II identified as suppressing gold earlier this year: energy importers scrambled for dollars, and gold was sold for liquidity even as the safe-haven case strengthened. 

The same forces are now coinciding with gold's advance rather than working against it. 

That is not a contradiction. It means the liquidity-stress channel has been overtaken by the larger fiscal-currency-risk channel this piece has been tracking. The same energy shock that once forced gold sales for dollar liquidity is now compounding, rather than competing with, the debt and currency concerns driving the bid for gold. 

There is another important change in the relationship between gold and Treasury yields. Earlier in the year, rising 30-year Treasury yields appeared to place a ceiling on gold's advance. Now the relationship appears to be changing: gold is rising even as the 30-year yield pushes above the level at which the Treasury's intervention sought to stabilize it. 

The market is therefore no longer responding to higher yields simply as an opportunity cost for holding gold. It is increasingly interpreting those yields as evidence of the fiscal and currency pressures that make gold more attractive in the first place. 

It is also worth noting that rising gold prices and rising 10-year Treasury yields have historically coexisted during the stagflationary periods of the 1970s. (Figure 5, lowest chart) 

The parallel with today is not exact—the degree of systemic leverage is vastly different—but the coexistence of rising nominal yields and rising gold is not unprecedented when inflation, fiscal pressure, and confidence in the monetary regime become dominant forces

VI. Risk-Off, Inflationary, and Fiscal Signals Converge 

Gold's rise also came as risk appetite weakened. The S&P 500 fell about 1.4% on the week, its first weekly decline in a month, dragged by a rough five days for technology; the Nasdaq lost roughly 2%. That gives this week's move a stronger risk-off component: equities fell while gold rose. 

But it was not a conventional flight to safety. Oil was rising, long-term Treasury yields were rising, and gold was rising with them. Growth concerns and inflation/fiscal concerns were therefore appearing simultaneously: stocks were pricing weaker risk appetite, while oil and bond yields were pricing inflation, supply, and fiscal pressures. 

That combination is arguably more important for gold than a conventional risk-off episode. Gold was not merely benefiting from falling risk assets; it was responding to the same underlying deterioration that was simultaneously pushing up oil and long-term yields. 

Curiously, Bitcoin also surged more than 22% during the week, briefly moving above $77,000, reflecting both renewed risk appetite in the crypto market and, potentially, a safe-haven bid amid concerns over currencies and the monetary system. Short covering amplified the move. 

Taken together, the week's price action looks less like a simple flight to safety than a convergence of risk-off, inflationary, and fiscal signals—and gold is increasingly responding to all three. 

VII. Central Banks as Dip Buyers, and the Fund-Flow Tailwind


Figure 6

Central banks were buying into the selloff. The World Gold Council's Q2 2026 data showed central banks adding 102 tonnes of gold during the quarter, even as gold prices fell roughly 16%. (Figure 6, upper diagram) 

As of the first half of 2026, Poland remained the largest reported buyer at 82 tonnes, followed by Uzbekistan at 41 tonnes, China at 40 tonnes, and Kazakhstan at 27 tonnes. World Gold Council: Central Bank Gold Statistics, June 2026 (Figure 6, lower graph) 

The significance is not the absolute volume, but the direction of demand during the correction. While more price-sensitive and leveraged holders were liquidating, official-sector demand was increasing. Central banks were therefore absorbing part of the supply released by the selloff, providing an important counterweight to the liquidation pressure that drove gold lower. 

The longer-term demand signal remains equally important. The World Gold Council's survey found that 89% of reserve managers expect official gold holdings to increase over the next 12 months. That suggests the buying is not simply a reaction to short-term price movements, but part of a broader shift in reserve preferences.


Figure 7

Fund flows provide a second layer of support. Gold held the $4,000 area for close to two months as renewed ETF inflows emerged, while the two previous stretches of stronger fund flows—roughly August–October 2025 and November–February 2026—preceded significant advances, including the run into January's record. (Figure 7, upper image) 

The pattern does not mean ETF flows mechanically determine prices, but it does show that renewed investment demand has tended to accompany—and at times precede—the next major leg higher.  

Independent ETF data reinforce the change in direction: global gold ETFs returned to inflows in July after May–June redemptions had flushed out leveraged positions, with flows continuing into August. The important development is therefore not simply the amount of money flowing into gold, but the transition from forced liquidation to renewed accumulation

India's Dhanteras and Diwali season could provide an additional, though more modest, seasonal catalyst into year-end, alongside whatever short covering remains from a positioning backdrop that has been reduced but does not appear fully washed out. (Figure 7, lower visual) 

The ownership dynamics are therefore changing. Central banks were accumulating while weaker and more leveraged holders were liquidating; as that selling pressure subsided, ETF flows turned positive. The correction consequently did not destroy the underlying demand structure. Instead, it transferred gold from more price-sensitive holders toward buyers with a stronger strategic (non-price sensitive) incentive to own it. 

That matters for the next leg. The same selloff that removed speculative excess also created the conditions for a stronger base: official buyers absorbed supply, leveraged positions were reduced, and investment flows are now returning as gold moves higher. 

VIII. Bottom line: Gold Is Pricing the Limits of Intervention 

The question this piece opened with has effectively been answered by the market: gold has bottomed. What deserves scrutiny now is why, because the explanation is not the conventional one. 

Two interventions in three weeks—one in currencies, one in the bond market—have produced only temporary effects in the markets they were intended to stabilize. Yet their significance for gold has been the opposite. 

The Fed-BoJ intervention provided the catalyst for gold's first lift-off from the $4,000 base; Bessent's Treasury backstop then added fuel to an advance already underway. The interventions did not extinguish the underlying pressures. They exposed them—and, in doing so, reinforced the forces driving gold higher. 

The same energy shock that once forced gold into liquidity sales is now moving with gold rather than against it. This week's equity sell-off adds another layer: stocks fell while gold, oil, and long-term yields rose together. That is not a simple flight-to-safety trade. It is a combination of risk-off, inflationary, and fiscal signals—a more distinctly stagflationary configuration. 

The next leg will not necessarily be linear. $4,600 now needs to establish itself as support rather than prove to have been a temporary spike, while a sustained break below $4,300 would materially weaken the bullish structure. But the more important question is no longer technical. 

Gold is increasingly pricing the widening gap between what governments can credibly promise about their currencies and debt markets and what they can actually deliver. The interventions are themselves becoming part of that price signal: each attempt to contain currency or bond-market pressure produces a temporary market response, while the underlying imbalance quickly reasserts itself. 

And that is ultimately what makes this leg different from the earlier stages of the cycle. Gold is no longer simply rising because investors fear what might happen. It is rising because the market is beginning to price what governments are already doing—and the diminishing effectiveness of their attempts to contain the consequences. 

____

References

-Why Isn’t Gold Acting Like a Safe Haven—Yet? The Gold–Oil Ratio and the Liquidity Stress Behind Early-Crisis Gold Weakness (Part II)—April 5, 2026 

-Why Isn’t Gold Acting Like a Safe Haven—Yet? War, Liquidity Stress, and the Fracturing of the Bullion System (Part I) March 22, 2026


Sunday, April 27, 2025

April 7: The Day Global Risk Assets Bottomed: A Synchronized Reversal Across Stocks, Crypto, and Commodities


The conventional view serves to protect us from the painful job of thinking—John Kenneth Galbraith 

April 7: The Day Global Risk Assets Bottomed: A Synchronized Reversal Across Stocks, Crypto, and Commodities 

Following the April 7-8 lows, a synchronized rally swept across US, Asian or global stocks, commodities, and Bitcoin. Forget domestic interventions—this was a liquidity-driven comeback, sparked by global catalysts and market dynamics. 

I. Introduction 

On April 7-8, 2025, global markets teetered on the edge: Hong Kong’s Hang Seng cratered 13%, U.S. stocks wobbled, copper plunged 8%, and Bitcoin hit a yearly low. Fear ruled, with the VIX spiking to 46.98. 

Then, everything reversed course and headed higher through the next few weeks. 

From Tokyo to New York, stocks soared. Gold, oil, copper, and even Bitcoin joined the party. 

What sparked this global comeback? 

It wasn’t Chinese state buying or local policies. It was a liquidity tsunami, fueled by a massive global short-covering and capital rushing back to oversold assets. 

II. The Panic and the Spark


Figure 1

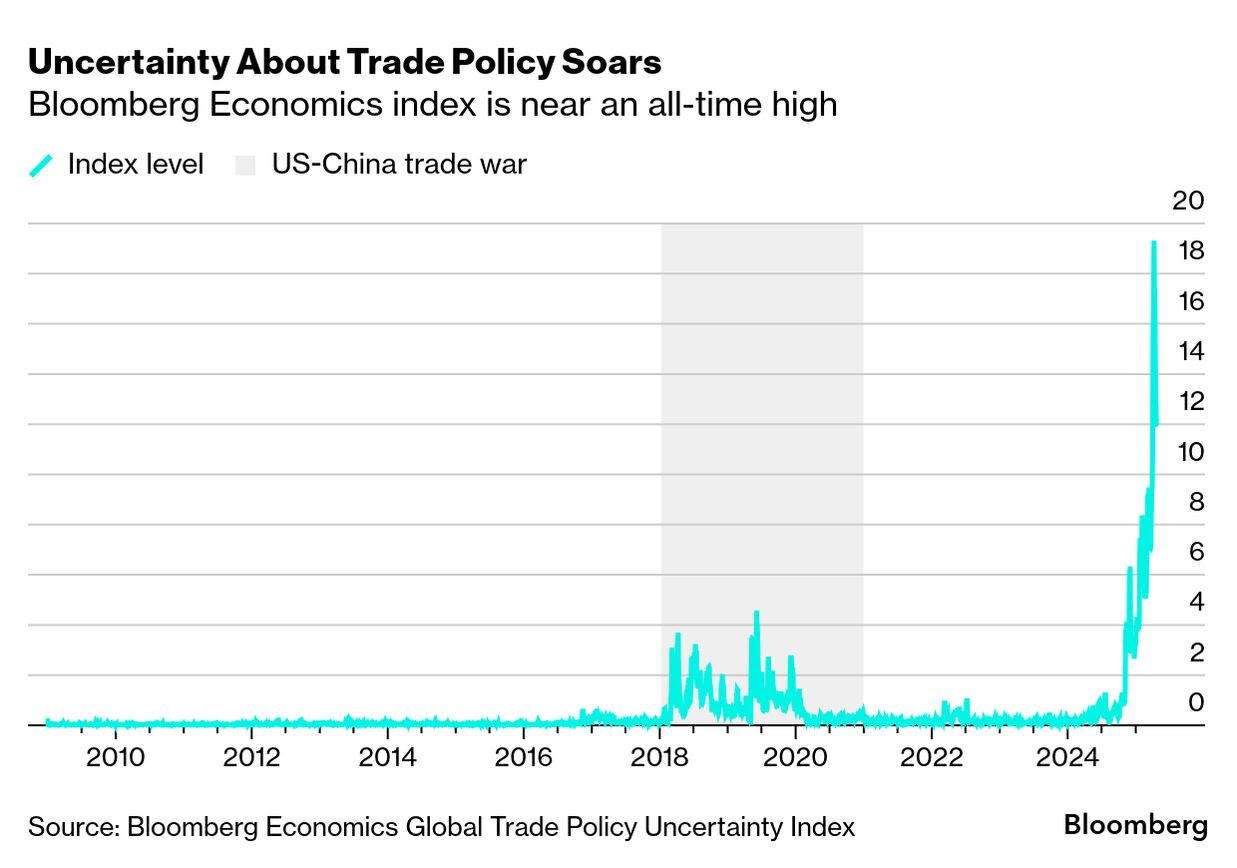
Concerns over the festering trade war, all-time high uncertainties, mounting geopolitical tensions in the face of a weakening global economy, and high systemic leverage put pressure on risk assets.   

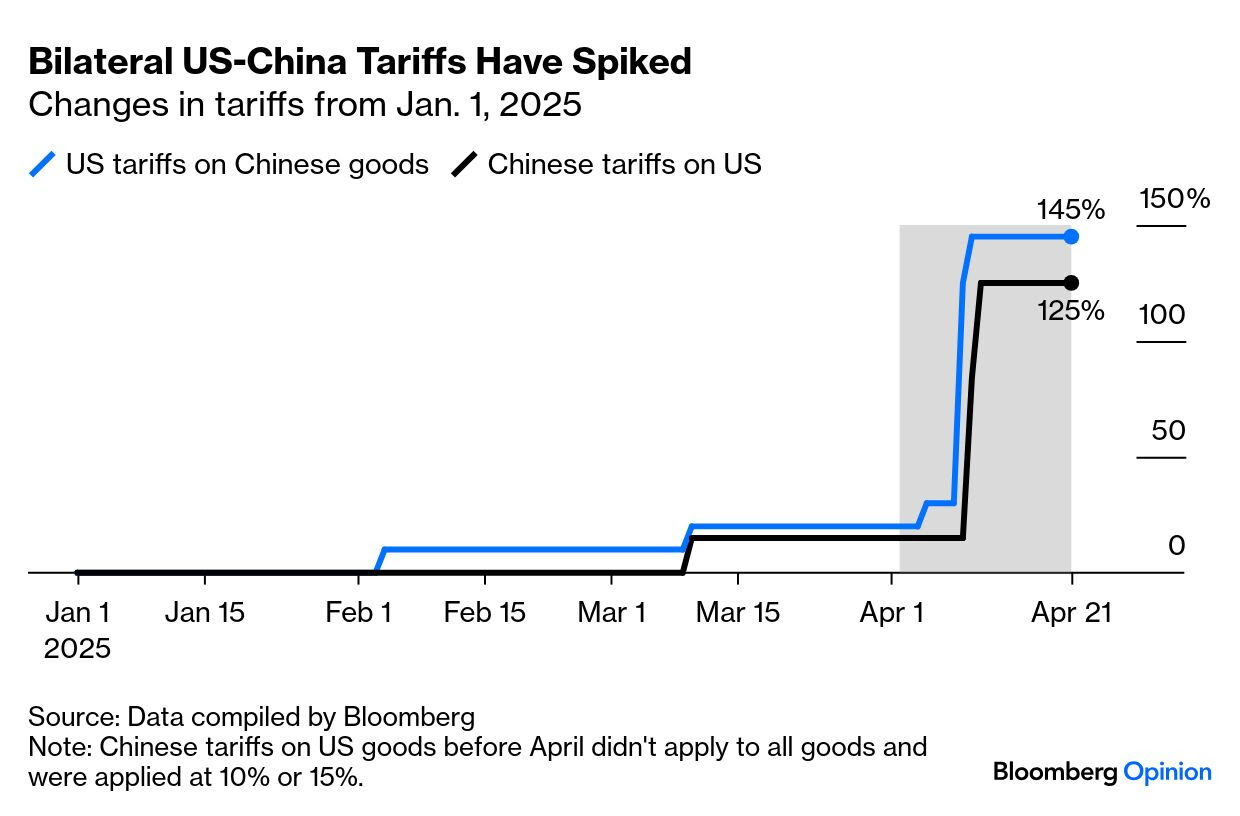
In charts, US-China bilateral tariffs soared in April.  (Figure 1)


Figure 2

The world’s government debt-to-GDP ratio remains high and is expected to rise further. (Figure 2, upper diagram) 

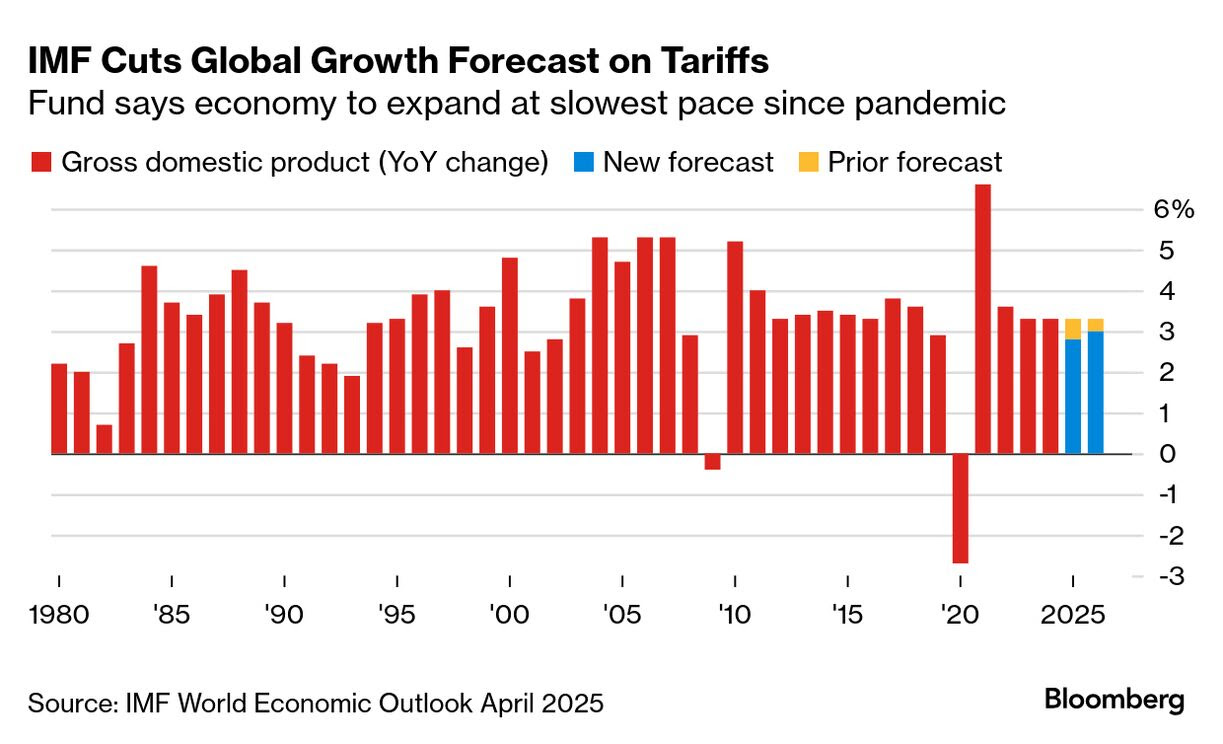
The IMF slashed its global GDP forecast from 3.3% to 2.8% in 2025 (Figure 2, lower image) 

Deflating prices, deleveraging, and liquidity tightening led to a risk aversion in global stocks, which culminated in April 7’s brutal selloffs. 

The Chinese yuan fell, or the US dollar-yuan USDCNY spiked, driven by China’s retaliatory tariffs. 

But late on April 7, rumors of a 90-day U.S. tariff pause (excluding China) surfaced, sparking a wild U.S. market swing (S&P 500 from -4.7% to +3.4%). 

Though denied, these rumors set the stage for April 8. 

III. April 8 Onwards: A Liquidity-Fueled Macro Short-Covering Rally 

On April 8, the selloff in some of the global markets had eased, and some had started a sharp recovery. 

Liquidity—fueled by institutional buying, short covering, and algorithmic trading—revived risk-ON sentiment.


Figure 3 

From the April 7-8 lows, the S&P Global Equity Index rebounded 11.2%, the US S&P 11.02%, and the Euro Stoxx 600 10.8% as of April 25th. (Figure 3, topmost pane) 

In Asia, China’s Shanghai Composite rallied 6.6%, while Hong Kong’s Hang Seng 50 surged 9.9%. (Figure 3, middle graph) 

Meanwhile, Southeast Asian bourses staged a massive recoil. Indonesia’s JCI surged 12.7%, Thailand’s SET 9.33%, and the Philippine PSEi 30 8.74%, over the same period. (Figure 3, lowest chart)


Figure 4

Strikingly, USD gold prices soared 12.1%, copper 20.2%, WTI crude 6.9%, and Brent crude 7.5% (Figure 4, upper window) 

The CRB Commodity Index advanced by 7.2%, while Bitcoin roared 28%. (Figure 4, lower visual) 

Risk-ON was suddenly back! 

The USDCNY spike U-turned and plunged, with China’s central bank selling dollars to slow the yuan’s fall, but this was secondary. (Figure 4, lower graph) 

I called this on my X.com post, "A macro short-covering rally." 

IV. Extreme Oversold Conditions 


Figure 5

The VIX nearly hitting 50 was a sign of extreme oversold conditions. Historically, this has proved to be a turning point. (Figure 5, upper chart) 

While past performance doesn’t guarantee future results, one thing is clear: liquidity re-emerged following oversold conditions, and the VIX metric may have been somehow validated. 

V. Why Liquidity, Not Local Policies 

Chinese state buying, PBOC intervention, and the BOJ’s yen-defense rhetoric were possibly too small to reinvigorate the world’s risk appetite. 

Yet, the rally’s timing, scale, and breadth—spanning stocks, commodities, crypto, and the yuan—points to a global liquidity flood, driven by tariff relief hopes, the Fed’s dovish narrative, and oversold conditions. 

VI. Takeaways: A Fragile Rally in a Fractured World 

Trump’s arbitrary and capricious policies (Tariffs or not) should sustain an ambiance of "regime uncertainty," which clouds economic calculation for the global economy. 

This is aside from geopolitical (e.g., latest India-Pakistan clash over Kashmir, the ongoing Israel-Palestine War, Russia-Ukraine War, US/Israel-Houthi War, frictions at South China Sea and Taiwan, et al.) and geoeconomic (US-China trade war) tensions. 

Trump’s backsliding against China has prompted Chinese media to make a mockery of his policies, which in the coming days could test his mercurial temperament. Rising markets may reanimate his belligerent trade and foreign policy stance. 

With Return on Investment (RoI) and "hurdle rates" indeterminate, investments will likely stall.  The financial world will likely chase short-term gains via the financial markets, which likely implies heightened volatility in the days to come. 

Easily, this ties to bear market rallies in stocks, which are often sharp and swift but fleeting. 

Furthermore, for a financial world increasingly dependent on central bank easy-money bailouts, mounting de-globalization dynamics, rising geopolitical and geoeconomic uncertainties, increasing risks of economic discoordination and disruptions, increasing leverage, volatile liquidity conditions, and escalating risks of stagflation will likely inhibit central banks from their traditional approach—all of which may reduce the likelihood of fuel for a financial market "blowoff." 

Lastly, aside from gold, central banks and governments have lately been amassing Treasury Bills—a sign of a stampede for liquidity. The last time they hit this high was during the Great Recession (2007-2009). They surpassed the highs during the 2020 pandemic recession. (Figure 5, lower chart) 

All told, all-time high gold prices plus the second-highest official inflows to Treasury bills are likely signs of a coming global recession or a financial crisis.


Sunday, January 12, 2025

Philippines December 2024 CPI: A Possible Turning Point for the Third Wave of the Current Inflation Cycle?


The second mischief is that those engaged in futile and hopeless attempts to fight the inevitable consequences of inflation — the rise in prices — are disguising their endeavors as a fight against inflation. While merely fighting symptoms, they pretend to fight the root causes of the evil. Because they do not comprehend the causal relation between the increase in the quantity of money on the one hand and the rise in prices on the other, they practically make things worse—Ludwig von Mises 

In this issue

Philippines December 2024 CPI: A Possible Turning Point for the Third Wave of the Current Inflation Cycle?

I. A Closer Look at the Flawed Foundations of the CPI

II. Does December’s CPI Mark the Turning Point for the Third Wave of the Current Inflation Cycle?

III. A Brief Look at Inflation Era 1.0; Key Questions

IV. Divergent Sentiments: Government Data vs. SWS 21-Year High in Self-Rated Poverty

V. Demand Side Inflation: Record 11-Month Public Spending 

VI. More Demand Side Inflation: BSP’s Easing Cycle Designed to Rescue the Struggling Real Estate Sector and the Banking System

VII. Demand-Side Inflation: The Impact of the USD-PHP Soft Peg and Rising US Treasury Bond Yields

VIII. Conclusion: Strengthening Signs of an Emergent Third Inflation Wave

Philippines December 2024 CPI: A Possible Turning Point for the Third Wave of the Current Inflation Cycle?

A sharp increase in liquidity conditions last November, driven by BSP measures and bank activities, has likely spilled over into prices. Could December’s CPI signal the start of a third wave in the current inflation cycle?

I. A Closer Look at the Flawed Foundations of the CPI

Before we proceed with our exegesis of the Philippine Consumer Price Index (CPI) from last December, it is essential to clarify our position, which diverges from the mainstream acceptance of the inflation benchmark.

We argue that the CPI is structurally flawed for the following reasons:

1. Subjective Nature of Personal Utilities

Because people engage in exchanges to improve their well-being, prices reflect the subjective evaluations of individual economic participants.

As such, comparing personal utilities is inherently impossible because they are subjectively determined, depending on the specific circumstances of an individual, including their operating environment, preferences, values, and hierarchy of needs.

As we explained in 2022 (bold original):

Yet, the thing is, the most substantial argument against the CPI comes from its essence: it is impossible to quantify or average the spending activities of individuals. Everyone has different 'inflation.' The consumption basket varies from one individual to another. And the composition of an individual's consumption basket is never static or constant because it is subjectively determined; it is dynamic or consistently changes. 

Therefore, because the assumption used to generate an estimated CPI is fallacious, the CPI is structurally flawed. (Prudent Investor 2022) 

2. CPI as a Political Statistic 

The CPI is not merely an economic measure; it is, arguably, the most significant political statistic.  

From the Philippine Statistics Authority (FAQ): CPI allows individuals, businesses, and policymakers to understand inflation trends, make economic decisions, and adjust financial plans accordingly. The CPI is also used to adjust other economic series for price changes. For example, CPI components are used as deflators for most personal consumption expenditures in the calculation of the gross domestic product.  Moreover, it serves as a basis to adjust the wages in labor management contracts, as well as pensions and retirement benefits. Increases in wages through collective bargaining agreements use the CPI as one of their bases.

In this context, the political objectives of the administration may influence the calculation of economic indicators, rather than reflecting actual estimates. 

For example, the Consumer Price Index (CPI) plays a significant role in determining bond market rates and interest rates. By understating the CPI, the government can effectively engage in "financial repression," which entails the implicit and artificial lowering of interest rates to subsidize government debt.  

Moreover, beyond facilitating government borrowing, an artificially suppressed CPI also inflates GDP figures, creating a perception of stronger economic performance. 

The periodic (six-year) base year adjustments used for calculating the CPI—intended to reflect the most current composition of goods and services—are inherently biased toward reducing inflation rates. Consequently, CPI figures would likely be higher if calculated using the previous base year of 2006 compared to the current base year of 2018. 

3. The CPI Data and Official Narrative on Inflation 

CPI data and the official narrative often portray inflation as an inherently supply-side-driven phenomenon. 

The sectoral composition of the CPI baskets appears biased, fostering the perception that price increases (inflation) are predominantly caused by supply-side factors. This perspective is consistently reinforced by official explanations, which highlight supply disruptions as the primary drivers of inflation. 

Ironically, however, the Bangko Sentral ng Pilipinas (BSP)’s policy responses have been predominantly demand-side in nature. These responses include interest rate adjustments, reserve requirement ratio (RRR) changes, and regulatory relief measures such as the credit card interest rate cap, as well as quantitative easing or liquidity injections. On rare occasions, political interventions, like the Rice Tariffication Law, address supply-side issues directly. 

In reality, if prices were allowed to function freely, supply-side imbalances would typically resolve themselves in the short term. 

Moreover, with a fixed money supply, an increase in demand for specific goods or services, leading to higher prices, would naturally result in reduced demand for other goods or services, causing their prices to decline. This dynamic reflects changes in relative prices (increases and decreases), which do not equate to a general rise in overall price levels. For example, households operating within fixed budgets and without access to credit exemplify this principle. 

However, when prices for most goods and services rise simultaneously, it indicates a condition of "too much money chasing too few goods." In other words, a generalized price increase arises when the growth of money supply (via credit expansion) outpaces the growth in goods and services. 

In the immortal words of Nobel Laureate Milton Friedman in an interview: (bold mine) 

It [Inflation] is always and everywhere, a monetary phenomenon. It's always and everywhere, a result of too much money, of a more rapid increase in the quantity of money than an output…

If you listen to people in Washington and talk, they will tell you that inflation is produced by greedy businessmen or it's produced by grasping unions or it's produced by spendthrift consumers, or maybe, it's those terrible Arab Sheikhs who are producing it. Now, of course, businessmen are greedy. Who of us isn't? Trade unions are grasping. Who of us isn't? And there's no doubt that the consumer is a spendthrift. At least every man knows that about his wife. 

But none of them produce inflation for the very simple reason that neither the businessman, nor the trade union, nor the housewife has a printing press in their basement on which they can turn out those green pieces of paper we call money. (Friedman, Heritage Foundation)

This underscores the reality that inflation is driven by excessive monetary expansion rather than purely supply-side factors.

Figure 1

Aside from this author, has anyone pointed out the deepening reliance of GDP on money supply growth? (Figure 1, topmost graph)

4. The CPI as a Tool for Narrative Control

The BSP and the government’s approach to inflation management often involves shaping public perception through strategic "narrative control." A clear example of this is the establishment’s "pin-the-tail-on-the-donkey" CPI forecasting exercise:

-At the close of each month, the BSP releases a forecast range for the monthly inflation rate, usually spanning a margin of approximately 80 basis points.

-"Establishment experts" then publish their single-point predictions, which the media aggregates into a "median estimate."

-When the Philippine Statistics Authority (PSA) announces the official inflation rate, it almost always falls within the BSP’s forecast range—except during anomalous periods, such as the CPI spikes in 2022-2023.

This practice reinforces the establishment narrative and helps frame the public’s understanding of inflation within a constrained Overton Window, limiting alternative interpretations of its causes and dynamics.

As I elaborated in 2024 (bold and italics original): 

In essence, they blame the supply side for inflation, but use demand-side instruments to manage it. This disconnect is often lost on the lay public, who are unfamiliar with the technical details surrounding the mechanics of inflation

The general idea is that distortions from the supply side are seen as representing market failure, namely greed, and that the BSP is considered immaculate, foolproof, and practices Bentham's utilitarianism (for the greater good) when it comes to its demand-side policies. Therefore, it would be easier to sell more interventions when the authorities are perceived as saints.  

Ironically, the BSP has been advocating for the "trickle-down theory" in its policies: subsidize demand while controlling or restricting supply (Kling,2016) 

More importantly, the public is unaware of the entrenched "principal agent syndrome" in action: the BSP regulates these mainstream institutions. As such, the BSP indirectly controls the narratives or dissemination of information on inflation.   

Make no mistake: the structural flaws of the CPI arise not only from a critical economic perspective but, more significantly, from a political dimension designed to shift the blame for price instability onto the market economy.  

II. Does December’s CPI Mark the Turning Point for the Third Wave of the Current Inflation Cycle?

Our dialectic of the CPI’s critical flaws serves as the foundation for examining December’s CPI data. 

Let us explore the issue from the perspective of the mainstream viewpoint.

Reuters, January 7: Philippine annual inflation quickened for a third straight month in December due to the faster pace of increases in food and utility costs, the statistics agency said on Tuesday. The consumer price index (CPI) rose 2.9% in December, higher than the 2.6% forecast in a Reuters poll, and was above the previous month's 2.5% rate. December's inflation print brought average inflation in 2024 to 3.2%, well within the central bank's 2%-4% target for the year, marking the first time since 2021 that the Philippines has achieved its inflation goal. 

Though December marked the third consecutive monthly YoY increase, boosting the month-on-month (MoM) change, the upward momentum has not been strong enough to signal a decisive breakout from its year-on-year (YoY) downtrend. (Figure 1, middle image) 

Typically, a MoM rate exceeding 1% is required to achieve this. 

However, while food prices continue to play a significant role in driving up the headline CPI, their influence has been diminishing. This shift indicates broader sectoral contributions, primarily driven by housing, utilities, and transport in December. (Figure 1, lowest diagram)

Figure 2

The uptrend has been most pronounced in the transport sector, while momentum in housing and utilities has recently gained strength. (Figure 2, topmost chart)

The broadening increase in prices has also led to an expansion in the non-food and energy CORE CPI. Both the CORE and headline CPI appear to have made a turn reminiscent of patterns seen in 2015 and 2022. (Figure 2, middle pane) 

If this momentum persists, the headline CPI may be transitioning into the third wave of the current inflation cycle, which has now entered its tenth year.

III. A Brief Look at Inflation Era 1.0; Key Questions

Should the third wave, characterized by the current series of increases, be confirmed, the headline CPI is likely to surpass its 2022 high of 8.7%. 

This inflation cycle is not an anomaly; it mirrors historical precedent, specifically the secular inflation era (1.0), which spanned three inflation cycles from 1958 to 1986. (Figure 2, lowest graph) 

This brings us to several critical questions:

>How do supply-side (cost-push) factors contribute to driving an inflation cycle or even a prolonged era of inflation?

>Does the current inflation cycle mark the beginning of an "Inflation Era 2.0"?

>Which mainstream experts have anticipated and explained this phenomenon?

IV. Divergent Sentiments: Government Data vs. SWS 21-Year High in Self-Rated Poverty

A striking contrast exists between the government's data on the bottom 30% of income earners and the Social Weather Stations (SWS) self-rated poverty survey.


Figure 3

The Consumer Price Index (CPI) for the bottom 30% income group presents one of the most fascinating – and somewhat contradictory – data points in CPI coverage. (Figure 3, topmost window) 

It indicates that the food CPI for this income group has decreased at a faster rate than the overall headline CPI, resulting in a negative spread for the first time since at least 2022. This suggests that the bottom 30% has benefited from easing food inflation, ostensibly leading to ‘reduced inequality.’ 

This assumption appears to be based on the notion that stores have provided price discounts to this income group or that conditions have improved due to assistance from food banks

Conversely, a private poll reported that instances of self-rated poverty surged to their highest level since 2003, reaching a 21-year high

SWS Report, January 8 2025: The December 2024 percentage of Self-Rated Poor families of 63% was 4 points up from 59% in September 2024, rising steadily for the third consecutive quarter since the significant 12-point rise from 46% in March 2024 to 58% in June 2024. This was the highest percentage of Self-Rated Poor families in 21 years, since 64% in November 2003. (Figure 3, middle visual) 

If this poll is accurate, it implies that a vast majority of households continue to suffer from the erosion of the peso’s purchasing power. 

The recent decline in the CPI rate, far from indicating relief, might instead signify a “boiling frog syndrome”—a slow, almost imperceptible build-up of economic hardship. This is evidenced by deteriorating consumption patterns and increasing pessimism, despite near-record employment rates. 

In November 2024, employment rates reached their third-highest level, continuing a trend of near-full employment since Q4 2023. (Figure 3, lowest chart) 

Still, despite this robust employment dynamic, inflation has continued to decline. 

Does this mismatch between self-rated poverty levels and employment gains highlight productivity improvements that are not reflected in wage and income growth?  

Alternatively, could this gap reflect potential manipulation or "padding" of labor data for political purposes ahead of upcoming elections? 

As I noted back in October 2024: (bold and italics original) 

All these factors point to the SWS Q3 data indicating an increase in self-rated poverty, which not only highlights the decline in living standards for a significant majority of families but also emphasizes the widening gap between the haves and the have-nots.  

As a caveat, survey-based statistics are vulnerable to errors and biases; the SWS is no exception. 

Though the proclivity to massage data for political goals is higher for the government, we can’t discount its influence on private sector pollsters either. 

In any case, we suspect that a phone call from the office of the political higher-ups may compel conflicting surveys to align as one. 

Apparently, that phone call to influence the self-rated poverty survey has yet to occur. 

Furthermore, the multi-year high in self-rated poverty could also be symptomatic of government policies involving "financial repression" or an "inflation tax," which redistributes finances and resources from the private sector to the government to subsidize its political spending.

This raises an important question: Whose sentiment truly reflects the public's conditions?  

On one hand, government data suggests a vague improvement for low-income households due to easing food prices.  On the other hand, SWS data indicates a historic rise in self-rated poverty.  

The divergence between these two perspectives underscores the complex economic realities faced by different segments of society as they confront inflation.

V. Demand Side Inflation: Record 11-Month Public Spending

Let us now shift our focus to the demand side of the inflation cycle.


Figure 4

The first and most significant demand-side driver of inflation cycles is public debt-fueled deficit spending. (Figure 4, topmost image)

Thanks to robust tax collections, the 11-month fiscal deficit has fallen to its lowest level since 2020, despite reaching a historic high in public spending over the same period. 

However, while current tax revenues have supported fiscal health, they are subject to the variability of economic conditions and the efficiency of tax administration, whereas government spending is determined by Congressional appropriations. 

Still, diminishing returns and the crowding-out effect could slow GDP growth—or even trigger a recession—leading to reduced tax revenues. This could drive deficits back to record-high levels. 

In any case, public spending at an all-time high inevitably fosters heightened competition with the private sector for resources and financing. This competition—the crowding out syndrome—serves political objectives but disrupts economic allocation, production, and pricing. 

The Philippine budget is set to grow by 9.7% to Php 6.326 trillion in 2025, reinforcing its long-term upward trend in public expenditures. 

Unsurprisingly, this accelerating trend in public spending has closely correlated with the first inflation cycle. 

Also, this is in seeming response to the Q3 2024 GDP slowdown and a deflationary spiral in real estate prices, 'Marcos-nomics' stimulus measures have only intensified. 

That’s in addition to the administration’s positioning for this year’s elections.

VI. More Demand Side Inflation: BSP’s Easing Cycle Designed to Rescue the Struggling Real Estate Sector and the Banking System 

Despite the CPI gradually rising, the BSP cut interest rates twice in Q4 2024, supported by a significant reduction in the bank’s reserve requirements

When similar measures were implemented during the pre-pandemic and pandemic phases (2018–2020), they fueled the first leg of the second wave of the inflation cycle. Is history repeating itself? (Figure 4, middle diagram)

After an 11-month plateau, the banking system’s net claims on the central government (NCoCG) surged to a record-high Php 5.31 trillion in November 2024! (Figure 4, lowest window) 

Banks may have responded to an implicit directive from the BSP, which has contributed to the growth of the money supply. 

Additionally, the BSP’s ‘easing cycle’ prompted a surge in bank lending, particularly to the struggling real estate sector and consumers.

Universal-commercial (UC) bank lending grew by 11.34% in November, driven largely by a 10.11% increase in lending to the real estate sector, which reached a record-high Php 2.57 trillion. 

Meanwhile, UC consumer bank lending (excluding real estate) jumped 23.3% to a historic Php 1.54 trillion.


Figure 5

Overall, systemic leverage—defined as UC bank loans plus public debt—expanded by 11.1%, reaching an all-time high of Php 28.44 trillion.  (Figure 5, topmost chart) 

This growth drove a sharp increase in M3 money supply, from 5.43% in October to 7.7% in November. 

Despite BSP claims of ‘restrictive’ financial conditions, growth rates of systemic leverage have been rising steadily since its trough in September 2023. 

The BSP’s easing measures in the second half of 2024 have undoubtedly contributed to this systemic expansion in leverage. 

The combination of liquidity injections through NCoCG and surging systemic leverage has also driven growth in M1 money supply, which again rose 7.7% in November—reaching levels seen in October 2023. 

If history offers any guidance, reminiscent of 2014 and 2019, the current surge in cash circulation—which accounted for 30.83% of November’s M1—has likely contributed to the broadening increase in non-food and non-energy core inflation, supporting the notion that the headline and core CPI have already bottomed out. (Figure 5, middle graph) 

Notably, M1’s influence on price pressures occurs with a time lag. This means that certain price increases, due to increased spending in sectors benefiting most from credit expansion—such as real estate and their principal lenders, the banks—eventually percolates into the broader economy. 

This clearly reflects the BSP’s implicit backstop for the real estate sector and its key counterparties—the banking system. 

VII. Demand-Side Inflation: The Impact of the USD-PHP Soft Peg and Rising US Treasury Bond Yields 

Another factor that appears to be providing a behind-the-scenes support to inflation is the BSP’s US dollar Philippine peso USDPHP exchange rate cap. 

As we previously noted,

Widening Trade Deficit: First, the cap widens the trade deficit by making imports appear cheaper and exports more expensive. An artificial ceiling exacerbates imbalances stemming from the historical credit-financed savings-investment gap. (Prudent Investor, 2024)

Although November’s trade deficit narrowed to USD 4.77 billion due to a 4.93% decline in imports and an 8.7% slump in exports, it remains within the record levels seen in 2022. (Figure 5 lowest window)


Figure 6

The risk of a sudden devaluation grows as the persistent trade deficits erode the BSP's ability to defend the USDPHP ceiling magnifying inflation risks. (Figure 6, topmost diagram) 

Additionally, the recent shift in the Philippine treasury yield curve—from a flattening, belly-inverted slope to a steepening curve driven by surging bond rates—has further underscored this vulnerability. (Figure 6, middle image) 

Besides, rising yields on US Treasury bonds could influence upward pressure on Philippine rates. (Figure 6, lowest chart) 

US inflation can indirectly impact the Philippines through global trade, commodity prices, and capital flows.  For example, rising US inflation may lead to higher prices for imported goods, thus contributing to increased inflation domestically in the Philippines. 

Additionally, US Treasury yields act as a global benchmark for interest rates. When US yields rise, typically due to higher inflation expectations or tightening monetary policy by the Federal Reserve, it can exert upward pressure on bond yields in other countries, including the Philippines. 

This dynamic occurs as foreign investors may seek higher returns, which in turn can push up domestic yields. The influence of rising US bond rates on Philippine yields underscores the interconnectedness of global financial markets and reflects the broader impact of US economic conditions on emerging market economies. 

Furthermore, if the BSP insists on continuing its ‘easing cycle’ under such conditions, it risks stoking the embers of inflation, which could further weaken the USD-Philippine peso exchange rate. 

Sure, while it’s true that the structural economic conditions of the Inflation Era 1.0 differ from today’s—marked by advances in technology, globalization, and other factors—the political landscape remains strikingly similar. Authorities are still using leverage both directly (through deficit spending) and indirectly (through asset bubbles) to extract resources from the private sector. As such, the outcome—an Inflation Era 2.0—seems increasingly likely to echo its predecessor. 

VIII. Conclusion: Strengthening Signs of an Emergent Third Inflation Wave 

To wrap things up, December’s CPI has shown signs of a potential bottom and has laid the groundwork for the third upside wave of this inflation cycle. 

Aside from the turnaround in the CORE CPI, which indicates a broadening of price increases across the economy, the record quantitative easing by banks in support of record public spending and all-time highs in public debt have injected substantial liquidity into the system

This, combined with the accelerating growth in bank lending, has intensified liquidity growth. As a result, this increased liquidity tends to diffuse into the economy with a time lag, eventually leading to higher prices.

___

References: 

Prudent Investor, The President and the Markets "Disagree" on the CPI; Global Financial Crisis Icebreaker: The Collapse of Sri Lanka July 11, 2022

Philippine Statistics Authority Consumer Price Index and the Inflation Rate, Frequently Asked Questions 

Milton Friedman, The Real Story Behind Inflation, The Heritage Foundation 

Prudent Investor, Has the May 3.9% CPI Peaked? Are Filipinos Really Spending More On Non-Essentials? Credit Card and Salary Loan NPLs Surged in Q1 2024! June 10 2024  

Prudent Investor, Has the Philippine Government Won Its Battle Against Inflation? SWS Self-Poverty Survey Disagrees, Unveiling Its Hidden Messages October 13, 2024  

Prudent Investor, How the BSP's Soft Peg will Contribute to the Weakening of the US Dollar-Philippine Peso Exchange Rate, January 2, 2025