Showing posts with label bitcoin. Show all posts

Sunday, August 23, 2026

Why Isn't Gold Acting Like a Safe Haven—Yet? Part III: Is This Gold's Next Leg Up?


First of all there is need to remember that the gold standard did not collapse. Governments abolished it in order to pave the way for inflation. The whole grim apparatus of oppression and coercion—policemen, customs guards, penal courts, prisons, in some countries even executioners—had to be put into action in order to destroy the gold standard. Solemn pledges were broken, retroactive laws were promulgated, provisions of constitutions and bills of rights were openly defied. And hosts of servile writers praised what the governments had done and hailed the dawn of the fiat-money millennium.—Ludwig von Mises 

In this issue: 

Why Isn't Gold Acting Like a Safe Haven—Yet? Part III: Is This Gold's Next Leg Up?

I. Introduction: From Finding the Bottom to Explaining the Reversal

II. The Gold Cycle: Cyclical bear, Secular bull

III. The New Plaza Accord: Intervention and Its Shrinking Half-Life

IV. Deepening Interventions Becomes Gold's Catalyst

V. When Former Headwinds Become Tailwinds

VII. Central Banks as Dip Buyers, and the Fund-Flow Tailwind

VI. Risk-Off, Inflationary, and Fiscal Signals Converge

VII. Central Banks as Dip Buyers, and the Fund-Flow Tailwind

VIII. Bottom line: Gold Is Pricing the Limits of Intervention 

Why Isn't Gold Acting Like a Safe Haven—Yet? Part III: Is This Gold's Next Leg Up? 

Intervention was supposed to stabilize currencies and bonds. Instead, each attempt is exposing the imbalance underneath—and gold is beginning to price it.

I. Introduction: From Finding the Bottom to Explaining the Reversal 


Figure 1 

This piece started as an attempt to answer whether gold had found a bottom. Events overtook the question. In the space of a week, gold cleared its 200-day moving average at $4,501, broke above $4,600, surpassed the 38.2% retracement of its decline from March's record, and confirmed the rounding-bottom pattern that had been forming since June. It was gold's third straight weekly gain—and its third strongest week of the year. 

The question of the bottom is no longer the interesting one. 

What's worth asking now is whether this is the start of gold's next leg toward its late January record near $5,400-$5,600, and — more importantly for this series — why it's happening.

Part I and Part II of this series argued gold's early-2026 weakness was a liquidity-stress phenomenon, not a failure of its safe-haven role — the gold-oil ratio compressing as energy-importing economies scrambled for dollars, gold sold because it remained liquid enough to fund margin calls, not because confidence in it had broken. Gold peaked above $5,500 intraday in late January, fell in a rounding top that hardened into a roughly 28% decline into late June, then based and turned. That much was covered in the earlier articles. 

What has changed is the pace and the trend—and, as the following analysis shows, the trigger. 

II. The Gold Cycle: Cyclical bear, Secular bull 

Gold's advance since the Nixon shock of August 15, 1971, has never moved in a straight line. It has progressed through a series of secular cycles, with cyclical bear markets occurring within the larger structural trend. Those corrections have varied considerably in both depth and duration.


Figure 2

The shortest cyclical bear market under a secular bullmarket was the 2008 decline, at roughly 26%, which resolved within about eight months. The deepest was the 2011–2015 decline, at roughly 48%, which lasted four years and marked the hiatus before the current cycle. February–June's roughly 28% decline over four months therefore looks much closer, in depth and duration, to the 2008 cyclical correction than to the 2011–2015 secular break. (Figure 2, topmost pane) 

Importantly, the structural forces behind the current advance have not disappeared. Central-bank de-dollarization, fiscal dominance, a geopolitical order drifting toward blocs, a deepening war economy, asset bubbles, and persistent inflation remain part of the monetary and institutional environment supporting gold. 

A liquidity-driven correction can therefore interrupt a secular advance without terminating the forces that produced it. If the current reversal holds, the February–June decline may prove to have been another cyclical bear market nested within the larger secular bull—not the end of the cycle itself. 

And if that interpretation is correct, the current advance would represent the third major leg of gold's post-Bretton Woods secular bull, following the 1970s advance and the 2001–2011 bull market. (Figure 2, middle graph) 

III. The New Plaza Accord: Intervention and Its Shrinking Half-Life 

On July 31, Japan's Ministry of Finance confirmed a coordinated yen-buying intervention with the US—the first joint action since 2011—after the yen slid toward 40-year lows near 163 to the dollar. 

The September 1985 Plaza Accord is the obvious comparison, but the history deserves care. Gold began rising in February 1985, before the Accord, and rallied roughly 50% from the Accord through November 1987—so gold did respond. (Figure 2, lowest image) 

What the Accord did not do was deliver gold's secular low. The dollar devaluation it engineered helped inflate Japan's property and stock bubble, which peaked in 1990 and produced the “lost decades,” with aftershocks plausibly extending through the 1994 Tequila crisis, the 1994 bond crisis (Great Bond Massacre), and the 1997 Asian financial crisis

Gold's actual secular bottom wasn't etched until the post-Asian-crisis, post-dot-com years around 1999–2001, symbolically marked by Gordon Brown's UK gold sales near the trough. 

The 1980–1999 gold secular bear was, in effect, the salad days of the dollar standard. 

A Plaza-style intervention can produce a real, tradeable cyclical gold rally without stabilizing the underlying system. Plaza's deeper legacy was several years of instability surfacing elsewhere, not durable currency-regime repair.


Figure 3

The yen's own history since 2022 makes the point more directly. Japanese authorities have repeatedly intervened to support the yen, yet each intervention has ultimately been followed by renewed downward pressure. (Figure 3, topmost pane) 

The pattern has been remarkably consistent: intervention produces an abrupt reversal, but the underlying trend eventually reasserts itself. 

That is the shrinking half-life in practice. The more fundamental forces driving the currency remain in place, so each intervention has to work harder to produce the same effect—and the market increasingly treats the intervention itself as evidence of the underlying imbalance. 

That caution has aged well. It took the bond market almost two weeks to fully erase the initial effect of the Fed-BoJ intervention. Then, on August 19, with 30-year Treasury yields pushing above 5.30%—the highest since 2007—the Treasury unexpectedly doubled its long-end buyback capacity, from a $2 billion to at least a $4 billion cap per operation, effective September 9. Yields fell instantly, equity futures jumped, and gold spiked. 

The Treasury's buyback program had already been operating since May 2024. The August move therefore wasn't the introduction of a new tool, but an expansion of an existing one. The important point is what happened despite that intervention: long-term yields had continued rising, suggesting diminishing returns from efforts to absorb duration and stabilize the long end. (Figure 3, middle image) 

This time the effect lasted one day! By Friday, the 30-year yield had regained the entire drop and then some, closing at 5.27%, while the 10-year sat at 4.74%—a single basis point from its pre-intervention high. 

Wolf Richter's account of the episode is worth noting for its diagnosis: the rise in long-term yields wasn't market dysfunction requiring correction, but the consequence of the government having to sell roughly $1 trillion in new debt over three months to fund the deficit, with buyers demanding compensation for inflation risk, the fiscal trajectory, and the sheer volume of paper that must clear the market every few months. Those pressures cannot be resolved by a signaling exercise from the Treasury secretary. 

Treasury Secretary Bessent himself all but conceded the point on CNBC the following morning, repeatedly describing the move as "signaling." 

Nor is Treasury the only official-sector actor absorbing government debt. The Federal Reserve's balance-sheet reduction ended in December 2025, after which it began purchasing Treasury bills and other short-term Treasuries to maintain an ample supply of reserves. Its outright Treasury holdings have subsequently been rising, reaching roughly $4.54 trillion by August 19, 2026. FRED (Figure 3, lowest visual) 

This may not be technically classified as quantitative easing (QE), but economically it represents renewed official-sector absorption of Treasury securities. And the more revealing point is what has happened alongside it: long-term Treasury yields have continued to rise. 

The implication is straightforward: despite the labeling, official-sector absorption of Treasury debt is increasing, yet it is not preventing the market from demanding higher yields on longer maturities. That is evidence of diminishing intervention effectiveness, not evidence that the underlying pressure has been resolved.


Figure 4 

And the underlying pressure is not static. The US national debt has now crossed $40 trillion, while interest costs have continued to accelerate. According to the figures cited by ZeroHedge, interest expense had already reached roughly $1.37 trillion in 2026, about 20% above the comparable period a year earlier. (Figure 4, topmost and middle images) 

This is where intervention encounters a structural problem. Deficit spending creates the borrowing requirement; rising yields increase the cost of servicing that borrowing; and higher interest costs, in turn, enlarge the deficit and require still more borrowing. The market is therefore confronting a moving target: official-sector intervention may temporarily absorb Treasury supply or suppress yields, but the fiscal requirement generating that supply continues to expand. 

The effectiveness of intervention consequently diminishes as the underlying imbalance grows. What might once have been sufficient to stabilize the market becomes progressively less effective when the volume of debt, the interest burden, and the compensation demanded by investors are all rising together. 

Two interventions in three weeks have produced only temporary relief, while the fiscal, currency, and bond-market pressures behind them have quickly reasserted themselves. That is the more important signal for gold. Yields of 10 and 30 year treasuries were at milestone highs (Figure 4, lowest diagram)


Figure 5 

Japanese Government Bons (JGB) yields tell a similar story. 

They remain below their immediate pre-intervention spike, but have begun climbing again, touching a fresh three-decade high near 2.94% on August 18 before easing only slightly. Figure 5, topmost image) 

The same pattern is emerging in Japan: intervention can alter market prices temporarily, but it does not remove the underlying pressure on the currency and sovereign bond market. 

IV. Deepening Interventions Becomes Gold's Catalyst 

For gold, however, the significance is different. 

Gold had already been trading around and holding the $4,000 level from late June through early August. 

First, the Fed-BoJ intervention provided the catalyst for the first lift-off from that base, reinforcing $4,000 as the floor. 

Then, Bessent's Treasury backstop came afterward, adding fuel to an advance that was already underway. 

The initial decline in long-term yields quickly disappeared, but gold retained its momentum

The result was the sequence described at the beginning of this piece: gold broke its 200-day moving average at $4,501, moved above $4,600, surpassed the 38.2% retracement of its March decline, and confirmed the rounding-bottom pattern that had been forming since June. 

The significance therefore goes beyond the failure of either intervention to suppress yields. The interventions themselves are becoming part of the mechanism driving gold higher. Attempts to contain currency and bond-market pressures are adding to the monetary and financial imbalances that gold is increasingly pricing. 

This is where the comparison with the Plaza Accord becomes more interesting. The 1985 agreement did not simply weaken the dollar; it set in motion adjustments that eventually surfaced elsewhere in the financial system. 

Today's bilateral intervention comes against a far more leveraged fiscal and monetary backdrop, with sovereign debt, currency instability, and official-sector intervention increasingly interacting with one another. 

If history rhymes, the contemporary bilateral Plaza Accord may mean more than a break of the recent high—it may mark the beginning of sharply higher gold prices

V. When Former Headwinds Become Tailwinds 

WTI crude was up roughly 5% this week, back above $86, as the US-Iran standoff over the Strait of Hormuz shows no sign of resolving and Washington prepares tighter sanctions. (Figure 5, middle graph) 

That is worth pausing on because oil-driven dollar demand was the mechanism Part I and Part II identified as suppressing gold earlier this year: energy importers scrambled for dollars, and gold was sold for liquidity even as the safe-haven case strengthened. 

The same forces are now coinciding with gold's advance rather than working against it. 

That is not a contradiction. It means the liquidity-stress channel has been overtaken by the larger fiscal-currency-risk channel this piece has been tracking. The same energy shock that once forced gold sales for dollar liquidity is now compounding, rather than competing with, the debt and currency concerns driving the bid for gold. 

There is another important change in the relationship between gold and Treasury yields. Earlier in the year, rising 30-year Treasury yields appeared to place a ceiling on gold's advance. Now the relationship appears to be changing: gold is rising even as the 30-year yield pushes above the level at which the Treasury's intervention sought to stabilize it. 

The market is therefore no longer responding to higher yields simply as an opportunity cost for holding gold. It is increasingly interpreting those yields as evidence of the fiscal and currency pressures that make gold more attractive in the first place. 

It is also worth noting that rising gold prices and rising 10-year Treasury yields have historically coexisted during the stagflationary periods of the 1970s. (Figure 5, lowest chart) 

The parallel with today is not exact—the degree of systemic leverage is vastly different—but the coexistence of rising nominal yields and rising gold is not unprecedented when inflation, fiscal pressure, and confidence in the monetary regime become dominant forces

VI. Risk-Off, Inflationary, and Fiscal Signals Converge 

Gold's rise also came as risk appetite weakened. The S&P 500 fell about 1.4% on the week, its first weekly decline in a month, dragged by a rough five days for technology; the Nasdaq lost roughly 2%. That gives this week's move a stronger risk-off component: equities fell while gold rose. 

But it was not a conventional flight to safety. Oil was rising, long-term Treasury yields were rising, and gold was rising with them. Growth concerns and inflation/fiscal concerns were therefore appearing simultaneously: stocks were pricing weaker risk appetite, while oil and bond yields were pricing inflation, supply, and fiscal pressures. 

That combination is arguably more important for gold than a conventional risk-off episode. Gold was not merely benefiting from falling risk assets; it was responding to the same underlying deterioration that was simultaneously pushing up oil and long-term yields. 

Curiously, Bitcoin also surged more than 22% during the week, briefly moving above $77,000, reflecting both renewed risk appetite in the crypto market and, potentially, a safe-haven bid amid concerns over currencies and the monetary system. Short covering amplified the move. 

Taken together, the week's price action looks less like a simple flight to safety than a convergence of risk-off, inflationary, and fiscal signals—and gold is increasingly responding to all three. 

VII. Central Banks as Dip Buyers, and the Fund-Flow Tailwind


Figure 6

Central banks were buying into the selloff. The World Gold Council's Q2 2026 data showed central banks adding 102 tonnes of gold during the quarter, even as gold prices fell roughly 16%. (Figure 6, upper diagram) 

As of the first half of 2026, Poland remained the largest reported buyer at 82 tonnes, followed by Uzbekistan at 41 tonnes, China at 40 tonnes, and Kazakhstan at 27 tonnes. World Gold Council: Central Bank Gold Statistics, June 2026 (Figure 6, lower graph) 

The significance is not the absolute volume, but the direction of demand during the correction. While more price-sensitive and leveraged holders were liquidating, official-sector demand was increasing. Central banks were therefore absorbing part of the supply released by the selloff, providing an important counterweight to the liquidation pressure that drove gold lower. 

The longer-term demand signal remains equally important. The World Gold Council's survey found that 89% of reserve managers expect official gold holdings to increase over the next 12 months. That suggests the buying is not simply a reaction to short-term price movements, but part of a broader shift in reserve preferences.


Figure 7

Fund flows provide a second layer of support. Gold held the $4,000 area for close to two months as renewed ETF inflows emerged, while the two previous stretches of stronger fund flows—roughly August–October 2025 and November–February 2026—preceded significant advances, including the run into January's record. (Figure 7, upper image) 

The pattern does not mean ETF flows mechanically determine prices, but it does show that renewed investment demand has tended to accompany—and at times precede—the next major leg higher.  

Independent ETF data reinforce the change in direction: global gold ETFs returned to inflows in July after May–June redemptions had flushed out leveraged positions, with flows continuing into August. The important development is therefore not simply the amount of money flowing into gold, but the transition from forced liquidation to renewed accumulation

India's Dhanteras and Diwali season could provide an additional, though more modest, seasonal catalyst into year-end, alongside whatever short covering remains from a positioning backdrop that has been reduced but does not appear fully washed out. (Figure 7, lower visual) 

The ownership dynamics are therefore changing. Central banks were accumulating while weaker and more leveraged holders were liquidating; as that selling pressure subsided, ETF flows turned positive. The correction consequently did not destroy the underlying demand structure. Instead, it transferred gold from more price-sensitive holders toward buyers with a stronger strategic (non-price sensitive) incentive to own it. 

That matters for the next leg. The same selloff that removed speculative excess also created the conditions for a stronger base: official buyers absorbed supply, leveraged positions were reduced, and investment flows are now returning as gold moves higher. 

VIII. Bottom line: Gold Is Pricing the Limits of Intervention 

The question this piece opened with has effectively been answered by the market: gold has bottomed. What deserves scrutiny now is why, because the explanation is not the conventional one. 

Two interventions in three weeks—one in currencies, one in the bond market—have produced only temporary effects in the markets they were intended to stabilize. Yet their significance for gold has been the opposite. 

The Fed-BoJ intervention provided the catalyst for gold's first lift-off from the $4,000 base; Bessent's Treasury backstop then added fuel to an advance already underway. The interventions did not extinguish the underlying pressures. They exposed them—and, in doing so, reinforced the forces driving gold higher. 

The same energy shock that once forced gold into liquidity sales is now moving with gold rather than against it. This week's equity sell-off adds another layer: stocks fell while gold, oil, and long-term yields rose together. That is not a simple flight-to-safety trade. It is a combination of risk-off, inflationary, and fiscal signals—a more distinctly stagflationary configuration. 

The next leg will not necessarily be linear. $4,600 now needs to establish itself as support rather than prove to have been a temporary spike, while a sustained break below $4,300 would materially weaken the bullish structure. But the more important question is no longer technical. 

Gold is increasingly pricing the widening gap between what governments can credibly promise about their currencies and debt markets and what they can actually deliver. The interventions are themselves becoming part of that price signal: each attempt to contain currency or bond-market pressure produces a temporary market response, while the underlying imbalance quickly reasserts itself. 

And that is ultimately what makes this leg different from the earlier stages of the cycle. Gold is no longer simply rising because investors fear what might happen. It is rising because the market is beginning to price what governments are already doing—and the diminishing effectiveness of their attempts to contain the consequences. 

____

References

-Why Isn’t Gold Acting Like a Safe Haven—Yet? The Gold–Oil Ratio and the Liquidity Stress Behind Early-Crisis Gold Weakness (Part II)—April 5, 2026 

-Why Isn’t Gold Acting Like a Safe Haven—Yet? War, Liquidity Stress, and the Fracturing of the Bullion System (Part I) March 22, 2026


Sunday, April 27, 2025

April 7: The Day Global Risk Assets Bottomed: A Synchronized Reversal Across Stocks, Crypto, and Commodities


The conventional view serves to protect us from the painful job of thinking—John Kenneth Galbraith 

April 7: The Day Global Risk Assets Bottomed: A Synchronized Reversal Across Stocks, Crypto, and Commodities 

Following the April 7-8 lows, a synchronized rally swept across US, Asian or global stocks, commodities, and Bitcoin. Forget domestic interventions—this was a liquidity-driven comeback, sparked by global catalysts and market dynamics. 

I. Introduction 

On April 7-8, 2025, global markets teetered on the edge: Hong Kong’s Hang Seng cratered 13%, U.S. stocks wobbled, copper plunged 8%, and Bitcoin hit a yearly low. Fear ruled, with the VIX spiking to 46.98. 

Then, everything reversed course and headed higher through the next few weeks. 

From Tokyo to New York, stocks soared. Gold, oil, copper, and even Bitcoin joined the party. 

What sparked this global comeback? 

It wasn’t Chinese state buying or local policies. It was a liquidity tsunami, fueled by a massive global short-covering and capital rushing back to oversold assets. 

II. The Panic and the Spark


Figure 1

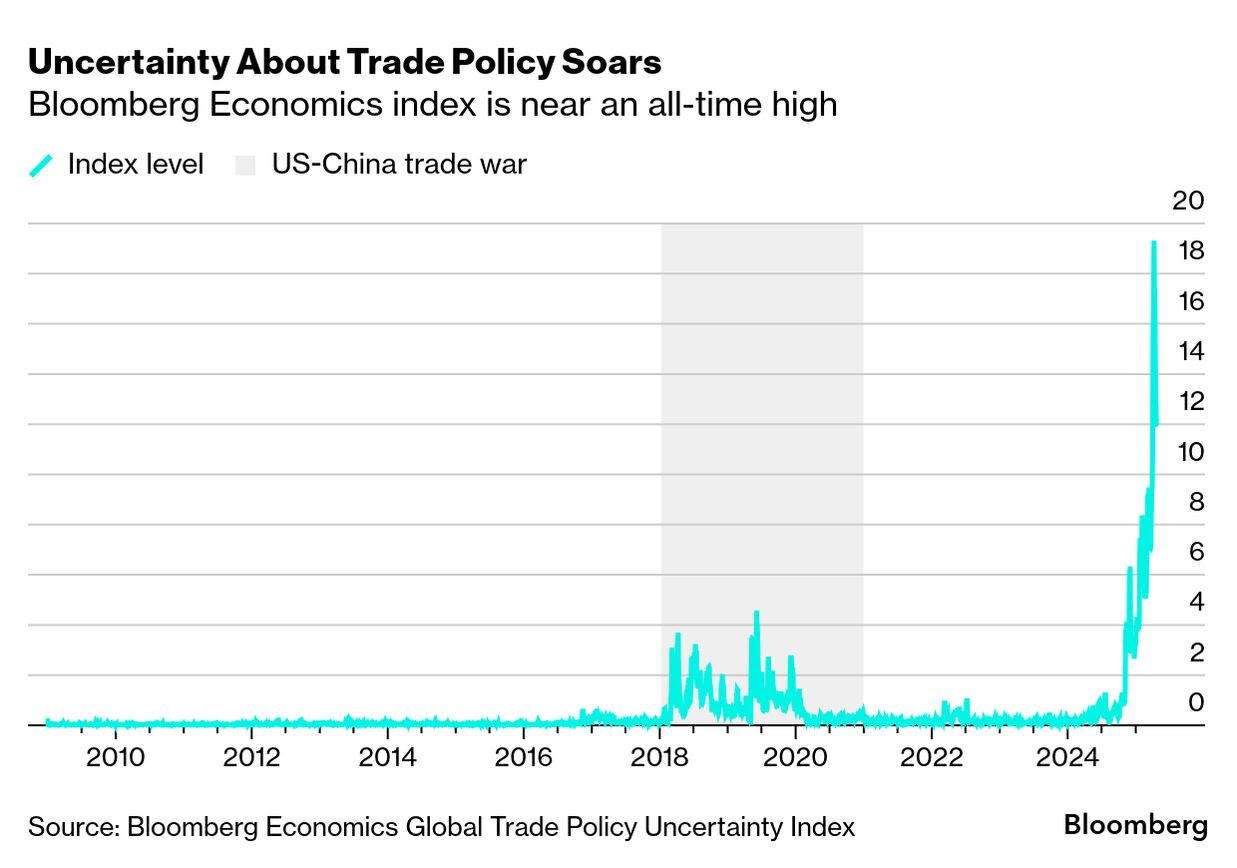
Concerns over the festering trade war, all-time high uncertainties, mounting geopolitical tensions in the face of a weakening global economy, and high systemic leverage put pressure on risk assets.   

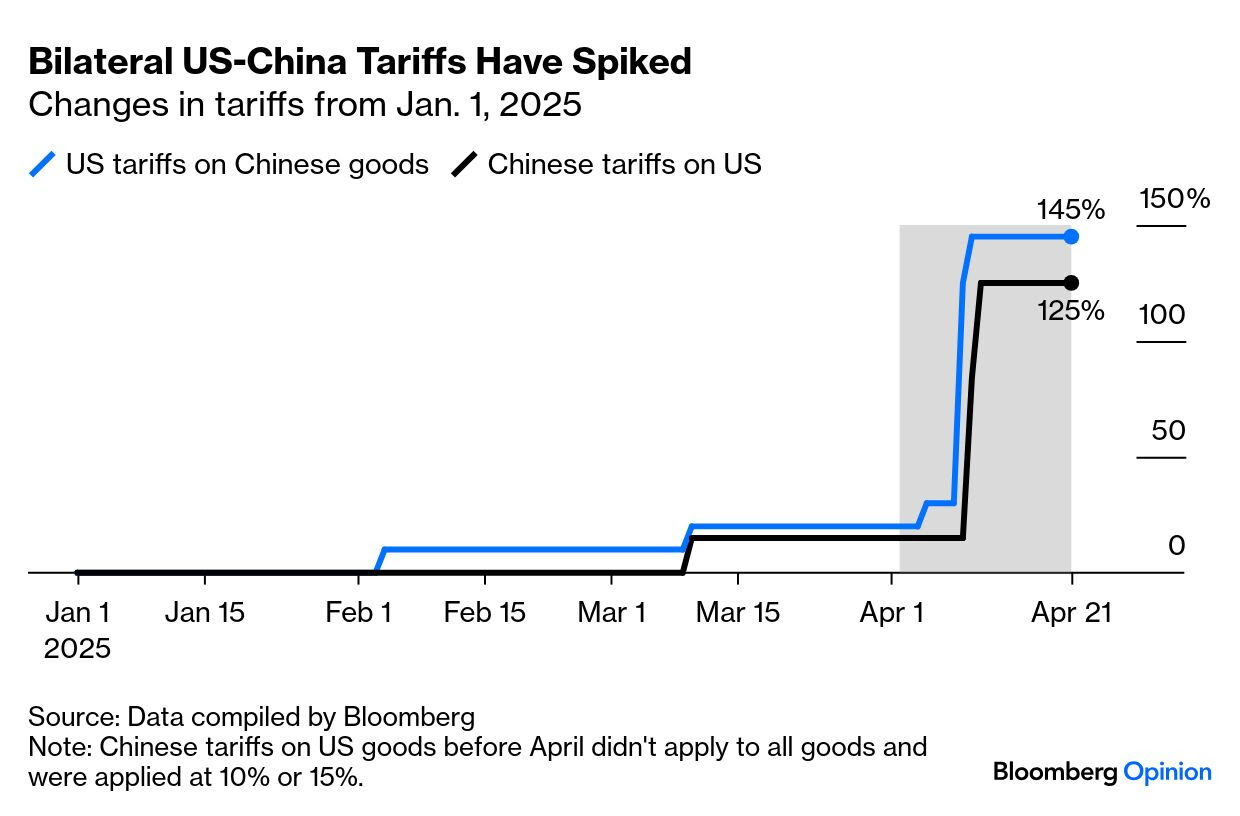
In charts, US-China bilateral tariffs soared in April.  (Figure 1)


Figure 2

The world’s government debt-to-GDP ratio remains high and is expected to rise further. (Figure 2, upper diagram) 

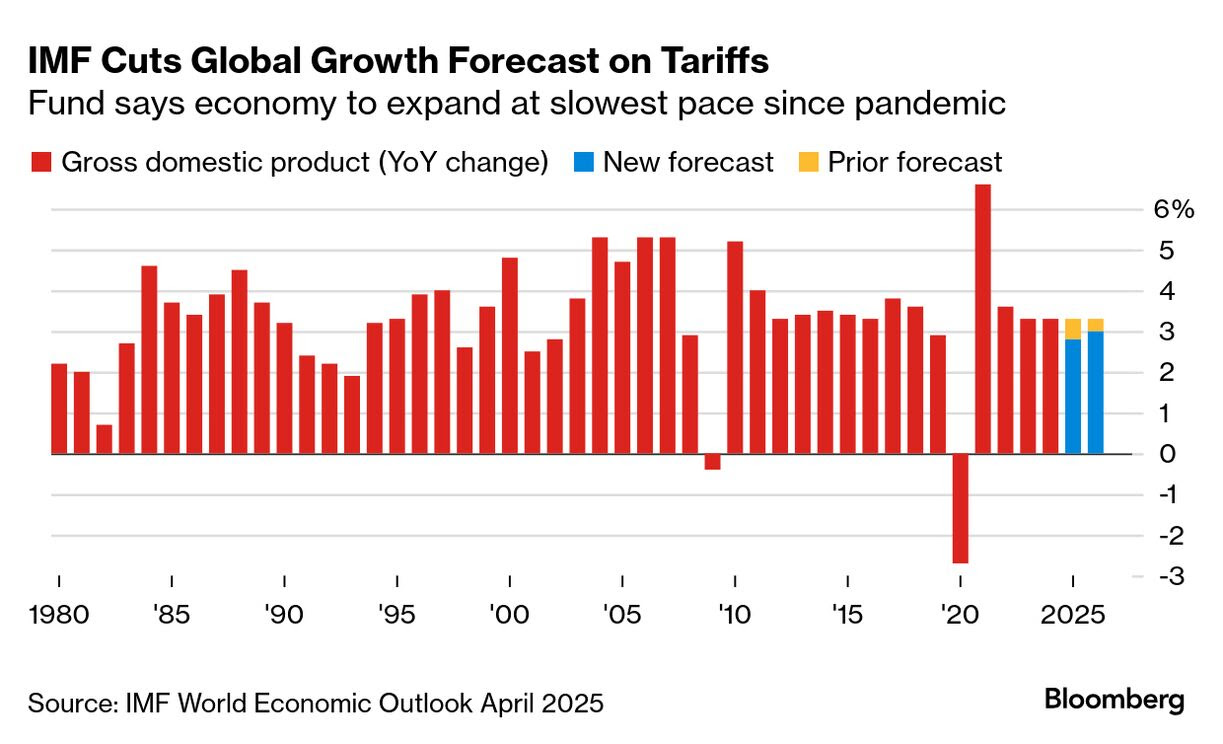
The IMF slashed its global GDP forecast from 3.3% to 2.8% in 2025 (Figure 2, lower image) 

Deflating prices, deleveraging, and liquidity tightening led to a risk aversion in global stocks, which culminated in April 7’s brutal selloffs. 

The Chinese yuan fell, or the US dollar-yuan USDCNY spiked, driven by China’s retaliatory tariffs. 

But late on April 7, rumors of a 90-day U.S. tariff pause (excluding China) surfaced, sparking a wild U.S. market swing (S&P 500 from -4.7% to +3.4%). 

Though denied, these rumors set the stage for April 8. 

III. April 8 Onwards: A Liquidity-Fueled Macro Short-Covering Rally 

On April 8, the selloff in some of the global markets had eased, and some had started a sharp recovery. 

Liquidity—fueled by institutional buying, short covering, and algorithmic trading—revived risk-ON sentiment.


Figure 3 

From the April 7-8 lows, the S&P Global Equity Index rebounded 11.2%, the US S&P 11.02%, and the Euro Stoxx 600 10.8% as of April 25th. (Figure 3, topmost pane) 

In Asia, China’s Shanghai Composite rallied 6.6%, while Hong Kong’s Hang Seng 50 surged 9.9%. (Figure 3, middle graph) 

Meanwhile, Southeast Asian bourses staged a massive recoil. Indonesia’s JCI surged 12.7%, Thailand’s SET 9.33%, and the Philippine PSEi 30 8.74%, over the same period. (Figure 3, lowest chart)


Figure 4

Strikingly, USD gold prices soared 12.1%, copper 20.2%, WTI crude 6.9%, and Brent crude 7.5% (Figure 4, upper window) 

The CRB Commodity Index advanced by 7.2%, while Bitcoin roared 28%. (Figure 4, lower visual) 

Risk-ON was suddenly back! 

The USDCNY spike U-turned and plunged, with China’s central bank selling dollars to slow the yuan’s fall, but this was secondary. (Figure 4, lower graph) 

I called this on my X.com post, "A macro short-covering rally." 

IV. Extreme Oversold Conditions 


Figure 5

The VIX nearly hitting 50 was a sign of extreme oversold conditions. Historically, this has proved to be a turning point. (Figure 5, upper chart) 

While past performance doesn’t guarantee future results, one thing is clear: liquidity re-emerged following oversold conditions, and the VIX metric may have been somehow validated. 

V. Why Liquidity, Not Local Policies 

Chinese state buying, PBOC intervention, and the BOJ’s yen-defense rhetoric were possibly too small to reinvigorate the world’s risk appetite. 

Yet, the rally’s timing, scale, and breadth—spanning stocks, commodities, crypto, and the yuan—points to a global liquidity flood, driven by tariff relief hopes, the Fed’s dovish narrative, and oversold conditions. 

VI. Takeaways: A Fragile Rally in a Fractured World 

Trump’s arbitrary and capricious policies (Tariffs or not) should sustain an ambiance of "regime uncertainty," which clouds economic calculation for the global economy. 

This is aside from geopolitical (e.g., latest India-Pakistan clash over Kashmir, the ongoing Israel-Palestine War, Russia-Ukraine War, US/Israel-Houthi War, frictions at South China Sea and Taiwan, et al.) and geoeconomic (US-China trade war) tensions. 

Trump’s backsliding against China has prompted Chinese media to make a mockery of his policies, which in the coming days could test his mercurial temperament. Rising markets may reanimate his belligerent trade and foreign policy stance. 

With Return on Investment (RoI) and "hurdle rates" indeterminate, investments will likely stall.  The financial world will likely chase short-term gains via the financial markets, which likely implies heightened volatility in the days to come. 

Easily, this ties to bear market rallies in stocks, which are often sharp and swift but fleeting. 

Furthermore, for a financial world increasingly dependent on central bank easy-money bailouts, mounting de-globalization dynamics, rising geopolitical and geoeconomic uncertainties, increasing risks of economic discoordination and disruptions, increasing leverage, volatile liquidity conditions, and escalating risks of stagflation will likely inhibit central banks from their traditional approach—all of which may reduce the likelihood of fuel for a financial market "blowoff." 

Lastly, aside from gold, central banks and governments have lately been amassing Treasury Bills—a sign of a stampede for liquidity. The last time they hit this high was during the Great Recession (2007-2009). They surpassed the highs during the 2020 pandemic recession. (Figure 5, lower chart) 

All told, all-time high gold prices plus the second-highest official inflows to Treasury bills are likely signs of a coming global recession or a financial crisis.


Monday, June 20, 2022

Never Believe Anything Until It Is Officially Denied: US Recession, the Stable Peso, and Stagflation


It’s not “wealth” that’s being wiped out. It’s market capitalization. The wealth is in the cash flows. The wealth is in the denominator. The market cap was speculation encouraged by a reckless Fed. That was the “policy error—John P Hussman, Ph.D. 


In this issue 


Never Believe Anything Until It Is Officially Denied: US Recession, the Stable Peso, and Stagflation 

I. US Fed and Treasury Denialism: From Transitory Inflation to 75 bps Rate Hike to Recession 

II. Bitcoin Collapses on Liquidity Drought! 

III. Global Stocks and Bonds Plunged, the Bear Market Linkage Between the S&P 500-PSEi 30 

IV. Divergent Policies: ECB’s Makeover QE and the Doggedness of Bank of Japan’s Low Rate Policy 

V. Denialism: The "Stable" Peso 

VI. Denialism: Stagflation in the Transport Sector 

VII. Denialism: Public Sentiment Indicates Worries Over Stagflation 


Never Believe Anything Until It Is Officially Denied: US Recession, the Stable Peso, and Stagflation 


"Never Believe Anything Until It Is Officially Denied."  


German political leader Otto von Bismarck, journalist Claud Cockburn and Washington attorney Edward Cheyfitz are among some of the people attributed to this controversial quote. 


I. US Fed and Treasury Denialism: From Transitory Inflation to 75 bps Rate Hike to Recession 


An observant bloke would see a lot of political denialism these days, specifically when applied to inflation. 


Monetary and financial officials here and abroad previously attributed inflation to a "transitory" phenomenon. 


But no matter how officials deny it, the intransigence of inflation has forced US officials to admit their mistakes.  


Of course, citizens not only of the US but the world have carried the cross of their policy blunders.  


Below represents incredible confessions by two key US officials. 


First, the Federal Reserve Chairman Jerome Powell. 


Yahoo Finance December 1, 2021: The nation’s economic steward said it will back off of using the word “transitory” to describe the fast pace of price increases, as Federal Reserve policymakers acknowledge the increasing risk of more persistent inflation. “We tend to use [the word transitory] to mean that it won’t leave a permanent mark in the form of higher inflation,” Fed Chairman Jerome Powell told Congress on Tuesday. “I think it’s probably a good time to retire that word and try to explain more clearly what we mean.” 


Next, US Treasury Secretary Janet Yellen. 


CNN June 10: US Treasury Secretary Janet Yellen admitted Tuesday that she had failed to anticipate how long high inflation would continue to plague American consumers as the Biden administration works to contain a mounting political liability. 


In a recent comment to address surging inflation, Federal Reserve Chairman Jerome Powell dismissed the idea that official rates will increase by 75 bps earlier. 


Reuters May 4: Federal Reserve Chair Jerome Powell on Wednesday said central bank officials are not "actively" considering a rate hike of three-quarters of a percentage point at coming monetary policy meetings. "A 75 basis point increase is not something that the committee is actively considering," Powell said in response to a question at a press conference following the Fed's latest meeting, at which it decided to lift rates by half a percentage point and signaled more increases are coming. 


However, the streaking inflation impelled the FED to change its stance and increase rates by 75 bps, last week, the largest since 1994! 


CNBC June 15: Jerome Powell said Wednesday’s 75-basis-point hike was due in part to the Federal Reserve being worried about inflation expectations increasing. Most measures still show that Americans expect inflation to return to normal in the coming years, but there were some signs of stress, Powell said. 


But their action increased public concerns over the likelihood of a "hard landing" or a recession. Incidentally, the same authorities have brushed this off. 


Philstar.com June 10: The United States is unlikely to suffer an economic downturn, despite sky-high inflation, US Treasury Secretary Janet Yellen said Thursday. "There's nothing to suggest that there's a recession in the works," she said during an interview at The New York Times' economic forum. 


AFR.com June 16: So, Powell had his work cut out on Wednesday (Thursday AEST) to convince pundits that the American economy could avoid one. The Federal Reserve approved the largest rate increase since 1994 and signalled it would continue to lift rates this year to combat inflation, which is running at a 40-year high. But Powell said he was confident of a soft landing, where the Fed slows the economy enough to bring down inflation without causing a recession. His words seemed to assuage the markets and key indices jumped after he delivered his outlook. “There’s no sign of a broader slowdown that I can see in the economy,” the US central bank chairman said at his press conference. “People are talking about it a lot. Consumer confidence is very low and that’s probably related to gas prices, and also stock prices to some extent for other people. But that’s not what we’re seeing. We’re not seeing a broad slowdown,” he said. 


Are these denials a confirmation of the onset of a US recession? 


II. Bitcoin Collapses on Liquidity Drought! 

Figure 1 


The US Fed appears to be aggressively hiking amidst a falling stock market, which should mark the first-ever event. (Figure 1, upper pane) 


This attempt to thaw the massive selloffs (rocketing yields) in the bond markets through the series of tightening measures has pounded the liquidity-dependent global assets markets. 


The crypto sphere was monkey hammered over the week, with its overall market cap crashing by 25.8%, principally on Bitcoin's harrowing 30% collapse!  (Figure 1, middle window) 


Bitcoin, the principal member of the crypto population, presently trades at the USD 19,000 level, representing a low of December 2020.  


Also, this level indicates a massive pullback of the price gains acquired by Bitcoin when it surged to over USD 65,000 in November 2021!   


As Newton’s second law of motion states, "For every action, there is an equal and opposite reaction." 


The massive run on lenders Celsius Network and Babel Finance and troubles in crypto hedge fund Three Arrows Capital have exacerbated the predicament of the crypto universe.  


Ironically, despite the crumbling prices, the crypto population continues to swell. It was up by .51% to 19,920 this week, or 22.7% YTD! 


The bottom may not be on the horizon yet. 


The crypto crash is a testament to what happens when central bank liquidity dissipates! 


Yet, in the crypto sphere, never believe anything until it is officially denied. 


With mounting doubts about its viability, officials of Celsius Network claimed they were ready to meet the challenges.  


Celsius Blog June 8:  "We at Celsius are online 24–7. We’re working around the clock to continue to serve our community. Celsius has one of the best risk management teams in the world. Our security team and infrastructure is second to none. We have made it through crypto downturns before (this is our fourth!). Celsius is prepared. At this already challenging time, it’s unfortunate that vocal actors are spreading misinformation and confusion. They have tried unsuccessfully, for example, to link Celsius to the collapse of Luna and falsely claim that Celsius sustained significant losses as a result. They have stirred confusion around HODL mode and the importance of protecting user accounts. And the list goes on." 


However, its supposed bulwark succumbed to mass withdrawals.  


Reuters (June 13): Bitcoin fell as much as 14% on Monday after major U.S. cryptocurrency lending company Celsius Network froze withdrawals and transfers citing "extreme" market conditions, in the latest sign of the financial market downturn hitting the cryptosphere. The Celsius move triggered a slide across cryptocurrencies, with their value dropping below $1 trillion on Monday for the first time since January 2021, sparking worries the rout might spill over into other assets or hit other companies. 

III. Global Stocks and Bonds Plunged, the Bear Market Linkage Between the S&P 500-PSEi 30 


Again, it's not just bitcoin and the crypto world.  


The monetary drought has buffeted global stocks and bonds, which are on track to post the worst quarterly returns in history. (Figure 1, lowest window) 


In short, mounting liquidity strains have prompted the liquidity-dependent financial marketplace to raise liquidity in panic.  

What's more, the axiom "when the US sneezes, the world catches a cold" still applies. 


It was a bloodbath for global equity markets last week. 


Figure 2 

Except for China, Asian equity markets also wobbled. Japan's Nikkei (-6.7%), Australia's All Ordinaries (-6.74%), and South Korea's Kospi (-6.0%) endured the most losses. (Figure 2, upmost window) 


While the PSEi fell 3.04%, the US benchmark, the S&P 500, dived by 5.8% this week. 


The historical bear markets of the S&P 500 and the PSEi 30 appear synchronized. (Figure 2, middle window) 


The MSCI World Index appears to be testing the bear market. Nonetheless, the number of countries with equities at least 20% off their 52-week highs remains lower than in 2020. (Figure 2, lowest pane) 


Such dynamic highlights the contagion effects of the interconnected global financial markets. 


But no trend goes in a straight line. Bear markets tend to have the sharpest but unsustainable clearing rallies.  


Generating positive returns require accurately picking the bottom and implementing it. However, this may be similar to the analogy of "picking up nickels in front of a steam roller," or profitably catching bottoms are elusive, and instead may lead to the fatal, "catching a falling knife." 


Accurate timing does not only represent the principal challenge. The other concern is to weigh the probability and payoffs from estimated positioning and its implementation. And this requires both flexibility and discipline.   


IV. Divergent Policies: ECB’s Makeover QE and the Doggedness of Bank of Japan’s Low Rate Policy 


Figure 3 

Interestingly, the seeming conviction of the FED to tighten doesn't seem to be shared by other central banks. 


Bond yields in Europe have surged because of inflation backed by receding market liquidity (Figure 3, upmost pane) 


In response, the ECB announced plans to implement a new tool to address the fragmenting risks in its bond markets with a revision of its QE.  


Earlier, the ECB also confirmed plans to raise rates in July.  Perhaps unconvinced by the ECB measures, the euro fell by .2% this week. 


Meanwhile, the Bank of Japan bucked the global trend of rising rates to maintain its low policy rates.  


Reinforcing its policy of putting a cap on the yields of its treasuries, the USD Yen soared to a 24-year high! (Figure 3, middle and lowest windows) 


The BoJ thinks that its cap will work, but the market takes the opposing view. 


Because of the cap, the sinking yen represents the market's exhaust valve. 


Needless to say, varying policies of central banks are likely to amplify the distortions in the global marketplace and exacerbate financial stress. 


V. Denialism: The "Stable" Peso 


Here are the domestic account of "Never Believe Anything Until It Is Officially Denied."  

Inquirer, June 13: The Department of Finance (DOF) is confident that the Philippine peso remains stable and backed by a firm economy after the local currency depreciated to 53 against the US dollar on Friday, the weakest in about three and a half years. “Strong macroeconomic fundamentals continue to support the peso, despite external headwinds from tighter monetary policy actions by the US Federal Reserve and inflationary pressures from heightened global fuel prices,” DOF chief economist Gil Beltran said in a statement…Also, Beltran said the peso continued to be in “the middle of the pack of the most stable currencies” in Asia, ranking 8th among 11 Asian currencies in terms of strength. The peso depreciated by 5.4 percent to 50.77 to the US dollar at the end of 2021 from 48.04:$1 at end-2020. At the same time, three currencies —including the Japanese yen, Thai baht, and South Korean won—depreciated faster. “In 2022 [so far], the peso was one of the strongest Asian currencies, ranking second only to the Vietnamese dong,” Beltran said.  


Figure 4 


A few days after this news, the USD peso soared to close the week higher by 1.42% to 53.75, representing the third-largest gainer in the region after the Indonesian rupiah (+1.87%) and the South Korean won (+1.53%). (Figure 4, upmost window) 


Sure, this strong move by the USD peso pushed YTD returns to slightly below the average return of the region at 5.6%. Or, the USD peso ranked 5th of the nine regional currencies published at Bloomberg. Year-to-Date (YTD). (Figure 4, middle pane) 


But the thing is, the USD peso started its upside move in June 2021. In this instance, the USD peso posted the third-best returns in the region from December 31, 2020, through last week. (Figure 4, lowest window) 


In any case, picking historical points to prove a political point signifies a biased sample 


Figure 5 

If history is a guide, the USD peso tends to be strong in periods of economic and financial distress. The USD peso returned 15.12% in 2008 or during the Great Recession and 8.5% during the taper tantrum in 2013. (Figure 5, upper window) 


While the USD peso fell by 3.7% and 5.16% in 2019 and 2020 (record recession), this was principally due to BSP operations to support the peso through massive "USD short" positions. Such positions included the intensive use of unconventional tools such as the "Other Reserve Assets" (or financial derivatives) and extensive external public borrowings. 


Besides, how is comparing volatility equivalent to being "stable"? Merriam-Webster defines stable as not changing or fluctuating. 


And how will the record string of public sector deficits be financed if not through debt, inflation, and taxes?   


And how about the supposed "prudence" from the streaking record highs of external debt? (Figure 5, lowest pane) 


And what is the influence of the other factors, such as rising rates and tightening liquidity abroad, and others, on the USD peso? 


How would these be supportive of the peso? 


Confusing statistics (history) with causality may not be a sound approach when interpreting or forecasting the markets.   


Economics is not about the talisman of statistics. 


VI. Denialism: Stagflation in the Transport Sector 


Never believe in stagflation until it is officially denied.  


Businessworld, June 17: “STAGFLATION” is unlikely to pose an immediate risk to the Philippine economy, Bangko Sentral ng Pilipinas (BSP) Governor Benjamin E. Diokno said. “The BSP does not view ‘stagflation’ — an economic condition characterized by slow growth, high unemployment, and rising inflation — as an immediate risk to the Philippine economy,” he said in a statement on Thursday. 


ABS-CBN News June 19: Outgoing Department of Trade and Industry (DTI) Secretary Ramon Lopez said Saturday that stagflation is unlikely to happen in the country, citing a rosy economic outlook. Stagflation happens when there is slow economic growth, high inflation, and a high unemployment rate. "Stagflation, malabo dahil nga dito sa growth momentum that we are experiencing despite the challenges," Lopez told ABS-CBN's TeleRadyo. 


For authorities to chime in and say that stagflation is not a risk should, on its own, be interesting. 


Why reckon with "stagflation" in public when it is not a risk worth considering? Are some sectors starting to press authorities for answers on these matters? 


One example. The distressed Transport sector. 


Inquirer, June 17: “As the saying goes: ‘A desperate man will cling to a knife.’ We don’t want to put the drivers in that kind of situation, which is why we are making this request,” Suntay said. Taxi driver Gregorio Laude, a father of two, said the increase in flagdown rates would be a big help for his family. The 56-year-old used to earn P5,000 a day working from 5:30 a.m. until 4 p.m. From that amount, he would take home around P2,000 to P3,000. But over the past months, his earnings have gone down to around P700 to P1,000. Before the weekly skyrocketing prices of petroleum products, Laude paid around P1,300 to P1,500 for gasoline daily. He now pays P3,000. Apart from that, the “boundary” was raised from P900 to P1,300 by the taxi owner, who reasoned that there were more passengers now after pandemic restrictions were relaxed in Metro Manila.  “It’s not just the gas, but the boundary as well, which consumes what we would normally collect for the day,” Laude said. He also used to get an additional P20 to P30 in tips from at least four out of every 10 passengers. If he is lucky, a generous passenger would give him P50 to P100. “Of course, they understand our situation and they themselves would voluntarily give a tip, sometimes bigger,” Laude said. 


Inquirer, June 15: The transport sector is in a “deadly spiral” and the next administration should “get us out of this”. This was stressed by the group Move As One Coalition (Move As One) on Tuesday (June 14) as transport inflation remained high in May, having a 24.5 share in the overall 5.4 percent inflation rate last month…The coalition said this was reflected in rising oil prices, drivers losing jobs, public transportation supply collapsing, more commuters experiencing longer lines and waiting times, and crowded commutes in enclosed spaces…The Pagkakaisa ng mga Samahan ng Tsuper at Operator Nationwide told INQUIRER.net that because of the oil price hikes, drivers are losing P363 per day for every 20 liters of diesel needed for short routes. As a result, some PUV drivers and operators have already decided to stop plying their routes for now because the cost of diesel, which already registered a net increase of P41.15 per liter since last Jan. 1, had eaten up all their earnings. 


Perhaps authorities and experts have become so fixated with politics or the instant gratification of the commuting public that they seem to have forgotten the fundamentals of price ceilings. 


Figure 6 


From Econoport"The resulting shortage of goods can lead to consumers having to queue up in line to get the good, government rationing, and even the development of a black market dealing with the scarce goods." (Figure 6, upper pane) 


The anecdotes reinforce the economic theory on why the socio-economic distress from the supply side in response to price caps has led to the shrinking availability of public transport, the long lines and waiting times for commuters, and unauthorized charging by those still plying the routes.  


It represents a textbook response. 


Yet, free rides by authorities only transfer their burden to the public treasury through higher public spending.  


Moreover, since subsidies given to the affected drivers by authorities address the demand side when the supply side signifies the problem only strengthens the case of stagflation. 


And how are developments in the Transport sector such as reduced output, rising prices, and decreased jobs not symptoms of stagflation? 


Why the intense refusal to raise fare prices or ideally allow the price system to determine people's actions? 


Because authorities want to defend the commuters' welfare? By inducing shortages? Or, how does pushing for transport deficiencies help the welfare of the commuting public? Yes, one can pay lower prices only if one can secure a ride from the growing scarcity of public transport. IF. 


With lower employee mobility, how will this impact production? 


Or are authorities defending the fare limits to put a cap on the CPI? 


By extension, a depressed CPI theoretically lowers bond yields that, in effect, represent a subsidy to public spending. 


You see, that's how central planning works. Use political smoke and mirrors to pick winners and losers to seek more funds to spend on other boondoggles.  


As pawns of vile politics; damned the consumers! 


But there’s more. 


VII. Denialism: Public Sentiment Indicates Worries Over Stagflation 


SWS, June 16: The national Social Weather Survey of April 19-27, 2022, found 34% of adult Filipinos saying their quality-of-life was worse than twelve months before (termed by SWS as “Losers”), 32% saying it got better (“Gainers”), and 34% saying it was the same (“Unchanged”), compared to a year ago. The resulting Net Gainers score is -2 (% Gainers minus % Losers), classified by SWS as fair (-9 to zero).  


Let us suppose the accuracy of the SWS poll. 


The survey does not include the reasons behind the changes in the quality of life.  


But, the survey deals with the massive changes in mobility. Or its data compares a social environment limited by pandemic restrictions against reopened one.  


The Google Mobility chart provides, in clarity, the scope of changes covering the stated period. (Figure 6, lowest pane) 


Despite the increase, the majority (losers and unchanged) remained unconvinced of a better life?  Why? 


What happened to the reopening?  Why was it insufficient to persuade the majority of a return to normal? 


What "other" factors constrained public sentiment to see a better quality of life than last year?  


Was it inflation, which also saw increased perceptions of self-rated poverty, aside from the hunger incidences? 


How are these not supposed to be symptoms of "stagflation" instead of a "growth momentum?" 


Evidence provided by manufacturing, transport, and even retail points to the mounting risk of stagflation, which appears to be bolstered now by the general sentiment.   


It becomes more conspicuous why authorities have ramped up its echo chamber to deny it.