``Losing trust does not mean that there must be a ready substitute. On the contrary: when distrust will emerge towards the US dollar this would affect the attitude towards all paper currencies. In the final stages of the currency crisis, the dollar will most likely devalue not so much against the euro and the yen, but all of these currencies and most of the rest will devalue drastically against gold.” Anthony Mueller, The End of Dollar Supremacy, Oct 20, 2003.
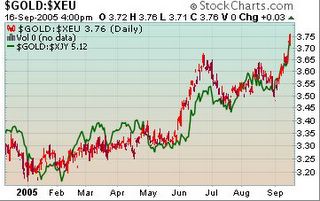
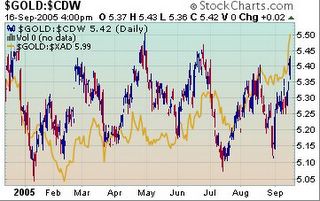
As mentioned last week, John Maynard Keynes’ barbaric metal ‘Gold’ was drifting along at a striking distance near its 16 year barrier based on the US dollar quoted price charts, but this week not only has it successfully broken out of them, it has done so against virtually almost all major currencies as shown in the charts below courtesy of stochcharts.com...
Gold breaks out against the Euro (red candlesticks) and the Japanese Yen (green line)!
Gold breaks out even against the key Commodity Currencies, the Australian Dollar (gold line) which incidentally bears a strong correlation to gold relative to other currencies! While treading at the upper side range of the strongest amongst ’em all the Canadian Loonie (blue candlestick)!
In the past, gold prices have largely tracked the Euro as it gained over the US dollar, however since the US dollar have firmed over for most of the year and gold manifested signs of eventual decoupling since June (see June 13 to 17 edition A Looming Genuine Bull Market in GOLD at Work??!!).
Historically, gold and oil have moved up in the years where high inflation prevailed. For example here is a list of how assets performed during June 1970 to 1980...
| Rank | Assets | Returns (%) |
| 1 | Oil | 34.7 |
| 2 | Gold | 31.6 |
| 3 | US coins | 27.7 |
| 4 | Silver | 23.7 |
| 5 | Stamps | 21.8 |
| 6 | Chinese ceramics | 21.6 |
| 7 | Diamonds | 15.3 |
| 8 | US farmlands | 14 |
| 9 | Old Masters | 13.1 |
| 10 | Housing | 10.2 |
| 11 | Consumer Price Index | 7.7 |
| 12 | Treasury bills | 7.7 |
| 13 | Foreign Exchange | 7.3 |
| 14 | Bonds | 6.6 |
| 15 | Stocks | 6.1 |
Note: Compound annual rates of return. Source: Salomon Inc/Dr. Marc Faber Tomorrow’s Gold
As you would notice from the above table, tangible assets prevailed over the presently ‘known’ traditional investments themes.
One must be reminded that while history may not repeat itself entirely it may show signs of parallelism as today.
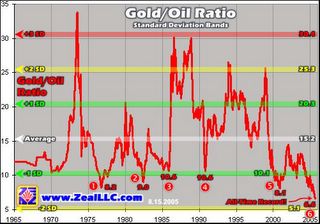
The chart below, courtesy of Adam Hamilton’s ZealLLC.com shows of the gold oil correlation or how many barrels of oil can buy an ounce of gold or expressed in a ratio the market price of gold divided by the market price of oil.
The remarkable thing is that in about four decades, the gold and oil ratio as shown above has traded in a well defined range, where the historical average ran at around 15.2. In addition, there were 5 instances in the past where oil outperformed gold which eventually resulted to a reversion to the mean, meaning gold prices eventually caught up.
1. oil will move down back to $30 bbl, assuming gold remains constant at $459.5
2. gold will rise to meet its historical averages at $958 (!!!) while oil remains constant at $63
3. a combination of both or lastly
4. oil would rise in much a moderated clip relative to the advances in the price of gold.
``In an inflationary fiat-paper regime such as the ones that exist in every country on the planet today, money supplies are guaranteed to grow faster than commodities supplies. As relatively more money bids for relatively less commodities, higher commodities prices are the inevitable result. To bet that the GOR is going to suddenly fail is not only to bet against six decades of history, but to somehow assert that fiat-paper inflation will miraculously cease so monetary pressures don’t push up gold and oil simultaneously.”
Gold’s rise in the
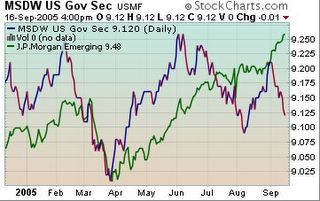
The chart below shows of the Morgan Stanley US Government benchmark (blue line) in a free fall even as emerging bonds, represented by the JP Morgan Debt Fund appears to surge higher even in the face of sharp declines in copper prices (-.65%) for the second consecutive week!
Yet hardly anyone has recently spoken about gold’s latest rise against all major currencies. Have global investors come to realize that the
Larry Edelson of Safe Money Report sees the landmark rise of gold as portentous of the following environment, he warns...
A. Inflation will rise substantially in the months ahead ...
B. Oil prices could be ready to explode again ...
C. The dollar may fall more sharply than anyone expects, and …
D. Some hidden surprise, such as a blow-up in derivatives, could be lurking just beyond the visible horizon.
While I do not intend to make a big fuzz out of it, the latter’s description of a blow-up in derivatives is certainly getting some officials to be ‘overly concerned’ about recent developments, such as investors asking for actual settlement of treasury futures contract, restatement of financial reports by the Federal Home Loan Bank of Pittsburgh due to derivatives, rumors of a derivatives meltdown, the collapse of a hedge fund called Bayou and the US Federal Reserve’s move to rein in derivatives trades through processing backlogs as global hedge funds access to these untested exotic instruments balloon.
Apparently the specter of a repeat of the Long Term Capital Management (LTCM) hedge fund collapse in 1998, has prompted these bankers and FED officials to contain possible ripples, notes Riva Atlas of the New York Times, ``Credit derivatives are bets on whether a company will pay its debts. In the event of a default, the party on the losing side of a trade must compensate the institution that holds the other end of the bet.
``The problem is Wall Street has been overwhelmed in keeping track of these trades - and if corporate defaults, which are at an 11-year low, suddenly rise, it could have a mess on its hands...
``The Federal Reserve called the meeting yesterday to address both a backlog in processing these trades as well as something called assignments, which refers to who holds the contracts at the time they are due.”
You see the world today is absolutely flushed with liquidity, if we are to reckon using Mckinsey Quarterly estimates global capital markets are now at about $118 trillion (bank deposits, market capitalization, private and public debts) while Global GDP is about $40 trillion. With the financial markets about 195% greater than economic output, this translates to a “financial economy” where activities are directed to more paper trading and credit creation, ergo speculative excess, rather than the “real economy” where goods or widgets are manufactured and services are rendered.
A sudden contraction of liquidity due to any proximate causes such as a derivative induced meltdown could cause a breakdown of confidence towards the prevailing monetary system; yet other circumstance can equally generate the same tumultuous conditions such as global central banks realignment of currency reserves, a shift in oil/commodities trading away from the US dollar (Iran’s proposed oil exchange in 2006 purportedly quoted in Euros), a pop in the real estate bubble in the US, a catastrophic war among major economies or a major terrorist strike or cataclysmic natural disaster could all be triggers. Remember while these are all reckoned as low probability events, with ample warnings issued by diverse institutions (IMF, OECD, World Bank) or renowned individuals (Sir John Templeton, George Soros, Warren Buffett, former US Federal chief Paul Volker, ex-US Treasurer Robert Rubin), like the recently tragedy of New Orleans, ignoring them could be costly to your portfolio.
John Hathaway of Tocqueville Asset Management estimated that above ground or physical gold which includes, among others, central bank holdings as well as private holdings through jewelries and stock market capitalization of the global gold mining sector (less than a $100 billion) are at about $1.5 trillion dollars. Considering that global stock market cap and bond markets at about $75 trillion, an allocation of only 1/10th of 1% would translate to 7500 tonnes, equivalent of three years supply of newly mined gold. In the words of Mr. Hathaway, ``Such an allocation would in time cause gold to trade comfortably in excess of 4 digits in terms of US dollars, Euros and just about any other currency as well.”
I know most of you remain skeptical of my view, whereas for your prudent investor analyst gold’s move against all currencies of late represents a critical milestone. It basically epitomizes a tectonic shift in the global financial market landscape where first, as commodity prices race higher, this would largely represent a squeeze in profit margins on higher input costs and possibly through politically inspired legislated wage hikes, second, higher commodity prices via inflation presages an era of higher interest rates or tight money environment and lastly rising gold prices are indicative of greater risks in the realm of financials, economics or politics or a combination thereof. Ignore the writings on the wall at your own risk!


No comments:
Post a Comment