Monday, June 26, 2023

With a 2nd Policy Rate Pause, a Victory Lap for the BSP? Philippine Treasury Markets and the PSEi 30 Slumps


Inflation is a tax. Money for the government. A tax that people don’t see as a tax. That’s the best kind, for politicians—Lionel Shriver


With a 2nd Policy Rate Pause, a Victory Lap for the BSP? Philippine Treasury Markets and the PSEi 30 Slumps  


After the second interest rate pause, the outgoing BSP Chief seemingly declared "triumph" over inflation.  But Philippine financial markets expressed dissent. 


I. The BSP’s Victory Lap over Inflation: "Ending Its Most Aggressive Tightening Cycle In Years" 


Predicting that it contained inflation, the BSP's Monetary Board kept its policy unchanged for a second straight time. 


GMA News, June 22: Following its policy meeting, BSP Governor Felipe Medalla said the Monetary Board kept the key rate for the overnight deposit facility at 5.75%, the overnight borrowing facility at 6.25%, and the overnight lending facility at 6.75%. This comes as the central bank now expects inflation to average 5.4% this year, slower than the 5.5% it projected during its meeting in May, citing the slower increases in prices of food and energy-related items in the past month. 


Businessworld, June 23: PHILIPPINE CENTRAL BANK Governor Felipe M. Medalla said on Friday monetary policymakers had done enough to tame inflation, in his clearest signal yet that the Bangko Sentral ng Pilipinas (BSP) was ending its most aggressive tightening cycle in years. Mr. Medalla said the central bank’s future policy decisions will largely be driven by inflation data, which current forecasts show is on track to settle back within the bank’s 2%-4% target by the fourth quarter. (bold added) 
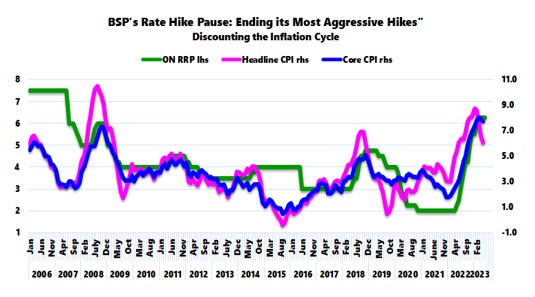
 

Figure 1 


The establishment seems to have forgotten or discounted the "stickiness" of the Core CPI in its forecasts. Figure 1 


Though the outgoing BSP chief seems confident to declare that they have surmounted the inflation dilemma, "ending its most aggressive tightening cycle in years," he contradicted this with a contingent, "largely be driven by inflation data." 


Because data is history, and addressing inflation extrapolates to the future, such mismatch points to the risks of policy errors.  In a word, BSP policies are reactionary 


Since the authorities denied from the get-go the emergence of the inflation crisis and blamed it instead on supply and private sector "hoarding," the BSP—in certainty—will be remiss in their prognosis of the inflation malady.  


The fact that the BSP seems to deliberately ignore the imbalances forged from record liquidity injections, bank credit expansion, and BSP and bank-financed deficit spending translates to the concealment of the primary roots of inflation.  This represents a policy of plausible deniability or "deny knowledge of or responsibility for actions committed by or on behalf of members of their organizational hierarchy." 


Figure 2 
 

For instance, as evidence, there is a tight correlation between the gyrations of the CPI and fiscal spending as well as the BSP’s net claims on the National Government (QE). (Figure 2) 


Aside from these factors that help embellish the GDP, political authorities attain their objectives via increased taxes, expansive regulations, and mandates through a bigger government. 


One can only maintain this privilege by whitewashing the role of the BSP and the Central Government as the source of inflation. 


II. Response to the BSP’s "Rate Pause": Peso Rebounds Slightly, Treasury Yields Surge! 


So did the markets agree with the BSP "pause?"  


The most interesting is the response of the traders of the Treasury markets.  

Figure 3 


This week, BVAL rates rose, particularly in the belly—partly reversing the steep inversions—to flatten the curve.  (Figure 3, upper chart) 


Since June 9, the higher yield and the flattening dynamic have become more conspicuous. (Figure 3, lower chart) 


If such a dynamic holds or even escalates, treasury traders could have started pricing in a comeback of inflation! 

Figure 4 
 

Yet, we see a close correlation between the flows and ebbs of the USD-Peso, CPI, and 10-bond yields. If so, a rebound in the USD-Php should not be a surprise. (Figure 4, upper graph) 


Besides, authorities raised the issue of replacing Libor rates, which serve as a basis for the local Phiref.   


Businessworld, June 22: In the Philippines, the LIBOR is still used for some fixed-income securities available in the market, as well as for interest rate and cross-currency swaps. The Philippine Interbank Reference Rate (PHIREF), which is used for interest rate swaps, cross-currency swaps and some peso corporate loans, is also computed using dollar LIBOR. (bold added) 


Yet, rising Phiref or local interbank FX swap rates point to increasing USD liquidity strains in the banking system, therefore, a higher USD-Php. (Figure 4, lower chart) 


It should also be noted that supply-side issues have also re-emerged.  


The media reported the increasing rice prices and poor fish catch in May. 


III. PSEi 30 Dismissed the Rate Pause; an Ominous Technical Chart; Record Systemic Leveraging 


And it shouldn't be a surprise that with the re-escalation of rates, declining Philippine equities prices reinforced its bear market conditions. 


The PSEi 30, down by 1.76% this week, closed at 6,393.55—a similar low it reached in March 2023 before the bounce.   


Peso volume remains lackluster, while market breadth has been awful.  While the principal equity barometer could bounce off to create an interim 'double bottom,' its long-term prospects seem portentous. 


Figure 5 


For chartists, haunting the PSEi 30 is a bleak 5-year head and shoulders pattern and a one-year rounding top, reinforcing this somber outlook. 


Aside from cash and FX holdings becoming discernible competitors of bonds and equities, current conditions represent a headwind to the economy and the financial markets. 


In closing, it is unclear if the BSP is aware of the impact of the unprecedented scale of financial leveraging in the face of the "most aggressive tightening cycle in years." 


The sum of public debt and universal bank loans is at an All-Time High!   


Higher rates extrapolate to higher borrowing, refinancing, and repayment costs.   And it also translates to amplified liquidity requirements to keep this incredible scale of leverage afloat. 


The Bulls will need Lady Luck on their side badly. 


Sunday, June 25, 2023

Philippine Economy: Bullish Forecasts, Bearish Markets; Volume Precedes Price: The PSE’s Sectoral Performance as Exhibit


The problem is those clinging to a world of artifice lose the ability to deal with the real world. They believe that maintaining their fake facade is a substitute for dealing with reality, and so they lose the practice of dealing with the real world via difficult solutions that demand sacrifices and trade-offs—Charles Hugh Smith 


In this issue 


Philippine Economy: Bullish Forecasts, Bearish Markets; Volume Precedes Price: The PSE’s Sectoral Performance as Exhibit 

I. Cognitive Dissonance from Bullish Forecasts, Bearish Markets 

II. PSE: The Significance of Volume Driven Price Levels: Jan-May Data 

III. Volume Precedes Price: The PSE’s Holding, Property, and Financial Indices 

IV. Price-Volume Index Distortions: Industrials, Services, and Mining 

V. The Other Side of Volume is Savings 

VI. The Fading EPS Boom 


Philippine Economy: Bullish Forecasts, Bearish Markets; Volume Precedes Price: The PSE’s Sectoral Performance as Exhibit 


The Philippine financial markets seem to contradict the avalanche of optimistic economic forecasts.  From the PSE's perspective, falling volume from corroding savings has weighed on price levels. 


I. Cognitive Dissonance from Bullish Forecasts, Bearish Markets 


Despite the constant barrage of rosy forecasts on the Philippine economy, has anyone ever considered why the domestic financial markets have deviated from these?   Or, the falling peso, rising rates affecting fixed-income securities, and even the bear market in stocks have defied them. 


We get it when people become frustrated with their financial investments. 


But the conflicting beliefs and the cognitive dissonance that prevails in the public's mindset spurs confusion and emotional disorders. 


Let us spell out some of the perplexities. 


The prominent description of the domestic economy is that it is consumer-driven. 


But spending means exchange.  It isn't possible to conduct trade ex-nihilo (out of nothing).  The consummation of a trade translates to the interaction of demand (buyer) and supply (seller).  Someone buys or pays for a service or good at an agreed price.  As a medium, money funds such transactions. 


Say’s Law (or the Law of Markets) as explained by the great Ludwig von Mises, 


Commodities, says Say, are ultimately paid for not by money, but by other commodities. Money is merely the commonly used medium of exchange; it plays only an intermediary role. What the seller wants ultimately to receive in exchange for the commodities sold is other commodities. (Mises, 1950) 


There can be no consumption without goods and services. We, therefore, produce to consume.  


Instead, the massive twin (fiscal and trade) deficits tell us the Philippines indulges in profligacy: it spends more than it produces.  And those deficits are funded by taxes, inflation, and credit (domestic, foreign savers, and or fiduciary media).  


It is the same with the stock market.  Each transaction requires funding.  How?  Well, it comes from people's—individuals or commercial entities—disposable income or savings and or borrowings.  


When income grows more than expenses, an individual may allot such surpluses for savings or investments, such as acquiring stocks or (corporate/government) bonds or putting up or expanding a business. 


After all, since investing in stocks requires savings (and/or access to credit), evaluating whether economic conditions would lead to an increase or decrease in savings should be a prerequisite.   


As a side note, local financial markets are anachronistic compared to their sophisticated counterparts in advanced economies.  In this regard, domestic stocks are principally funded by savings.


Some relevant questions: 


Is an inflationary environment conducive to savings?   


Will sustained increases in government spending lead to increases in income and savings or will it only transfer resources from the private sector to the government?  


Will credit-financed asset bubbles lead to the enhancement of the people's standard of living? 


II. PSE: The Significance of Volume Driven Price Levels: Jan-May Data 


With this in mind, let us review how the May performance of the PSE reflects on such dynamics. 


The primary bellwether, the PSEi 30, ended May down 2.23% (MoM), 4.4% (YoY), and 1.36% (YTD). 


Figure 1 


The aggregate 5-month (YTD) peso turnover plunged by 12.03% to Php 694 billion, a low last reached in the 2020 pandemic crash.  (Figure 1, topmost graph) 


But the YTD 2023 volume was 11.62% higher than 2020's Php 622 billion.   


The volume indicated includes special block sales.  


Importantly, the PSEi 30 closed at 6,477.4 last May 2023 compared with 5,838.8 in May 2020, or higher by 10.94%. 


So, volume and index in 2023 were still up relative to the lows of 2020. 


If anything, despite the relentless orchestrated push to get the PSEi above 6,500, it closed lower in May primarily due to the scanty buying power.  


As such, should volume continue to slow, it shouldn't be a surprise that the PSEi 30 would most likely mirror its decline.  


III. Volume Precedes Price: The PSE’s Holding, Property, and Financial Indices 


As chart technicians would say, volume precedes price. 


So how did volume influence prices? 


Partitioning May's volume by sector, the holding firm's sector (18.71%) edged out financials (18.5%) for the largest share. This chart represents May data only. (Figure 1, middle window) 


The leading role of the holding firm represented a trend. 


But the downtrend in the YTD holding firm's volume share since 2014 translates to loosening its grip over the leadership. (Figure 1, lowest chart) 


Figure 2 


The property sector almost took the lead, but the pandemic abruptly abridged the public's interest in 2020.  And so, its share of YTD volume plunged along with its index. (Figure 2, upper window) 


In the meantime, the YTD volume share of financials rallied to the second spot—thanks to the BSP's various bailout measures. (Figure 2, lower chart) 


Considering that both were beneficiaries of the BSP bailout, the paradox was the divergence of market allocation to these interrelated sectors. 


The market pushed financials higher while it sold down the property sector.   


Perhaps, some of this may have involved rotational dynamics—or rebalancing or shifting of equity exposure from the latter in favor of the former. 


The opposing directions of their respective volume, which directed the price level of the indices, exhibited the market's discordant perception.  


Of course, banks were direct recipients of the BSP largesse, while the property sector signified the second-order indirect beneficiaries. 


Figure 3 


From another angle, the sectoral performance relative to the PSEi 30—represented by its ratio—exhibits such contrasting actions.  


While the property sector to the PSEi 30 ratio continued to plumb down to 2016 levels in May, the bank index was a notch below its all-time highs. (Figure 3, topmost graph) 


Ironically, this market may have forgotten that the property sector is the largest borrower of the banks!   


Despite the recent decline, the property sector has the largest share (19.9%) in total bank loans (UC, Rural, and Thrift banks).   In pesos, it was at an All-Time High (ATH) in April! (Figure 3, middle pane) 


Or perhaps, such deviation in the market could have signified the BSP's implicit edict or a collaborative effort of the industry.  


After all, the BSP recently disclosed that Other Financial Corporations (OFCs) were buyers of bank shares in Q4 2022.  Why would OFCs jointly buy bank shares?  Coincidence?  Or has this signified directed action? 


IV. Price-Volume Index Distortions: Industrials, Services, and Mining 


There is an array of price distortions in other sectors. 


The share of the service sector spiked in 2021, while industrials in 2022.   Unlike the financials, unfortunately, the spikes were ephemeral. (Figure 3, lowest pane) 


Figure 4  


Huge special block sales of AP, FGEN, and MONDE propped up the sector's volume in 2021.   EAGLE's tender offer for its delisting also boosted its volume in 2022.  (Figure 4, topmost chart) 


In this respect, because special block sales accounted for off-mainboard trades, the sector's price levels were hardly affected. 


Or, this explains why prices were influenced least by the volume spike.   


The earlier gains signified a spillover from the BSP's injections that percolated into the PSE's broader universe. 


On the other hand, pandemic remote work policies influenced interests in the telcos, which bolstered volume and the services index. (Figure 4, middle window) 


But as the economy reopened, interest in the sector waned upon the recalibration of work conditions into "hybrid" and "return to the office." 


As it happened, radical changes in the political environment materially influenced both volume and price activities. 


Likewise, interest in the mining sector also resonated with the general sentiment.  


But since the sector has been considered highly speculative, magnified volatility, as reflected in price and volume, exhibits this sentiment. (Figure 4, lowest diagram) 


Mining, of course, has the lowest share of volume.  This discussion excludes the SME sector. 


V. The Other Side of Volume is Savings


Figure 5 


In all this, the evidence of the importance of savings exhibited by the corrosion M2 savings, which in turn led to the PSE's deteriorating volume/turnover.  The popular money supply benchmark, M3, illustrates a similar relationship. (Figure 5, top and middle charts) 


Again, unless conditions warrant improvement in disposable income and savings, the PSE will remain under pressure, regardless of how a few entities attempt to manage the PSEi 30's price level—mainly via pre-closing pumps—which, unfortunately, undermines the market's price discovery function. 


VI. The Fading EPS Boom 


In closing, the BSP & PSE published the May price-earnings ratio (PER), which on the surface, looked "cheap." 


But the earnings per share (eps) exhibited a second straight month of decline. (Figure 5, lowest graph) 


Since misstatements of balance sheets seem to have been given a free pass by authorities and the private regulator, this urges us to question the credibility of the published financial performance of listed firms.  


Even if these are accurate, it provides an insufficient perspective of the actual conditions of the corporate bottom line.  


The thing is, debt has driven the PSEi 30’s top and bottom-line growth.   But debt has outgrown income consistently for several years now.   


Even the BSP is aware of this risk. (bold mine, cited chart figures edited)  


Based on the audited financial statements of the 148 Philippine Stock Exchange (PSE)-listed non-financial corporations (NFCs), the growth of interest expense (IE) has outpaced the rise of earnings before interest and taxes (EBIT). In addition to the rate of growth, the ratio of IE to EBIT shows a rise from 14.5 percent at the start of the first quarter of 2016 to 22.6 percent as of March 2019, with a high of 27.8 percent in December 2017. The same companies have also reported lower profitability with respect to return on assets (FSCC-BSP, 2019)  


And that was for the year 2018.  Growth of debt since then has been turbocharged. 


Further, the eps boom depended on a regime of perpetual easy money from the BSP. 


If the age of inflation 2.0 has indeed mounted a comeback, then the free lunch that has backed this artificial boom has culminated. 


___ 

references 


von Mises, Ludwig, Lord Keynes and Say's Law, The Freeman, October 30, 1950, Mises.org  


FINANCIAL STABILITY COORDINATION COUNCIL, 2018 H1–2019 H1 FINANCIAL STABILITY REPORT, September 2019 p 13, bsp.gov.ph