In this issue
The Paradox of Q3 Philippine Banking Conditions: Record Peso Profits as Liquidity Corrodes Dramatically!
I. Record Peso Income Boosted by Opaque Segments of Non-Interest Incomes
II. Record Financial Assets Equals Record Losses and Held-to Maturity Assets, Cash Deflation and Slowing Deposit Growth!
III. Accounting Profits in the Face of Deteriorating Liquidity!
IV. Peddling the "Pivot" to Justify Asset Inflation, Cheap Money as the Foundation of Inequality
The Paradox of Q3 Philippine Banking Conditions: Record Peso Profits as Liquidity Corrodes Dramatically!
Profits of the Philippine banking industry soared by 43% in Q3 from its lending and non-interest operations.
Ironically, the industry's liquidity conditions continue to deteriorate.
I. Record Peso Income Boosted by Opaque Segments of Non-Interest Income
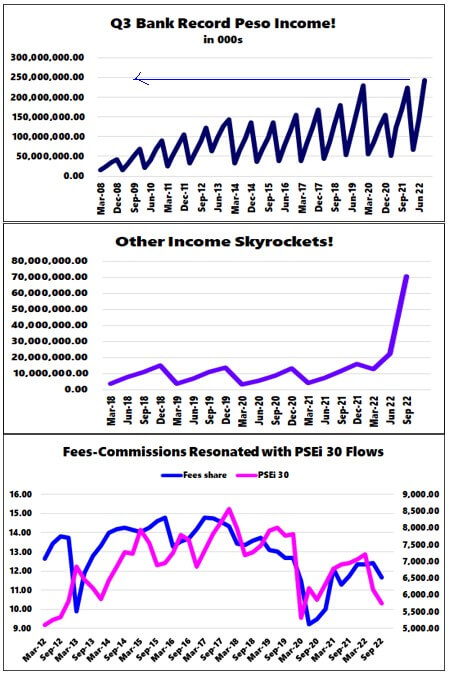
Figure 1
Both engines of the banking system operated at full throttle in Q3. The surge in bank lending boosted net income. Helped by unconventional sources, non-interest also contributed to the bottom line.
Q3's 43% profit growth represents the second-highest since Q4 2021, where the latter reached a 9-year rate.
In peso, Q3’s profit of Php 243.1 billion signified a record high! (Figure 1, highest window)
As a caveat, various relief measures from the BSP, as part of the pandemic rescue measures remain in place, thereby contributing to the statistical distortions. Or, comparing pre-pandemic and pandemic-era statistics represents apples-to-oranges.
Interest income from lending operations grew by 10.3%, while non-interest earnings jumped by 24.9% in Q3.
With non-interest outperforming, its share of the operating income increased to 27.7% from 24.8% in Q2. On the other hand, the % share of interest income fell to 72.3% from 75.2%.
It is the non-interest income segment that caught our attention.
First, the Other Income subcomponent of "Other Income" segment skyrocketed by 515%! At Php 70.5 billion, it comprised a massive 34% share of the non-interest earnings and 9.4% of the industry’s operating income! (Figure 1, middle window)
The BSP categorizes two segments of Other Income: One. Rental from safety deposit box, bank premises and equipment, and ROPA. Two. Miscellaneous income which it "refers to the income which cannot be appropriately classified under any of the foregoing income accounts." (BSP, 2019)
So at a glance, this unusual bloat from an opaque corner of the system helped boosted Q3 income.
Second, fees and commission income grew by 13.06%. But this was primarily a function of the low base effect. The rate of change in the Fees and Commissions has undulated with the PSEi 30. (Figure 1, lowest pane)
Of course, brokering, fiduciary, underwriting & dealership, and securitization services represent the equity-related classifications. There are other non-equity sources, such as payment services, intermediation, custodianship, and others.
Third, trading income spiked by 177.6% to Php 17.1 billion.
But the numbers in the balance sheet depict a different scenario.
II. Record Financial Assets Equals Record Losses and Held-to Maturity Assets, Cash Deflation and Slowing Deposit Growth!
Ideally, the enormous gains should have increased the liquidity of banks.
But that is hardly the case.
Figure 2 First, the banking system reported a sizzling 19.8% growth in Financial Assets to a record Php 6.23 trillion in September 2022! (Figure 2, topmost window)
Ironically, accumulated market losses hit another milestone of Php 126 billion to reinforce its 11-month streak!
So as banks try to boost income via investments, higher rates continue to hound their balance sheets. Record investments (speculations) mirror the record losses!
But remember, banks declared a spike in trading income!
Furthermore, banks camouflaged their mark-to-market losses through Held-to-maturity assets (HTM).
HTM assets rocketed by 57.24% in September, its seventh straight month of over 50% advance! The streaking gains of HTM assets constituted 57.8% of total investments and 17.05% of the industry’s total assets! (Figure 2, middle window)
More than that, the HTM share of total assets expanded to 17.05% to eclipse cash reserves, which at Php 2.72 trillion, represented a 12% share.
But cash reserve conditions are tied to HTMs. The higher the HTMs, the lower the cash. Or, the inability of banks to monetize HTM restrains bank liquidity.
Aside from HTMs, the growth of bank deposits continues to flounder, posting 6.78% in September despite the considerable loan portfolio and foreign deposits expansion. (Figure 2, lowest pane)
Accelerating FX deposit growth (14.7%) could be a symptom of capital flight.
That is to say, other factors in the balance sheet have vacuumed and offset the liquidity from bank credit expansion.
III. Accounting Profits in the Face of Deteriorating Liquidity!
Figure 3
Supported by emergency relief measures, easing NPLs has not helped either.
Paradoxically, though NPLs have cascaded, bank loan-loss provisions have not kept pace with the former's decline. Or it has declined less than the NPLs. Why do banks keep such buffers elevated? (Figure 3, upmost pane)
How substantial is the disparity between actual and statistical credit impairments? Or is this a sign that banks are expecting more?
Perhaps, loan loss provisions could be a more accurate gauge of compromised or delinquent loans.
Likewise, diminishing BSP bank reserves from RRR cuts, which should have boosted liquidity, have barely helped. (Figure 3, middle window)
As part of its "supply-side containment," the BSP has been scaling down its net claims on the central government. Or the BSP has been reducing its public debt monetization program.
But this has yet to be reflected in its assets (as of June).
On the contrary, the banking system's net claims on the central government continue to expand but have decelerated. (Figure 3, lowest window)
Said differently, on the surface, the BSP has engaged in tightening while banks continue to finance the record fiscal deficits.
The BSP embraces contrasting positions like sustaining easing financial conditions via credit card interest caps while tightening via rate hikes.
Figure 4
And to bridge the liquidity and (perhaps collateral) gap, banks have suddenly turned to short-term T-bills borrowing! (Figure 4, highest pane)
T-bill borrowings spiked by 77.44% YoY last September.
Interestingly, despite the massive operations by the BSP through its securities, T-Bill rates have been raging! (Figure 4, middle window)
So, the non-financial listed members of PSEi 30 have not only been on a borrowing spree but banks too.
The takeaway, the contrasting conditions between liquidity and earnings exhibit a bottom line based on accounting wizardry.
IV. Peddling the "Pivot" to Justify Asset Inflation, Cheap Money as the Foundation of Inequality
Considering that rising rates should slow bank credit expansion (law of demand), this leaves investments as the remaining organic source of liquidity and earnings. Bank lending has responded with a slowdown from the BSP rate hikes of 2011, 2014, and 2018. (Figure 4, lowest window)
And the 2022 hikes have been the most aggressive in history!
Yet, once the skeletons in the closet of the sector re-surface, the BSP will come to the rescue.
And perhaps for such reasons, banks and financial institutions may have been ramping up asset prices (FX, PSE and Treasuries), rationalizing a forthcoming US Fed-led central bank "PIVOT".
The BSP chief has signaled that their rate hikes should slow.
Ironically, rising asset prices should signal easing conditions that go against the essence of the BSP tightening.
Financial institutions may be resorting to extensive gearing to push asset prices higher. In turn, this should amplify the demand, specifically centering on the financial sector, which should have a spillover effect on others. The subsequent feedback should be on the prices of the real economy.
But aside from the interest cycle, the mainstream seems to have forgotten that there are second-order effects through solvency/insolvency conditions.
So there you have it.
The BSP gambles with asset inflation (bubbles), hoping it will save the day for the banks and financial institutions.
Before closing, here is a revealing observation of the interest rate distribution from an elite.
Inquirer.net, November 17: He added that most MSMEs borrow from thrift and rural banks under micro-financing programs that offer fixed interest rates, adding that these entrepreneurs who have locked-in rates will be unaffected. “Most MSMEs pay higher rates, unless they are prime borrowers, like us. For MSMEs, the loan rates are in the double digits,” he said, specifying these can range from 2 percent to 3 percent a month. (bold added)
Through the banking system, the "zero-bound" policy rates of the BSP act as a protective moat of "prime borrowers" against the competition to secure economic dominance.
And as the primary recipient and beneficiary of money supply expansion (Cantillon Effect), it is also a source of redistribution in favor of the government and the "prime borrowers" at the expense of society.
Cheap money represents part of the implicit "trickle-down" dogma of the BSP.
And why do you think the Philippines has one of the highest inequality rates in the world?
As a parting note, do you recall the effects of the 2018 7-month 175 bps rate hikes?
From the late BSP Governor, Nestor Espenilla Jr.:
While there is no definitive evidence of a looming crisis, it is also clear that shocks that have caused dislocations of crisis proportions have come as a surprise. What is not debatable is that repricing, refinancing and repayment risks (3Rs) are escalated versus last year and this could result in systemic risk if not properly addressed in a timely manner (Espenilla, 2018)
What could be different this time?
___
References
BSP, FINANCIAL REPORTING PACKAGE FOR BANKS May 31, 2019, bsp.gov.ph
Espenilla Jr. Nestor, 2017 FINANCIAL STABILITY REPORT, p.27 June 2018, bsp.gov.ph