Sound money and free banking are not impossible; they are merely illegal. Freedom of money and freedom of banking... are the principles that must guide our steps—Hans F. Sennholz
Q2-1H 2023 Philippine Banking Financial Performance Paradox: Booming Profits, Decaying Liquidity
In this issue
I. Booming Banking System’s Profitability: Concentrated on PSEi 30’s Three Banks, But Slower Q2 Growth
II. Booming Profits, Decaying Liquidity: The Cash Reserve Perspective
III. Mounting Liquidity Strains: Substantial Drop in Investments and Bank Lending Growth in Q2
IV. Despite Sliding Rates. Held-to-Maturity (HTM) near Record Levels, Compounding Pressures on Liquidity
V. Liquidity and Funding Strains: Booming Profits, Falling Deposits; Banks Pile Up on Treasury Bills, the Bottoming of NPLs?
VI. Conclusion: The Essence of Contradictory Signals; the Yield Curve Predicted the "4.3% GDP Shock," and "Managing Confidence"
Q2-1H 2023 Philippine Banking Financial Performance Paradox: Booming Profits, Decaying Liquidity
Despite showing signs of a slowdown, the profit growth of Philippine banks reportedly boomed anew in 2Q & 1H. Ironically, the industry's liquidity strains, manifested in almost all aspects of their balance sheet, continue to deepen. Which to believe?
I. Booming Banking System’s Profitability: Concentrated on PSEi 30’s Three Banks, But Slower Q2 Growth
Philippine banks have been booming!
That's what the establishment has been telling us.

Figure 1
First, the banking system's income growth rate, which includes trust and rural banks, slowed to 24.7% in Q2 after three blazing consecutive quarters of over 30%. (Figure 1, topmost graph)
Operating income growth, which blasted 56.2% in Q2 from the latest lending binge, hit an all-time high, even as both net interest income growth decelerated sharply from 24.2% to 17% and non-interest income slumped from 8.3% to -7.8%. (Figure 1, middle window)
If history should rhyme, rising rates eventually weigh on profitability, despite regulatory subsidies channeled through various relief measures implemented by the BSP for the banking system.
Second, the Return on Equity (RoE) and the Return on Assets (RoA), the BSP's two major profitability KPIs, reached a ten-year high (Q4 2013 level) in Q2 2023, a milestone! (Figure 1, lowest chart)

Figure/Table 2
Third, the profit growth of the PSE-listed banks grew by 10.17%, which pulled down the 1H growth rate to 22.14%, consistent with the BSP's data trend. (Figure 2, upper graph)
But the notable portion is the divergence in growth rates (24.7% versus 10.17%), which implies enormous gains for non-listed and government banks. Landbank and DBP reported 1H net income growth of 2.7% and 60%, respectively.
But beneath the headlines, there has been a wide disparity between the growth performance of PSEi 30 member banks, non-PSEi banks, and the eight banks of the nine-member Financial Index, which posted increases of 26.3%, -12.2%, and 7.7%, respectively.
If anything, the materially skewed distribution reveals that the top 3 PSEi 30 banks (BDO, BPI, and MBT) collectively contributed 67% and 66% of the published net income in Q2 and H1. Six of the 16 listed banks, including PSEi 30 member UBP, showed a decrease in Q2 profits.
A reminder, the BSP seems to have adopted a vague stance on the extent of normalization from the relief measures it previously implemented to ease bank reporting, operating, and capital disclosures. By allowing leeway on delinquencies, these measures "boosted" bank profits.
To put it more precisely, this dramatic divergence reveals that with limited participation, the profit boom was for the headlines: a veneer.
And even among banks, the trend has been towards centralization—widening disparities between the elite banks and the smaller players and the expanding share of the former.
II. Booming Profits, Decaying Liquidity: The Cash Reserve Perspective
If banks have been enjoying a profit bacchanalia, in theory, liquidity expansion should follow within the industry and the economy.
But why are banks and the economy exhibiting antipodal conditions?
First, why the deterioration in bank asset growth?
Bank asset YoY growth, which has been in a downtrend since 2013, has bounced back from the 3.9% lows of April 2021. It peaked last March'23 at 11.3%, then the recent descent. Its growth rate plummeted from 9.27% in May to 6.95% last June! (Figure 2, lower chart)
So, does this signal a reversal of the "bear market rally" in the Bank Asset growth rate?
Bank assets comprise three principal categories: cash reserves, investments, and loans.

Figure 3
Bank cash reserves contracted by 3.14% YoY in June, extending its downtrend, reflected in its share of total assets. Cash reserves in pesos slid to January 2020 levels, effectively eradicating or consuming the surplus from the BSP's historic liquidity infusions (2020-21). (Figure 3, topmost graph)
The mounting shortfalls in cash reserves represent a symptom of an ongoing liquidity crunch.
III. Mounting Liquidity Strains: Substantial Drop in Investments and Bank Lending Growth in Q2
What has caused this crunch?
The growth of bank investments and total loan portfolio (including Interbank and Repo lending) tumbled sharply from 12.7% in May to 8.41% in June and from 10.14% to 6.7%, respectively. (Figure 3, middle diagram)
In % share, cash (12.1%), investments (29.3%), and loans (52.84%) constitute 94.24% of the total as of June. (Figure 3, lowest chart)

Figure 4
Though financial assets (96% of investments) remain adrift near all-time highs, the recent mitigation of published market losses has stalled and may have reversed! Market losses as of June? Php 88.9 billion: an increase from Php 75.125 billion a month ago. (Figure 4, topmost chart)
Declining loans extrapolate to reduced money supply expansion.
Reflecting bank cash reserves, the YoY surge in the BSP's currency issuance slipped from 4.5% in May to 4.08% in June despite the recent bounce in bank lending. (Figure 4, middle window)
The BSP's historic injections (2020-21) spiked currency issuance growth then.
A side note: the BSP has yet to publish its depository survey statistics; in lieu of the money supply, we use currency issuance data.
And aside from the banking industry, the pullback in currency issuance affected parts of the economy that experienced reduced credit access. And that's part of the reason for the 4.3% GDP shock.
Market losses from investments also deplete liquidity from the banks.
The thing is, this isn't the pulse of a profitable banking industry.
IV. Despite Sliding Rates. Held-to-Maturity (HTM) near Record Levels, Compounding Pressures on Liquidity
And there's more.
Despite sliding Treasury yields, banks continue to escalate their portfolio holdings with Held-to-Maturity (HTM) assets, which reached near-fresh highs last June. HTMs, as repeatedly discussed, represent an accounting method to evade mark-to-market losses.
Here are two excerpts from the BSP's Financial Stability Report (FSR) to refresh our memories on the relevance of HTMs on Bank liquidity conditions.
From the 2017 FSR (all bold mine)
Banks face marked-to-market (MtM) losses from rising interest rates. Higher market rates affect trading since existing holders of tradable securities are taking MtM losses as a result. While some banks have resorted to reclassifying their available-for-sale (AFS) securities into held-to-maturity (HTM), some PHP845.8 billion in AFS (as of end-March 2018) are still subject to MtM losses. Furthermore, the shift to HTM would take away market liquidity since these securities could no longer be traded prior to their maturity (FSCC, 2018)
From the H1 2018-H1 2019 FSR
While one can take comfort that the formal LCR regime has started at high levels, one should also appreciate that taking out securities booked as HTM will reduce the LCR. As of end-2018, majority of the HQLA stock of Philippine banks are in the form of holdings of government and non-government debt securities and bank reserves. The former securities include those that are HTM and thus, not intended to generate cash flows from trade. Deducting the HTM debt securities from the HQLA will lower the LCR. (FSCC, 2019)
HQLA means High-Quality Liquid Assets; LCR means Liquidity Coverage Ratio
The gist:
1) HTMs represent a lock-up of assets, therefore, signifying a drain on bank liquidity.
2) HTMs represent a means to evade mark-to-market valuations (concealing losses).
3) HTMs lower high-quality assets (HQLA) and reduce liquidity coverage (LCR), which increases liquidity and interest-related risks
As of June 2023, HTMs accounted for 17.2% of total assets, only 2% away from its all-time high last February 2023. (Figure 4, lowest chart)
The other reason for the record high on HTMs is that it reflects the persistent liquidity operations (also at record high) of banks funding the government via the net claims on central banks (NCoCB).
We await the publication of this data by the BSP to update the NCoCB’s relationship with HTMs.
V. Liquidity and Funding Strains: Booming Profits, Falling Deposits; Banks Pile Up on Treasury Bills, the Bottoming of NPLs?
The decline in asset growth mirrors liabilities, whose growth rate fell from 9.1% in May to 6.84% in June.

Figure 5
Growth of total deposit liabilities, which accounted for 87.2% share of the total liabilities, stumbled from 8.25% in May to 5.98% in June. (Figure 5, topmost graph)
Both growth of local and FX deposits slowed sharply from 7.82% to 6.04% and from 10.6% to 5.67% over the same period, respectively.
Deposits growth has been in a downtrend since 2013, representing another sign of deteriorating liquidity conditions.
Also, rising rates have pulled higher bank funding costs, which implies a forthcoming squeeze on their interest spread that should pressure bank profits. (Figure 5, middle window)
Ironically, higher rates have barely affected the public's interest in placing their money in banks—exhibited by the lackluster deposit growth.
If funding from deposits has slowed, where do the banks get money for their operations? The short answer: from the capital markets.
Banks have increased borrowings via T-bills, indicating a shift in duration preference—prioritizing short-term liquidity requirements. (Figure 5, lowest chart)
The PSEi 30 banks accounted for 62.9% of the aggregate listed banks' T-bill borrowings in June 2023.
Higher funding costs from T-bill borrowings could magnify mismatches in maturity transformation, exacerbating liquidity, interest, and credit risks.
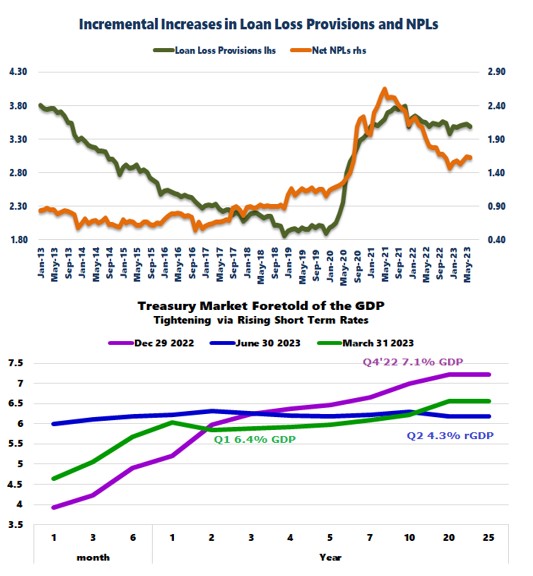
Figure 6
Finally, NPLs (along with loan provisions) have likely found a bottom and appear to be creeping higher. (Figure 6, upper graph)
Elevated inflation, high rates, and a slowing economy (stagflation) should increase NPLs despite the remaining or residual relief measures instituted to ease the bank's burden.
And because liquidity strains have been building up on fundamentally all fronts of their balance sheets, the BSP aggressively cut the bank's reserve requirements ratio (RRR) by 250 bps last June.
Therefore, we should expect this to boost bank cash reserves in the coming months.
But since the unprecedented liquidity boosters, embodied by the Php 2.3 trillion injections, didn't last because it doesn't address the root issue, so shall this.
VI. Conclusion: The Essence of Contradictory Signals; the Yield Curve Predicted the "4.3% GDP Shock," and "Managing Confidence"
And there you have it, a flagrantly discordant and ambiguous picture of the banking system.
It's supposed to be profitable. But only for a handful of banks.
In contrast, liquidity strains have been in every corner of their balance sheets, which prompted the BSP to cut RRPs substantially that released funds into the system.
Even more, distortions from these relief measures and other accounting methods, such as HTM, are likely to warp the accuracy of data.
That is to say, published profits may represent mainly "accounting profits."
Again, why would a profitable industry suffer from liquidity strains?
The yield curve, for the longest time, has ventilated this liquidity predicament.
Interestingly, the sharp flattening and partial inversion/negative yield curve at the close of June seems to have predicted the 4.3% GDP shock. The end-of-the-month data doesn't cement its causation but presents its underlying logic. (Figure 6, lowest chart)
Further, the mass purchases of bank stocks at the PSE by Other Financial Institutions (OFC) in Q4 2022 and Q1 2023 paints an ambiance similar to China's "national team" attempt to "manage" the equity prices intended "to shore up confidence."
In conclusion, as commented last June,
Add to the record HTMs, the BSP's liquidity dilemma has further been reinforced by the declared mark-to-market losses, rising NPLs, slowing credit expansion, and "higher for longer" rates.
This bank liquidity predicament represents a symptom involving a broader spectrum of economic malaise: diminishing savings/capital consumption and deteriorating productivity (expressed via hidden losses in response to policies that have spurred invisible redistribution).
The thing is, economic reality eventually exposes "extend and pretend" or "kick the can down the road" statistics and market prices.
The PSE's deteriorating volume is a testament to the buildup of these imbalances.
____
References
Financial Stability Coordination Council, 2017 FINANCIAL STABILITY REPORT, Bangko Sentral ng Pilipinas, June 2018 p.24
Financial Stability Coordination Council 2018 H1–2019 H1 FINANCIAL STABILITY REPORT Bangko Sentral ng Pilipinas September 2019 p.45
Prudent Investor, Why the BSP Cut the Philippine Banking System's Reserve Requirement Mandate June 18, 2023, Substack, Blogger