OVER the short term, developments in the global and domestic financial markets have fallen squarely to what I have projected for it; particularly of the continuation of the violent shakeout as well as some signs of an intuitive countertrend reaction or of a rebound.
During the last two weeks the Philippine benchmark or the Phisix has lost about 217 points or about a considerable 8.66%, while one may argue that recent events may signify signs a “typical profit-taking” in the eyes of the rabid optimist, the degree and intensity of the recent selling has not been your average “profit taking” but one of the extremes or found most commonly during the bear market cycles or the declining phase of a stock market cycle.
And as mentioned in our previous outlook, the gamut of events has been a globally coordinated one such that the recent selloffs have been seen across the wide spectrum of asset classes.
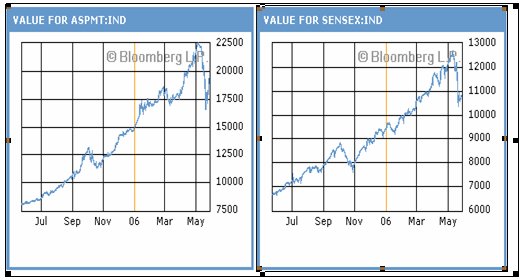
Just to give you an example, Bloomberg’s Michael Tsang reports that the some of the world’s best performing bourses as Russia and India were compelled to undergo a trading halt to forestall the massive declines, ``Russia and India, among the best-performing markets in the past year, have fared even worse. The Russian Trading System Index has slumped 20 percent since reaching a record on May 6, trimming its gain for the past 12 months to 110 percent. India's Sensitive Index has lost 14 percent of its market value since closing at its highest ever level on May 10. The measure surged 65 percent in the past year.
“On May 23, exchanges in Russia and India halted trading for an hour as prices plunged, while the Micex Stock Exchange in Moscow closed 15 minutes early. The declines helped send the MSCI Emerging Markets Index to its biggest loss in two years.”
Figure 1: Price movements in Russia’s Moscow Times and India’s Sensex (Bloomberg)
Of course, nothing beats visualization. As Figure 1 show, the Russia and India’s recent meltdown after coming off its liquidity-driven heights.
Figure 2: MSCI Emerging Free Index and Phisix
Figure 2 Morgan Stanley’s emerging market index (red line) falling to its critical support level (blue horizontal line) while the Phisix (black line) likewise bouncing off support levels (red horizontal line).
What I am trying to say is that the accentuated gyrations or dislocations have led major financial market bellwethers drifting near sensitive threshold levels. Albeit, present signs of relief, as shown above and below (US Dow Jones), indicate that instead of outright submission or simply falling apart, the bulls appears to have regained some momentum to counteract on the bearish uprising.
Figure 3 Dow Jones Holding Off
And this consolidation or signs of ‘indecision’ have remained so, as similarly evident in the bond and currency markets.
Despite slight indications of amelioration, my outlook has basically remained the same; considering that the risk environment remains high relative to returns, potentials of higher cost of money relative to prospective returns (19 central banks raising rates including the Bank of Canada) and more fools than money making opportunities, makes me extremely cautious and risk averse at the moment.
Nevertheless, the recent rebound could imply that one or two trading sessions does not a trend make or in parallel terms, that the latest volatility could even be an anomaly to the general upside trend. Until we see further concrete signs of stability I’d remain generally underweight unless specific “trading” opportunities arise.
Deutsche Bank: Fed’s Monetary Approaches Equals Different Outcomes
I recently argued that instead of the conventional inflation bogey bandied around by mainstream media, a possible global economic growth slowdown spurred by the US (transmitted via slowdown in US real estate industry), derivative based liquidity withdrawal or possibly a contagion arising from hedge fund losses cutting out margin positions as possible culprits to the recent shakeout.
Deutsche Bank's Asian Macro Strategy (lifted from Fullermoney.com) seems to somewhat echo on my views (emphasis mine)...
``Our macro risk model sees this sell-off as a consequence of a deteriorating global growth/liquidity environment. However, the model is not short because our growth/liquidity overlay is not yet signaling sufficiently weak growth to trigger a short;
``However, the growth/liquidity overlay is deteriorating rapidly - so rapidly, in fact, that there is a strong likelihood we shall enter a new business cycle phase within a matter of weeks or even days;
``In this next phase - which we dub the early slowdown phase - markets reverse the way they react to growth. Weak growth switches from being a negative to a positive. We typically see an aggressive short squeeze and a final blow-off rally in this phase. This happens because markets come to accept that growth is slowing but find encouragement in the "promise" of potential Fed easing;
``Assuming we do enter this phase, we expect to see the markets consolidate above critical support and rally into the August/September timeframe;
``Please note, however, that our macro model sees significant risk that a bear market will eventually unfold if the growth deterioration persists. The risk of an eventual bear market becomes more pronounced if the Fed embarks upon further rate hikes. Our model suggests a Fed funds rate of 5.75% would be sufficient to bring on a bear market;
The anticipations for a FED easing have been floated for most of the second part of the early semester of the year and have led to a liquidity driven rally spread throughout the various assets throughout the world until the past two weeks. While Deutsche Bank sees a growth slowdown as the common denominator on the risk side, the countervailing repercussions arising from “expectations” of a possible Fed easing (a relief rally from short covering) or from further hikes (an unraveling bear market). In both instances, the risk factors appear to be “weighted” than prospective returns.
Merrill Lynch: Dead Cat’s bounce on Bullish Outlook
Merrill Lynch’s Emerging Market Outlook (Outflows = Lows) also lifted from fullermoney.com equally stresses on the emerging risk prospects but at a much ‘subdued’ level (emphasis mine),
``Inflows have ceased and modest redemptions have begun. According to EMPortfolio.com, EM equities have just had one of their worst weeks for fund flows this year. Inflows slowed to just $43 million (compared with weekly average of +$1.6 billion) and investors pulled money from both GEM and EMEA funds in the week to May 17th.
``Leveraged funds have shifted decisively from long to short and global equity mandates have reduced their emerging market exposure considerably. High daily levels of volumes indicate that non-dedicated investors have moved quickly to greatly reduce exposure. Less "greed" is a good thing. But investor positioning does not yet suggest that a quick return to the EM bull market is plausible. Sentiment is not "irrationally pessimistic" and the "buy-on-dip" spirit has not been broken, in our view. Moreover, we are yet to see the massive fund outflows which normally signal a decisive market low. The May meltdown best mirrors the 21% sell-off in EM in April/May 2004, both in terms of speed, magnitude (see Chart 4) and causation (risk aversion, rate tightening fears, EM FX and debt markets in a spin and so on)...
``So while we do not see the inflation or the U.S. dollar collapse to predict the bull market is over, our reading of investor positioning and sentiment today argues that a modest dead cat bounce is the best we can hope for in coming weeks (as was the case in 2004).
In other words, the recovery prospects recovery on the emerging market class as described by Merrill Lynch is likely to be one caution or “U-shaped” recovery rather than of an abrupt one (“V-shaped”). BCA Research Hedge Emerging Market by Shorting Metals
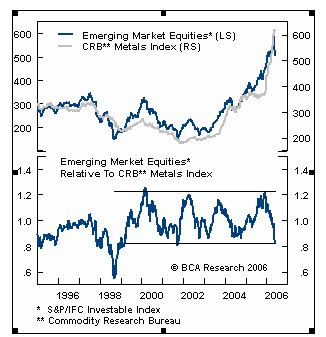
BCA Research, on the other hand recommends emerging market investors to “hedge” their portfolios via taking on “short” position on metals instead of liquidations...
Figure 4 Emerging Market vs. CRB Metals
``We are still positive on EM stocks over the long haul, but the near-term turbulence could persist. A possible strategy to reduce risk for EM equity investors is to go short the CRB metals index as a hedge. EM stocks closely track the industrial metals index, due to the sensitivity of both to global growth. However, the gains in metals have outpaced EM equities by about 25% this year. In addition, there seems to be a well-defined cycle in EM equity relative performance against the metals index. The sharp drop in the ratio of the two indexes appears to have set the stage for a reversal, leading to a period of metals underperformance.”
BCA remains largely bearish on copper over the near term on the outlook of possible weakness from the demand story out of China.
Jim Jubak: Yen Carry Tumult
And there is also the Yen Carry trade factor previously discussed in my Apr 24 to 28, edition, (see Improving Your Portfolio Returns by Seeing the Unseen), where I mentioned that Japan’s monetary base has been bloated by its government to “reflate” the economy (even larger than the US), whose monetary policies (Quantitative Easing ‘QE’ and ‘ZIRP’ Zero Interest Policy) has led to massive exports of capital outside Japan to the tune of $1.8 trillion(!!!) or something like 15% of US GDP or 3% of US assets.
According to Jim Jubak MSN Money editor, writing for thestreet.com “How Japan Sank the US, (emphasis mine),
``Now that the economy is finally growing again and now that prices aren't sinking any longer, the Bank of Japan has given two cheers to the return of inflation and has started to remove some of that cash from the financial markets.
``In the last two months, the bank has taken almost 16 trillion yen, or about $140 billion, in cash deposits out of the country's banks. The country's money supply has fallen by almost 10%. The Bank of Japan isn't finished pumping out the liquidity that it had pumped in. That should take a few more months. And when it is finished, the Bank of Japan is expected to start raising short-term interest rates.
``The moves to date by the Bank of Japan aren't enough to radically diminish global liquidity, but they are enough so that the investors who have fed some of the world's riskier markets understand that the trend has turned.
In other words, some of the massive amount of leverage employed using the Japanese Yen as source funding for the hunt of yields across global assets could have been recently curtailed by the rising prospects of Japan to “normalize” its monetary policy.
In effect, Japan’s turn to tighten its monetary screws could have possibly let off a wave of destabilizing domino of deleveraging off the world’s financial markets!
Trader George Kleinman: Bullish Gold Prospects
Finally, one sanguine outlook comes from veteran commodities trader, Mr. George Kleinman. The impetus of the recent corrections in Gold has mostly been due to the unwinding of open interest defined by cme.com as the ``Total number of futures or options on futures contracts that have not yet been offset or fulfilled for delivery.”
As shown in Figure 5, while Gold had been reaching fresh 25 year record highs in mid May, open interest diverged with its underlying prices (blocked arrow bottom window) reflecting that “smart money” had been liquidating while weaker hands had been taking over.
Figure 5 Gold and Open interest courtesy of George Kleinman
On the other hand, the present decline in Open Interest is a possible sign that weak shorts have been bailing out.
Mr. Kleinman observes,
``OI is now down to approximately November 2005 level, around the same point where gold broke above $500 for the first time in more than 20 years. That began a $200-per-ounce bull run. This is potentially very bullish for the gold market.
``Here’s another way to look at it: When the last of the weak longs has liquidated (and the last of the strong shorts--the “smart money”--have covered their profitable short positions), there’s a lot of room for gold prices to move back up. The next bull run will unfold as OI is being built back up.
``As soon as OI and the per-ounce price start to rise again in unison, I look for the next leg up to begin. I think we’re very close to a major new buying opportunity in the gold market. The last leg took gold up about $200 ounce, from about $530 to about $730. Assuming $636 turns out to be the bottom, a similar up move would take gold to more than $800.”
And what has this “Gold” got to do with emerging markets? Figure 6 courtesy of stockcharts.com gives away the correlation so far between gold and the MSCI Emerging Free during the past three years. A correlation is a correlation until it isn’t.
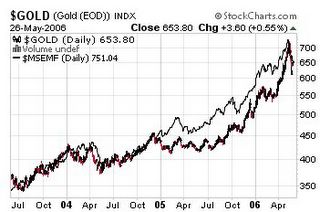
Figure 6 Stockcharts.com: Gold vis-à-vis Emerging Markets
In essence, while today’s global financial markets reveal of heightened risks as detailed by the richly diverse outlooks of the distinguished institutions and personalities mentioned above, there are possible divergences in assets that may unveil itself in the fullness of time.
If indeed Gold, as a barometer given its present strong correlations between the performance of emerging assets and the monetary metal, could be seem to bottom out in the interim, the odds are that emerging markets could follow suit and may outperform anew as Gold seeks new highs in spite of the present uncertainties. It all boils down to alternative investments or fleeing from paper based assets.
In the invaluable words of the prescient commodity oracle, Mr. Jim Rogers, ``During a time when many of the world’s largest economies were in recession in the 1970s, oil prices increased several fold. The UK went bankrupt during that period and had to be baled out by the IMF. But oil and commodity prices boomed. Another major boom in commodities started during the depths of the Great Depression, in 1933. That was arguably the worst collapse in global demand in history. Global trade fell more than 50%, yet that was the start of a long commodities boom.”
I have been patiently waiting for such a divergence to meaningfully unfold.


6 comments:
Dear Sir,
If a slowdown in growth is possible, is it time to cash in the chips, take your losses, stay out of stocks or shift to short term gains? Whats the calculated play and whats the gamble?
You pose a tricky question, Mr. Du. In the realm of frequency or probability, what you have here is an asymmetry; particulary an asymmetry in odds and outcomes, where "the average survival has nothing to do with the median survival" to quote mathematician Nicolas Taleb.
Asymmetry in odds suggest that the distribution of probabilities is not a level 50-50% but with one aspect of the probability higher or greater than the other while asymmetric outcomes mean that the payoffs are not the equal.
Quoting Taleb, "Assume I engage in a gambling strategy that has 999 chances in 1,000 of making $1 (event A) and 1 chance in 1,000 of losing $10,000 (event B).
Event Probability Outcome Expectation
A 999/1000 $1 $.999
B 1/1000 -$10,000 -$10
Total -$9.001
"My expectation is a loss of close to $9 (obtained by multiplying the probabilities by the corresponding outcomes). The frequency or probability of the loss, in and by itself, is totally irrelevant; it needs to be judged in connection with the magnitude of the outcome. Odds are that we would make money by betting for event A, but it is not a good idea to do so."
In essence, given the present risk environment, are you willing to make a bet on the probability of risking the magnitude of the outcome (absolute returns) or make a bet on simply on the odds?
Dear Sir,
Thank you for your reply. Taking that perspective, it would seem to be common sense to follow the odds and cut the losses. But there is a time element at hand. Back in the Asian crisis 1997-1999, i noticed that If i stuck to a cetain stock with PE ratios less than 10X at purchase, these stocks, within a 2 to 3 year period, would eventually go up 60% to 200%. It happened again in 2002 to 2004. My theory is that, just as nature cannot stand a vacuum, the market cannot stay in one place for too long. Either foreign buyers start to return, or the big local players start to speculate on certain industries. Are these trades just luck, or is there a stochastic element in my favor? Call me an optimist, but as Paul Samuelson once said, buy at "maximum pessimism".
Mr. Du,
Time element goes hand in hand with risk taking. In the words of Peter Bernstein, "Risk and time are opposite sides of the same coin, for if there were no tomorrow there would be no risk. Time transforms risk, and the nature of risk is shaped by the time horizon: the future is the playing field."
After all, as per the instance you mentioned, there is what you call as "market cycles".
Dear Sir,
I find your comments good eye-openers. But referring to your article on Commodities and Emerging Markets. I thought stocks and commodities should have low correlation? Also, looking at the bigger picture, the US Trade deficit is now 7% of GDP and back in February 2006 was predicted by epinet.org, needing to devalue by 30 to 40% more. If this does not occur, won't more people divest of their dollars and go into alternative investments, causing a trickle effect into Emerging Market stocks ? Or will the Retiring Baby boom population, who could be risk averse, stick to their guns and take a conservative stance?
Best regards,
Mr. Du,
Since the Fed opened the liquidity sluice gates in June 2003, assets across all spectrum globally behaved almost in unison. This phenomenon, simply too many money chasing too little profits, could be construed as "monetary inflation".
In the past, commodities had low correlation with conventional assets as stocks or equities, I think in the future we will see such meaningful divergence unfold.
Post a Comment