Monday, December 25, 2006

Prudent Investor’s Hits and Misses; Projections for 2007

``All man's troubles come from not knowing how to sit still in one room.” Blaise Pascal

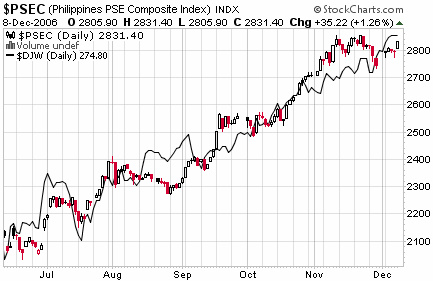
While I remain bullish over the long term with the Phisix (10,000 Phisix...conservatively) as well as with the Peso and would not discount a potential mania to top out the present cycle, I am inclined to think that there could be a significant correction over the interim, possibly anywhere 10-25%; remember the Phisix is an illiquid market by global standards and illiquid markets translates to above par volatility (high beta), and that the Philippine markets could possibly stage a strong rebound during the latter half of the year.

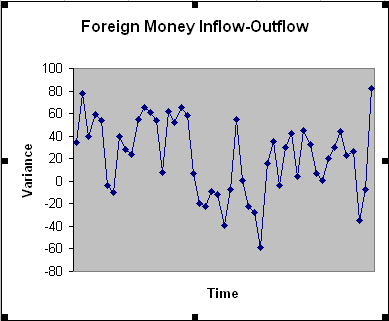
All this will essentially depend on the developments in the US dollar [I know the Euro will surpass the US dollar as the most circulated currency] as a fundamental driver as well as, the US financial markets which has, in my view, been the focal point of cross-border capital flows, and the inspirational paradigm to the world equity markets during the last quarter of 2006.

I do not foresee present day decoupling by Asia vis-à-vis US (see November 20 to 24 Asia’s Soaring Markets: A Matter of Decoupling from the US?) yet, although in the long run this is a likely trend to emerge founded on an increasing degree of trade and economic linkages aside from efforts to regionalize and from growing interlinkages in the financial markets...barring the risks of a resurgent tide of protectionism.

The Phisix could possibly end the year on the negative or trade sideways where gains or losses would unlikely top 5%.

I have been right with gold having reached the $600-650 level (closed at $604.9) which I forecasted early this year see Jan 02 to 06 2006 (2005 Recap and Blemishes: 2006 Still For Mines and Oil) and forecasts the potential of gold to decouple soon with its industrial metal siblings. Gold’s latest decline has been attributed to diminishing “inflation” concerns and to a surging US dollar.

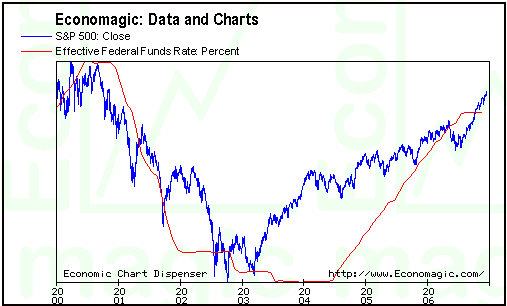
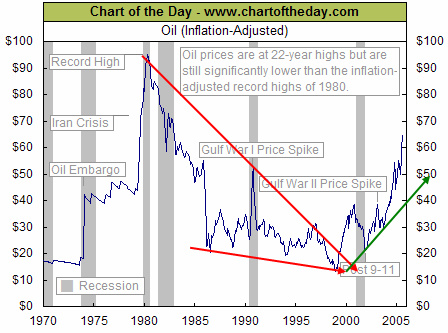
If the market savants such as the world’s Bond King Bill Gross are right to predict that the US Federal Reserve will cut rates from 5.25% to 4.25%, I can see gold topping the $700 at the close of 2007, alongside another key commodity, crude oil possibly in the $60 to $70 mark, this despite a worldwide slowdown on possibilities of greater than expected “peaking out” of maturing fields (for as long as the world does not enter into a depression-where all bets are off).

Meanwhile the US dollar index would possibly close lower for the year but at a much subdued loss than in 2006 possibly at 5% or less.

Because the PSE made substantial adjustments to the composition of the Phisix subsectors which took effect last January 2, 2006, I based the yearend returns on the first day from which the changes were adopted.

The mining sector which I predicted as the best performer for 2006 came in a very close second with gains of 65.2% to trail the Holdings at 66.67%. The other sectors came in the following order, Property 51.12%, Service 45.71%, All index 45.13% Banking 35.07% and CI 19.34%.

Unlike other mainstream analysts whose fungible views are dependent on the present activities of the market which they use to project into future, I remain steadfast in my projection that the juvenile mining sector has the potentials to draw even more investments, considering the “nationalization” efforts undertaken by several resource rich nations (Bolivia, Russia, Venezuela, Mongolia & etc..) which in essence reduces potential supplies on stream, and makes the country even more a compelling supply chain participant.

Of course, our projections are based on the sustenance of a “mining friendly” climate, that should be able to draw on foreign investments and generate more corporate stories and activities that would drive local investors into the mines.

And this should include the power and energy sector which has undergone years of intensive underinvestment, aside, from the much neglected agriculture based investment themes-arising from declining supplies of arable land due to growing desertification trends, a looming water crisis in various parts of the world, growing industrialization in emerging markets, demographic and urban migration trends as well as demand for agriculture products which used to be solely for food is now in competition as feedstock for alternative energy and most importantly, the growing consumption trends by rapidly developing emerging markets economy.

Furthermore, while many world markets have seen a boom in real estate, the Philippines has squarely lagged behind. Yes, I remain bullish too with the local real estate industry as well as the domestic (global) infrastructure theme, as both the rising peso aside from years of underinvestment as key potential drivers to these industries.

Another compelling investment theme would be the rapidly growing “sunshine” Business Process Outsourcing industry (BPOs), a beneficiary of today’s supply chaining trends in globalization. A global economic growth slowdown should benefit BPOs more as companies attempt to reduce costs and outsource more of their non-sensitive business processes. Also watch for companies that would benefit from various outsourcing/offshoring patterns, as well as beneficiaries from growing trends to integrate financial markets.

Finally, it is never good to discount that the Philippines sits on a wealth of potential high value tourism spots given its 7,100 islands, rich historical background and diverse culture. As Asia is more likely to prosper backed by the trends of growing intra-region linkages, tourism investments are likely to expand.

Wednesday, December 20, 2006

On Thailand's Financial Markets Bloodbath

One of the fundamental risks in today’s world is the rising tide of protectionism. As in the case of Thailand which prospered under more liberal settings in the past, the recent imposition of capital controls to limit foreign money movements and rein the Baht’s appreciation, I think is grounded on a faulty premise. Where money is not treated well, the natural reaction would be an exodus.

Mainstream economists whose analysis influence policymakers are wont to believe that rising currencies curb exports. While such is a textbook dogma, the reality is different. Rising currencies of many Asian countries for several years hasn’t curtailed exports, so as with many Latin American and European countries. What you have is a global phenomenon of rising currencies and rising volume of exports, the probable reasons of which I may write about soon. In short, policymakers have been barking at the wrong tree. Exchange rates are usually made by policymakers as scapegoats for their inefficiencies. This is the same premise adopted by US politicians in pressuring China to appreciate its yuan to appease some sectors of its society. As always, political grandstanding equals the law of unintended consequences.

It was an ASEAN contagion as a general response to Thailand’s fiat as of yesterday. The premise is that what occurred in Thailand could be a model for other Asian emerging markets. However, I think such worries are overrated. Maybe the markets, having climbed to a vast degree, are seeking for reasons to correct, which could be a sign of exhaustion.


P.S. Following the dramatic bloodbath, the Thai Government has made a ludicrous U-Turn, according to CNN

"The Thai government performed an abrupt U-turn on Tuesday after the stock market suffered its worst fall in 16 years as foreign investors pulled the plug in response to drastic measures to rein in the baht.

"Hours after the central bank rebuffed a plea from a stunned stock market chief to withdraw them, Finance Minister Pridiyathorn Devakula announced equity investments would be excluded from the restrictions, starting Wednesday.

Well, that's what to expect from governments.


Sunday, December 17, 2006

Phisix have been Driven by Mostly Macro Not by Micro Forces; Evolving Role of Financial Markets

``Accuracy of observation is the equivalent of accuracy of thinking." Wallace Stevens, American Poet, (1879-1955)

Correlation doesn’t necessarily translate to causation, but I hope those who adamantly insist that the activities in the Phisix is borne out of “micro” factors can explain the tight association among these key benchmarks; namely the Phisix, the Dow Jones Industrial Averages and the Morgan Stanley Emerging Free Index, as shown in Figure 1.


Figure 1: Stockcharts.com: Phisix’s Tight Correlations with DJIA and MSEMF

The chart over a timeframe spread of one year and 6 months shows of an almost lockstep movement by the PHISIX, the DJIA (behind) and the MSEMF (lower pane). The MSEMF is an index of emerging markets bourses.

The arrows above points of major inflection points, which has strangely occurred in simultaneous fashion. Observe too that even during periods of consolidation, the contours in general have been tightly similar.

Mainstream analysts with their elaborate presentations continually assert that the present progress in the Philippine financial markets have been due to domestic economic and political factors. While I do not deny that such variables could have abetted the current conditions, does this sufficiently explain such closely knit relations? Apparently not.

One may even recall that political tumults as the July 2003 Oakwood incident, the 2004 Presidential elections and the GARCI scandals have all failed to deter the rise of the Phisix. Oddly enough, it even found such events as springboard to its present state, a case of Wall Street’s favorite tenet “climbing a wall of worry” perhaps?

Well again all these do not explain such correlations. And when we are far from the true drivers of the market, our tendency is to misinterpret, which could lead us to fatal investing decisions.

For starters, we have to consider the framework of the Philippine Stock Market where the fluxes of foreign capital have had a significant contribution. In fact, they represent a majority, relative to total Peso volume turnover, as shown in Figure 2.


Figure 2: PSE: Foreign Capital Makes Up the Bulk of Turnover

The above chart, with special thanks to JM Ian Salas of the PSE for the data and Wilson Chong for the Chart, shows of the foreign money share representation to the total turnover, which had been over 50% since 2002 on a regular board exchange basis and since 2003 on a total basis or inclusive of special block sales.


Figure 3: PSE: Net Foreign Inflows Has Driven the Phisix since 2003

Figure 3 is a representation of the net foreign transaction or the inflow or outflow of foreign funds. Please take note that foreign inflows have been in a growing trend since 2003 on a regular or board exchange basis. While on a total basis or inclusive of special block sales, the uptrend has been from 2004.

And if you think that this has been limited to the domestic arena, let me show you of Thailand’s SET framework, the more liberal among our neighboring bourses in terms of internal data disclosure.

In Thailand, LOCAL RETAIL investors have been the dominant force. However, foreign capital flows have likewise been significant but to a lesser degree. Let me elaborate.


Figure 4: SET: Transactions by Investor Type

Figure 4 shows of Thailand’s share distribution by investor type over a period of 10 years. I’d like you to note of the trend of foreign investor take-up has been growing (light blue bar) since 2003 at the expense of local retailers (dark blue bar).


Figure 5: SET: Average Daily Turnover

In Figure 5, one can take note of the growing intensity of foreign money into Thailand’s bourse as measured in volume. This means that the increase in daily turnover has been mostly due to a more substantial rate of change growth from foreign money flows into the SET.

Here are some important facts of note:

1. Thailand’s market cap is USD 127 billion at the end of 2005 compared to the Phisix’s at over USD 43 billion today.

2. Thailand’s population is about 65 million compared to around 85 million for the Philippines.

3. The Average daily turnover of is a whopping USD 409 million in 2005 against a measly the Philippines USD 30-60 million today!

4. Local RETAIL Investors constitute the majority of investors; although on a declining trend relative to market share, but has likewise increased in terms of nominal volume since 2003.

5. On the other hand, Foreign Money constitutes a significant growing minority!

6. According to IMF data, Thailand’s Stock market cap to GDP ratio is about 68% as compared 34% of the Philippines.

When economic analysis centering on comparisons about certain countries omit the financial market aspects, then it is not representative of a meaningful picture or analysis.

Why? Today’s global economy is much more dictated by the financial world than the actual exchange of widgets and services. Global Market Cap for the collective stock market is said to be at over USD 43 Trillion which is almost the same scale as today’s Global GDP.

Combined, the world capital markets broken down into sovereign bonds, corporate bonds, bank deposits and mortgage securities are at over an estimated 1.7 times the world economy!

Now relative to Thailand, the breadth, depth and sophistication of its financial markets signifies that their domestic capitalists had been successfully able to channel savings into the required investments to achieve their present state.


Figure 6: Bloomberg: Thailand’s SET (blue) and Phisix (green)

In other words, the Thai stockmarket has meaningfully contributed in bolstering its economy and elevated the financial and economic state of its citizenry to achieve its present prosperity. Such that, despite the recent political turmoil, the sizeable participation of local investors makes it less prone to the sways or volatilities in the global market as shown in Figure 6.

Moreover, Thailand’s conduciveness to the business environment or a market-based economy can be seen with its 18th ranking in World Bank’s Doing Business, compared to the Philippines which ranked at 126th and in Heritage.org’s index of economic freedom where Thailand ranks 71st “mostly free” relative to the Philippine’s 98th place “mostly unfree”.

The lesson here is that the financial markets contribute substantially to state of economic progress, especially in the present evolutionary structure of a global finance-based economy. This should effectively translate to having more of our citizenry participate in the development of our capital markets in order to achieve our desired prosperity. Markets and not politics make prosperity.

Going back to our initial topic of tight correlation, this [Thai-Phil example] likewise reveals that when a country’s bourse is mainly reliant on the activities of foreign capital rather than of domestic investors, its direction is subjected to the sentiment, volatilities and dynamics of global fund flows.

Investors who continue to immerse themselves into the illusion that the local factors have been the key determinants of the domestic market will be left holding the proverbial “empty bag” or would be caught “swimming naked” when, to paraphrase Mr. Buffett, “the tide goes out”.


Figure 7: Economagic: US FED Fund Rate and the S & P 500

No markets are essentially single-variable/dimension determined over the long term, although in one instance or another, a variable may outweigh all others given their influence to the collective investors.

One of the most crucial factors that I’ve been repeatedly arguing for as major drivers to our financial markets or of the worlds’ is of global liquidity.

When the US Federal Reserve fretted upon the shadows of a Japan-like Deflation bugaboo, following the technology bust in 2000, they undertook an aggressive massive campaign to flood the world’s monetary system with surplus money and credit. The Fed took down its interest rates to its lowest levels in about half a century, as shown in Figure 7. This essentially prompted investors to take upon massive leverage worldwide in different trading forms, such as the widely known CARRY Trade.

Notice that all the indices mentioned above found their bullish stimulus almost synchronically in 2003. It likewise appears that almost all variants of asset classes [bonds, collectibles, stocks, commodities and real estate] around the world have responded to the US Fed’s easing.

Yes, the FED did take steps to increase its interbank lending rates 18 times to 5.25%, from its trough in June 2003, but essentially in nominal figures it remains lower compared to the past.

One should not forget that the present monetary system is based on the US dollar standard and that policies encompassing the US dollar have greatly weighed on the performances of various asset classes, if not among economies.

Yet, another supportive role of today’s fiat money based asset economies has been the increasing importance of new financial instruments, such as structured finance and the various strains of derivatives, aside from the technological innovations in the areas of information and communications which have transformed and enabled real-time money flow platforms that has essentially facilitated global money flows using the click of a mouse.

Denying these seismic changes in today’s world is a recipe to obsolescence and subsequent loss of capital.Posted by Picasa

PNOC’s Debut Lures More Foreign Money; Rising Dow, Buoyant Peso Lifts Phisix

``Each believes easily what he fears and what he desires."-Jean de La Fontaine French Poet (1621-1695)

As of today, the bullish run of the Phisix has been substantially reflective of the performances of the global markets. As the US Dow Jones set new records (+1.12% week-on-week), the Phisix (+.88%) has knocked on the portals of its resistance highs and could go about setting new highs in the coming weeks.

This week’s huge inflows of foreign money (a startling P 12.25 billion!) have been mostly due to the very successful PNOC Exploration listing (+34.375%), an issue whose foreign take up I had gravely underestimated. PNOC’s fundamentals have been very impressive at least, but given the performances of its peers (yes, here I was guilty of extrapolating the past for the future), and the likelihood of the prospects of an interim “top”, I have been wary of the possibility of mistiming. Besides, short term gains are for those with especially high risks appetite!

Further, there have been sporadic chatters about the risks of a huge IPO listing siphoning liquidity out of the market. As I have been arguing about liquidity driven markets, the PNOC experience, which raised about P 16.2 billion from its listing, simply proved that there had been simply too much money out there chasing for returns, both in the domestic and the international sphere, as the Phisix continued its upward trek in contrast to some expectations of a liquidity drain.

Anyway, since successful investing in the market is mostly about opportunities management, there are even more propitious opportunities in the offing given the present secular phase of today’s domestic market.

As an aside, last week I pointed out that while local investors who appear to be on a selling mode, foreign money continued to pile on local assets, where I argued the latter would influence the former. It appears that such observation came true as the number of traded issues and number of trades combined with the general market breadth improved considerably to manifest of improved sentiments from local investors.


Figure 8: Bullish Peso supports the Phisix

Anyway, the continuing bullish case for the Phisix has largely been from the appreciating Peso which closed (+.61%) at 49.365 on Friday to break its 2002 high. Remember that we have been bullish on the Peso and made our case (see November 29 to December 3, 2004 edition The Philippine Peso’s Epiphany?) two years ago or even before mainstream analysts saw the obvious.

The Peso hasn’t been much of a factor to the Phisix until 2005, where as shown in Figure 8, peaks of the Phisix coincided with the peaks of the Peso or troughs of the USD/Peso.

The interim bearish factors for the Phisix today, which as shown above is highly dependent on foreign capital, are mostly due to exogenous risks as mentioned previously, the record low volatility and extremely complacent global investor sentiment and frothy market action, the technically overbought conditions, growing divergences of a Dow Industrials relative to the Transports, and record levels (1987 highs) of insider selling in the US markets.

Aside from of course, fundamental “fat tail” risks from a greater-than-expected global economic growth slowdown, rising tide of protectionism, an abrupt fall or a US dollar crisis, a nuclear war, global pandemic or perhaps a meltdown of global credit house of cards. For the meantime, any reversals could be more cyclically driven than structurally based.

Given the near closing of the season which has likewise underpinned today’s upbeat outlook here and abroad, I would be very cautious about positioning into the market, and surf the momentum instead.

Given too, the periodicity of the rally here and overseas, which is about nearly half a year already, as noted previously, we could be at the near end or at the maturity of the present cycle which heightens our risks profile while at the same time limiting our returns potentials.

Remember that no trend goes in a straight line and today’s bullish cycle could end sooner rather than later.

Yet of course, one cannot discount a speculative blow-off top as a culmination to the present cycle, yet as we surf the tide we need to tighten our stops, especially as the markets gets frothier.Posted by Picasa

Sunday, December 10, 2006

Foreign Money Drives Phisix Higher; Purchasing Power Reflects on Government Policies

``The precipitous drop in the dollar shows how investors around the globe are very concerned about American deficits and debt. When government policies in a fiat system are the sole measure of a currency’s worth, the currency markets act as a reliable barometer of how those policies are viewed around the world. Politicians often manage to fool voters and the media, but they rarely fool the financial markets over time. When investors lack faith in the U.S. dollar, they really lack faith in the economic policies of the U.S. government.”-Congressman Ron Paul, Texas

In a rather buoyant climate for world equities, upbeat sentiment levitated our Phisix, alongside most equity benchmarks, to a remarkable 1.54% advance over the week to regain most of its losses following the two consecutive weeks of retreat, as shown in figure 1.


Figure 1: stockcharts.com: Phisix and Dow Jones World Index

Bullish action in global equities has once again provided the stimulus to pump up the Phisix to possibly test its interim resistance at the 2,850 levels.

For this week, let’s talk market action. Market action measures the breadth of activities within the market, which gives us an insight about the prevailing investor’s sentiment. A favorable market action implies signals of either a continued strength from a previous upside momentum or a positive reversal from previous declines and vice versa.

For instance, even as the Phisix has been consolidating since it hit its high at 2,853 last November 10th; the advance-decline ratio has been decelerating or has markedly downshifted since mid-October as shown in Figure 2.


Figure 2: Declining Advance-Decline Ratio

The shift to lower gears (red arrow), which is a representation of divergence from a sturdy uptrend of the Phisix, could have been a signal of the recent correction.

Even with the week’s hearty gains, the advance-decline spread has notably been in favor of decliners all throughout the week. This suggests of a noteworthy deterioration of bullish activities in the general market, but apparently confined to LOCAL investors.

How can we say so?


Figure 3: Year-to Date Interim trends of foreign money activities

As much as the declining advance-ratio seemingly presaged the recent correction, the declining trend of foreign inflows over the same period of time, see Figure 3 (red arrow), conspired to send the Phsix to its present state.

However, last week ostensibly marked a reversal, foreign inflows made a pronounced comeback (blue arrow)! Representing 54.67% of the cumulative output, foreign money poured Php 1.876 billion into the Philippine Stock Exchange!


Figure 4: Year-to-date Inflow-Outflow Differentials

Figure 4 shows of the number of issues that posted foreign inflows minus outflows. Not only have these [buying activities] been limited to mostly Phisix issues, the widening spread indicates that the foreign accumulation had been broad-based, and at its highest level for the year! So what you have here is not only factual growth in terms of foreign fund inflows in nominal aggregates but manifested on a broad market based too!

If you ask me why locals have been bearish lately, I wouldn’t exactly know. Needless to say, mainstream analysts would easily impute them to current events, especially to politics. Maybe so or maybe not.

If there is any reason why the local investors have lagged behind in terms of market performance, it is unlikely that locals know more than foreigners do (if they do, they haven’t been proven right since 2003), but rather locals have been obsessed with misplaced priorities.

The local’s proclivity for politically based solutions has mainly ignored the prism of growing interlinkages of the world economies and finance. Where the economic wellbeing of the populace is determined by the dictates of politicians and not by market forces, we are likely to be condemned to repeat the past mistakes.

The developments in the Philippine Stock Exchange serve as a prominent example. Illiquid by global standards, foreign money flows have been the structural drivers of the PHISIX’s turnaround since 2003. Illiquidity translates to volatility, where illiquid issues tend to outperform in bullish cycles and vice versa. The outstanding gains by Philippine financial instruments, aside from stocks, in the debt markets have also been driven by immense portfolio flows. The Peso’s advance has been, at the margins, likewise a manifestation of these massive fund inflows.

Yet, local investors perceive that the advancing Phisix as mostly an offshoot to recent “micro” economic or “corporate” developments or of political “reforms”. Little of our investors have come to understand the dynamics of macro-based liquidity spillovers or of global trends that would naturally uplift the Philippines’ economic and financial state provided it lives up with its unique or “specialized” role in the global marketplace. For instance, the ongoing wealth transfer (as manifested by the declining USD) and economic makeover among emerging markets have resulted to higher commodity prices and investor’s taking up “illiquid” assets as mainstream investment themes, themes practically unheard of one or two decades ago.

Notwithstanding, the colossal revolution in the financial markets arena appended by technological innovations have deepened global capital markets which has facilitated more “real-time” fund flows.

Mainstream economic analysis in the local arena has largely omitted the influences of the global financial realm to our economy as they mostly deal with tangential issues. To consider, what has been ignored is that today’s world economic construct has been largely “finance” based rather than “real” based.

And naturally, tangential issues revolve around politics. Because it is the nature of people to want the order of things simplified, tangential issues, which are frequently symptoms of an underlying malady, are in many instances misidentified as causes, heavily amplified by media. And the easy way out have been always political-based solutions which without ever having second thoughts about the laws of unintended consequences, ignores the fact that history has been littered with its baneful effects.

And who pays for it? Of course us, the belabored tax paying public. No amount of statistical charade by any government instituted index can shield policy and regulatory failures as manifested through the reduction of the domestic currency’s purchasing power. While governments can manipulate markets, these cannot be done so with real purchasing power. Not in the US, Europe, Asia or elsewhere in the world. Ultimately, real purchasing power reflects on accrued government policies!

Now going back to the stock market, since local investors have largely lagged behind on the activities of foreign investors, any provisional follow-through activities by foreign money on the local market will likely lead to ‘bearish” local investors to join the “bullish” fray (habitual apostasy?) to buttress the broader market, over the interim. Posted by Picasa

Watching Global Liquidity Amidst A World Economic Slowdown

``Political risk is no respecter of boundaries, and First World country politics could get increasingly ugly in the coming years as demagogues come to power and Western welfare regimes implode. That means we'll have to absorb some volatile swings… but it won't stop us from making good money.”- Justice Litle

I made my case in my previous edition, Should You Invest in the Phisix Today? (See Oct 23 to 27 edition), where I believe today’s bullish interim cycle is close to its maturity, subject to risks of correction from the market cycle’s mean reverting tendencies, aside from risks of arrant complacency and a murkier economic outlook for 2007.

However, global liquidity remains an insuperable force for the global financial markets, which means, what we want to watch is how global financial markets react to liquidity flows while global economies rollover following 4 years of exceptional performances.

So far global liquidity remains unblemished. ``While US commercial banks continue to provide lots of liquidity to the domestic economy, US mutual fund investors continue to do the same for both the US and overseas stock markets. These investors poured $592 billion into mutual funds over the past 36 months through October. They've done very well for themselves. The net asset value of US mutual funds increased $2,232 billion over the past three years to $5,670 billion. So, net capital gains totaled $1,641 billion over this period. Over the past 36 months, $333 billion, or 56%, of the inflows into US mutual funds poured into funds that invest overseas”, comments the ever Panglossian Dr. Ed Yardeni of Oak Associates Ltd.


Figure 5: Yardeni.com: Massive Fund Flows into Global and Emerging Mutual Funds

Figure 5 shows of the massive liquidity spilling over into the world and emerging market equity mutual funds.


Figure 6: BCA Research: Emerging Markets Preparing for a breakout

An even more bullish liquidity based outlook from the widely respected independent research agency, BCA Research, as shown in Figure 6.

Let me quote BCA (emphasis mine), ``Emerging equity prices have yawned lately at weakening growth numbers out of the U.S., China and emerging Asia, even amid technically overbought market conditions. This is an indication that the structural forces of multiple expansion are at work, which will diminish the ability of decelerating growth to inflict substantial damage. Hence, while a near-term correction in prices cannot be ruled out, it will be very mild and possibly even lateral. Meanwhile, other factors remain positives for emerging market stocks. Our measure of global excess liquidity, which typically leads trends in emerging market stocks, points to their outperformance over the next 18 months. Bottom line: investors should start boosting their exposure to emerging market equities on any softness.”

Of course, the assumption from BCA and Dr. Yardeni is that the US would manage to successfully “soft land” its economy or attain the “Goldilocks” (not too hot, not too cold) scenario in the face of a sizably decelerating real estate industry. Aside, they likewise expect that the FED would effectively steer clear from a recession through its monetary policies. In short, they both trust the bureaucracy to succeed at their mission. I don’t.

I am a skeptic of governments. One, a soft landing in the US has been a statistical outlier. And most importantly, the recent admission of Fed’s Bank of Dallas President Richard Fisher of their recent policy “shortcomings” reveals of the “comforting odds of their policy successes”, Doug Noland quotes Dow Jones newswires (emphasis mine), ``If the U.S. Federal Reserve had been aware of actual inflation prior to its recent tightening cycle, policy would probably have been more restrictive sooner, the Fed’s Bank of Dallas President Richard Fisher said… If we had had the correct figures at the time, we probably wouldn’t have kept interest rates so low, for so long,’ Fisher is quoted as saying by the German daily Handelsblatt newspaper… ‘In hindsight, one is always the wiser,’ he said, noting inflation at the time was higher than was visible from the then-available data.” Well, in hindsight, yes. But tomorrow is another matter.

While I agree with both that the Fed and global central banks would strive to keep liquidity ample and maintain loose environment conducive for the furtherance of asset inflation, and being bullish over the long-term over emerging market assets, I wouldn’t dare underestimate the potential risks arising from a paroxysmal unwind from a greater than expected economic slowdown (recession) or a prospective credit crunch from debt overload. Posted by Picasa

Dow Theory: The Emergence of a Divergence?

``Fools try to prove they are right. Wise men try to find when they are wrong.”-Dickson G. Watts

Finally, in my past edition, Excess Liquidity: Finding a Home in Assets Despite A Looming Slowdown (see Oct 23 to 27), I wrote of divergences which may presage for a much needed “healthy” correction,

``Even some argued further, that the Dow Transports which if based on the Dow Theory has so far failed to confirm the rise of its sibling index (Figure 5), aside from arguments that the Dow’s rise has been due to its structural composition being mainly price-weighted...Yes, the Dow and other key US benchmarks are likewise in strenuously overbought conditions and may retrench as they find an opportunity to do so, but my point is unless we see a genuine divergence, or moving in the opposite direction in contrast to the DJIA, by one or some or a combination of the other indices, to wit, the Nasdaq, the S & P 500, the NYSE, Russell indices or the Dow Transports, et. al., it would be impractical to dismiss outright the actions transpiring in the US equity markets as a nonevent.”


Figure 7: stockcharts.com: Dow Theory Divergence?

Then, I refused to join the ranks of the bears calling the rally seen in the US markets as “artificial”, given that it has inspired a worldwide phenomenon of rising equity market benchmarks.

Today, it appears that the 5-month inspirational run by the major benchmark, Dow Jones Industrial Averages, see figure 7, has been unaccompanied or is visibly undergoing some divergence as evidenced by a retrenching Dow Transports (upper pane).

Further, the Dow Transports seems to manifest of a bearish head-and-shoulders pattern (three arrows). Moreover, on the lower panel, the Dow Utilities index has likewise appeared to have rolled over.

The Transport’s Index failure to confirm its sibling’s (the Industrial Averages) test of its recent highs highlights the risks of a “top”. This will be further accentuated by a non-confirmation of the Utilities Index.

For the meantime, while it is too early to call for an inflection point, we will observe in the coming sessions for the continuity of the incipient deteriorations seen in both the Transports and Utilities Indices. Until such will be demonstrable enough to weaken the advances of its major benchmark counterpart the DJIA, we will simply tighten on our stops. Posted by Picasa

Sunday, December 03, 2006

Falling US Dollar Fuels Rising Oil Prices!

``So gold went down because of Volcker and high interest rates and oil went down because of increased supply and also high interest rates. In other words, it's best to think of commodites themslves as money, whether it's oil or gold or wheat.”-Eric Janzen iTulip

One of the more curious episodes in today’s global financial markets is the hullabaloo over the energy dynamics.

Amidst the recent price decline of oil and gas prices as well as its sibling metals, mainstream commentators and analysts piled atop each other to claim the “bursting of the commodity bubble”. Their arguments centered on a single dimensional premise that “higher prices translate to higher supplies”.

While, of course, there is merit to such argument; however, the oil economics is apparently more complex than what is commonly assumed by the public.


Figure 1: stockcharts.com: Oil’s Double Bottom?

For starters, like the currency and interest rate markets, the oil markets operate NOT under free markets, but are heavily distorted by collective government’s hand.

In short, political expediencies dictate on international oil economics more than the other way around. As a result, the increasingly opaque state of market realities leads to a more pronounced investment-underinvestment cycle. For instance, the lack of transparency among the actual reserves by oil-producing states implies for inaccurate forecasts for the supply side of the oil economic equation. The world’s largest oil field, Saudi’s Ghawar was said to have been last audited for its “field-by-field” proven reserves estimates in 1975!

In my previous outlook, courtesy of Jeff Clark of Growth Stock Wire (please see Lagging Mines: Not For Long I Suppose October 16 to 20), he pinpointed that Oil stocks found their seasonal bottom in October since 2001 and has consistently done so. Such seasonal strength could be playing out today, as Oil stocks, as represented by the OIH benchmark, appears to have signaled a rebound in oil prices, represented by the (WTIC) West Texas Intermediate Crude, as shown in Figure 1. The WTIC benchmark leapt 7% over the week.

The double bottom formation appears to indicate a firming momentum for oil prices going forward and may attempt to test its July 14th record high close of $78.71 per barrel over the coming months.

It has been a previous concern of mine that the recent decline of oil prices could have reflected a weakening of demand from the two major growth engines of the world, particularly the US and China. However, the asynchronous signals emanated from the different asset markets, particularly the performances from the base metals group and global stocks, have confounded this concept.

Altogether it seems that far from real economics, global liquidity appears to dictate on the present whereabouts of the diverse asset markets. Put on a different lens, it is not merely demand-supply dynamics that drives world economies today but of the endless creation and intermediation of money and credit (such as structured finance, carry trades, derivatives) that creates an illusionary demand channeled through asset inflation. It has increasingly been a “finance-based” highly levered global economy rather than “real” based one.

Today’s rally in crude oil comes in the face of a supposedly “negative” development for the energy benchmark....above average inventories! According to Bloomberg (emphasis mine), ``Crude inventories fell 360,000 barrels to 340.8 million barrels last week, the Energy Department reported on Nov. 29, leaving supplies 14 percent above the five- year average.”

Yes, crude oil inventories fell this week but are way above its 5-year average, yet oil prices rallied. Why? Bloomberg suggest a simplified answer, ``OPEC decided in October to reduce output by 1.2 million barrels a day starting in November to halt sliding prices.”

You expect OPEC, the purveyor of 40% of today’s oil supplies, to fulfill its avowed mission? Over the past years, the member countries have repeatedly cheated on each other, to pad their reserves in order to get a bigger slice of sales quota. Does one expect them to comply today, given present “high revenue” opportunities? Yet at the end of the day, it’s all about the color of money, isn’t it?


Figure 2: Rallying Commodities Fueled by the Enervated US Dollar

If they [collective oil-producing governments] can’t be candid enough to reveal their true state of proven reserves estimates, can we yet trust them to act on helping resolve the world’s energy or global financial or economic imbalances? How keeping data confidential from each other ever lead to mutual cooperation, beats me? If you trust governments, I surely don’t.

Which leads us to the next premise, the falling US dollar. Does today’s news likewise carry the rational that the collapsing US dollar has been ONE of the major catalysts for today’s rallying oil? Apparently not.

Figure 2, shows you that in the past three years, all peaks of the commodity benchmark, the CRB Index, have coincided with a trough in the US dollar Index. In 2005 where the US dollar staged a mighty rebound (marked by the uptrend in the upper pane and the two vertical lines), the CRB’s gains had been contained. It appears that today’s rallying oil prices has once again mirrored the travails of the US dollar.

Why so? Given that the demand-supply dynamics of a commodity (oil) is in equilibrium, this should translate to a price level which neither goes up or down. However, the fall of purchasing power of the underlying currency (traded in US dollars) causes the price level of the commodity (oil) to go up. So in essence, it is not only your typical supply-demand dynamics that influences oil but also the state of the purchasing power of the US dollar!

Simply, a falling US dollar translates to higher oil prices!

Let me quote Elliott Gue of the Energy Letters, ``The really big jump in demand came from the Asia Pacific region. The entire region, including Japan, China and India, accounts for less than 30 percent of daily demand for crude, but it accounted for well over half of the total jump in demand over the past five years. Trying to forecast global oil prices is really a matter of trying to forecast the future path of economies in the region; Asia is where the marginal demand for energy commodities will come from.”

In other words, if the Asian region constituted the “marginal demand” that has driven oil and commodity prices to these levels, its trend of firming currencies, which equates to lower oil prices, should further push demand to even greater levels that should offset any softening from the US.

Further yet, while commodity bears habitually make a comparison to the tech bubble, commodities are real assets compared to simply equity or financial based assets. To paraphrase investment maven Jim Rogers, gold or oil or commodities in general cannot go to zero, while shares in Enron can (and did)!

Of course, that is conditional on oil or gold or other commodities not being “grown on laboratories” similar to the miracle of the printing press where money can be issued limitlessly. Where something scarce and something abundant is compared for value, obviously the scarcer one gets the higher rating. As Voltaire. (1694-1778) once said, “Paper money will eventually return to its intrinsic value - nothing”.

So higher oil prices are not solely a function of demand and supply dynamics but also a manifestation of the US dollar’s declining purchasing power! Posted by Picasa

Oil’s Supply Side Constraints

``Nixon Administration officials were convinced that cutting the dollar's tie to gold and devaluing it against other currencies would increase our exports, slash imports and give us a fabulous round of prosperity. Instead, unhinging the dollar from gold gave us more than a decade of debilitating inflation, catastrophic increases in the price of oil and record-high interest rates.”-Steve Forbes

Well today’s rising oil prices is coming amidst further signs of deterioration in the US economy (growing signs of stagflation???)...


Figure 3: Economist: Spiraling Housing Inventories

Housing inventories in the US are scaling higher as shown by the Economist chart, see Figure 3. This denotes of a further downdraft in the housing industry. Cycles take time to unfold. This will not be an exemption, especially one that has been inflated by credit excesses.

According to the Austrian School of economics, recessions would begin at the “higher stages of production and not on the consumption stage”. And this had been the case in 2000, let me excerpt Mr. Gerard Jackson of Economic editor of BrookesNews, ``On 22 January 2004 the Joint Economic Committee’s Vice Chairman Jim Saxton pointed out that unemployment in manufacturing had been rising over a longer period. The unemployment situation was confirmed by the ISM’s manufacturing employment index which in 2000 had fallen below 50, showing that employment was contracting in manufacturing was still falling. The committee also reported that consumer spending continued to expand throughout 2001.”


Figure 4: Northern Trust: ISM Manufacturing Falls Below 50!

From Northern Trust’s Ms. Asha Bangalore ``Readings below 50.0 denote a contraction in factory activity. The PMI has held above 50.0 for 42 months. The details of the November ISM manufacturing report is important evidence for the FOMC about noteworthy slowing conditions in the factory sector. Historically, the PMI has a strong positive relationship with the year-to-year change in GDP when it is advanced by one quarter.”

With manufacturing showing signs of corrosion, would the Austrian’s viewpoint be re-affirmed again?

Of course, mainstream analysts usually base their comments from the framework of demand-supply dynamics, from which we do not dispute. However, our concern is today, can oil prices rise amidst an economic slowdown?


Figure 5 Chartoftheday: The Long term Oil cycle

The answer is yes, depending on the condition. So aside from the fraying state of the purchasing power of the US dollar, decreased demand can be cushioned by---an even faster rate of decreasing supplies!

I’d like to bring back an old chart from Chartofthday.com, which shows of the thirty year horizon and the previous declining oil cycle. As indicated in Figure 5, Oil has undergone a massive declining phase for about TWO decades, prior to the present upside cycle. The present cycle, of course, doesn’t indicate exemptions from obstacles as any trend does. The 2000 recession did bring oil prices down temporarily, but such decline was apparently utilized as a springboard for establishing new highs!

As mentioned above, politics have been undermining much of the progression of putting on stream the already strained oil supplies, evidently due to the color of money....and leverage for added political power.

A serious ramification to these developments have been the inability of Western major oil companies to replace their reserves, according to analyst Sean Brodrick, ``the Western oil majors — like ExxonMobil, Chevron, BP, and Shell — are failing to replace the reserves they pump. In 1997, they were able to replace 140% of their reserves; in 2005, they were able to replace only 75%! This indicates just how hard it’s becoming to find oil. Everyone’s trying to grab what they can, while they can. And as you know, limited supply will likely equal higher prices going forward.”

Yes, because of ongoing global trends of nationalization of the industry. For instance, in Bolivia and Venezuela contracts with private companies have been either cancelled or renegotiated for a higher share of revenue for the host government.

In addition, ``Last month, Russia threatened to revoke permanently the operating licenses of Western oil majors in the Sakhalin-1 and Sakhalin-2 project, while state-controlled Gazprom is excluding all foreign (notably Western) energy majors from its giant Shtokman gas project” adds Sean Brodrick of MoneyandMarkets.com.

According to analyst Martin Spring, ``Russia is extending its ownership of and control over natural resources and other industries regarded as strategic, as well as buying companies in other countries giving control over markets, such as pipelines and refineries. France has announced that cross-border mergers will not be allowed in 11 industries. The US has blocked foreign takeovers of ports and the oil/gas producer Unocal.”

There is also the unfolding phenomenon of utilizing domestic natural resources as political leverage for expanding political power. According to analyst Mr. Spring, ``Countries with large commodity reserves are increasingly using them to apply political leverage to achieve national aims. 85 per cent of the worlds oil reserves are effectively under state control.”

As Russia recently surpassed Saudi Arabia to become the world’s largest producer of oil and gas, according to Mr Brodrick, ``it’s ripping up contracts and forcing new deals on customers from Western Europe to the Asian steppes. The country uses its muscle to reward allies, like Armenia, by charging them much less for natural gas than critics like Georgia.”


Figure 6: US Global Investors: Rising Production Cost per Barrel

Moreover, there are also the cumulative effects of growing shortages in tools and equipments, rigs and importantly personnel like engineers and geologists to undertake such projects.

An added dimension would be the rising cost of production as shown in Figure 6!


Figure 7: WTRG Economics: World Rig Count

World rig utilization rates are at very high levels or at 93% according to DBS Vickers, see Figure 7.

According to WTRG Economics, ``International rig count, which excludes the US and Canada, was up 16 to 965 for the month of October, 2006 and is 114 rigs or 14.1 percent above last year's 846. The total number of rotary rigs worldwide in October was 3,130 down 4 from September and 264 higher than last year. US workover rig count for October, 2006 was down 8 to 1,562 and is 131 rigs above last year's level of 1,431.”

On the other hand, rig deployment level, while below the record numbers of the 1980s are at 15 year highs.

Yet, the technologically challenged oil rigs have been due to years of underinvestment, let me quote DBS Vickers, ``there has been massive underinvestment in rigs. Only 24 units were built since 1993 and only 40 units were built in the last 20 years. Thus, about 85% of the jackups rig fleet is older than 20 years. Currently, there are about 42 units under construction. However, including normal attrition, the jackup fleet could well remain flat over the next 2-3 years.”

Nonetheless, despite the massive deployment of rigs, only a handful of discoveries have been made, the largest of which have been at the Gulf of Mexico by Chevron, Devon Energy and Statoil ASA which found an estimated 3 to 15 billion barrels in several fields about 175 miles offshore and 30,000 feet below the gulf’s surface! Conventional oil gets harder to come by!

An additional constrain would be increased environmentalism which is doubling the lead time to operate these projects.

So as capital or required investments are diverted away due to increasing trends of political interference, aside from prospective supplies equally hampered by infrastructure shortages and production bottlenecks, the demand equation is unequally met by diminishing supplies!Posted by Picasa

Menace of Peak-Oil!

``Nobody likes the idea of Peak Oil. Firstly, you have the politicians. Naturally, a politician will never say that there is such a thing as Peak Oil. It is suicide to give bad news, so a politician will never do that…Secondly you have the media. The media do not like Peak Oil. Why? There is no sponsorship for Peak Oil. The oil companies do not like Peak Oil because you should not say that your soup is cold; you should always say that it is very hot and very tasty, yes? So nobody wants to hear of this phenomenon of Peak Oil.” -ALI SAMSAM BAKHTIARI is a retired “senior energy expert,” formerly employed by the National Iranian Oil Co. (NIOC) of Tehran, Iran.

Lastly, is the threat of the validity of the Peak-Oil!


Figure 8: WhiskeyandGunpowder.com: The Menace of Peak Oil

Recently we have noted of the output declines of major oilfields in Burgan Kuwait (“second largest oilfield”), and Cantarel Mexico (“second largest oil-complex”). These are major oilfields whose outputs contributed greatly to the present supplies. But whose rate of production has been dwindling with prospective intensifying declines in the near future as the well matures, as shown in Figure 8.

Yet, despite the massive search for reserve replacement (in terms of expanding present proven reserves-via new technology processes or new wells) as noted for above, recent oil “discoveries” have not been sufficient to replace rate of depletion (thought to be at least 5%). In other words, for every 4-5 barrels consumed only 1 barrel is replaced, said conservatively. And that is what the Peak oil theory is all about.

According to WhiskeyandGunpowder.com geologist Byron King, ``That is, you cannot extract what you have not discovered. Peak Oil is a shorthand way of saying that mankind’s ability to extract conventional oil from the Earth is “peaking” because mankind has found most of the world’s oil deposits. And it also appears that mankind has extracted about half of all of the conventional oil that will ever be extracted. This is the basic premise. Keep your eye on that ball.”

Even with the prospective unconventional oil candidates as “tar” or “shale” oil for possible substitutes (aside from solar, windpower, hydrogen, biofuels, coal gasification) for the “fossil fuel”, these would take massive Dollar investments, additional energy inputs (as natural gas), humongous amount of water and widespread infrastructure networks, aside from of course, overcoming over political obstacles. All these combined would take a rather lengthy period of gestation while the present rate of oil production decreases.

So even if the world economy does slowdown led by the US, if the validity of Peak Oil theory is accurate, then higher trending prices could be the norm.

At the end the day, the present world has been built under the assumption of a sempiternal or everlasting environment of cheap oil and easy money. It would probably take tremendous bouts of angst before cognizance, acceptance and enlightenment would prompt both private and public sectors of the world to act accordingly upon the required adjustments.

Give or take away Peak Oil Theory, the cycle is definitely not over. Posted by Picasa