Showing posts with label developed markets. Show all posts

Thursday, September 03, 2009

Global Stock Market Performance Since The Lehman Collapse

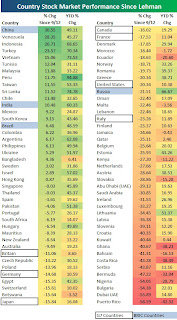
Another interesting chart from Bespoke Invest.

This time they take the perspective of global stock market performances in the frame of the Lehman collapse-which had been used as a yardstick to compare market returns.

This from Bespoke, ``The S&P 500 is still 20.34% below its level just before the Lehman collapse, and 49 of the 82 countries shown below have done better. Also, 28% (23) of the countries are up since Lehman. As shown, China is up the most since September 12th with a gain of 30.55%, followed by Venezuela (28.35%), Indonesia (26.71%), Turkey (23.57%), Vietnam (15.06%), and Tunisia (12.04%). Three of the four BRIC countries are up, with Russia the only one down at -21.51%.

``The US ranks 2nd to last in terms of performance for the G7 countries. Even though a number of market indicators are back to their pre-Lehman levels, the market itself here in the US still has a lot of work to do. If you think we're at least headed back to September 12th levels, you're expecting a further gain of 25% for stocks." (emphasis added)

The implied assumption here is that the Lehman collapse (after Lehman syndrome) could have been an anomaly, hence stockmarkets have set course for a "reversion to the mean".

Nevertheless, the story has been the same: emerging markets have far outpaced developed markets.

This shouldn't be a surprise though, since the former had apparently been a victim of the contagion effects more than as the source of the crisis.

Structurally, emerging markets are likely to continue outperforming since developed markets are still undergoing the angst of the adjustment process coming off a bubble bust.

Thursday, August 20, 2009

Emerging Markets Joins The Space Industry Race

In contrast to popular perception, the space race don't seem to be dominated by any country.
Justify Full

Notes the Economist, (bold emphasis mine)

``ON WEDNESDAY August 19th South Korea's attempt to launch its first rocket ended in failure, for the seventh time since 2002. Pressure on the country has been mounting since neighbouring North Korea claimed it had put a satellite into space in April this year. Most launches are made from countries with the well-established space programmes. As of last year, Russia had sent 245 rockets with payloads into orbit successfully since 1999, compared with America's 218, according to data from Futron, a technology consultancy. China now surpasses Europe as a base for spacecraft launches, while India and Japan send up a few every year. Israel has also put two rockets into space."

Even in the space industry, emerging markets are becoming major contenders.

Tuesday, July 28, 2009

Global Stock Market Performance Update: Proof of Rotational Effects and Tight Correlations

This is an example of how experts use specific time frames to prove a point.

This from Bespoke Invest,

(bold highlights mine)

``The S&P 500 is up 11.24% since July 10th, which is a significant move in such a short period of time. The recent gains also put the index up nicely at 8.28% year to date. As shown below, the US has performed well relative to the rest of the world. Since July 10th, it ranks 22nd out of 82 countries. Russia is up the most with a gain of 24.23%, followed by Hungary, Poland, Norway, Romania, and Germany. Middle and Eastern European countries have seen some of the biggest gains in recent weeks."

Justify FullAdds Bespoke, ``While China has been the second best performing country (behind Peru) year to date, it is only up 10.32% since July 10th. This is better than most countries, but it hasn't been the worldwide leader that it was earlier in the year. Five of the G-7 countries have outperformed China, and all seven G-7 countries are in the top 50% in terms of performance. This is a sign that developed markets have been holding their own against emerging markets in recent weeks. Only ten out of 82 countries are down since July 10th, with Slovakia leading the way at -5.67%."

We are grateful to Bespoke for their wonderful graphics.

However, with China's year to date gains at a mindboggling 88.66% and with the Shanghai benchmark at grossly overbought conditions, it would be a puzzle or an irony to expect a continuation of such torrid pace of advances or even make a worthwhile comparison. 88% versus 9% (year-to-date) is just a wide wide chasm.

As we earlier wrote in Global Stock Market Performance Update: Rotational Effects and Tight Correlations

``If global markets have been driven by liquidity or monetary forces or inflation dynamics then it is quite obvious that there will be rotational effects and secondly, for the early movers some tight correlation, as global liquidity transmission interlinks divergent markets."

Hence, our views seem to get validated where we appear to be indeed witnessing rotational effects from inflationary policies as the market leadership has temporarily switched from (leaders) emerging markets to the (laggards) developing markets.

Another, as Bespoke likewise observed, only 10 out of 82 since July 10th are down, or 17 out of 82 global benchmarks on a year-to-date basis-signifies further proof of the "global liquidity transmission interlinks divergent markets", we earlier posited. Market gains seem to broadening on a worldwide basis, but not all.

Russia's RTS outperformance appear to be a function of a typical bullmarket trend.

As we commented in the same article, ``Russia's hefty decline exhibits overheating. The Russian benchmark is still the 5th best year to date performer IN SPITE of the recent (21%) downturn. It trails Peru, Sri Lanka, China and India."

Indeed, after a 50% fibonacci retracement since the March lows, Russia has used its recent reprieve and the opportune windows provide by developed markets as fulcrum to stage another gala rendition (even at the face of a mighty performance by developed economies.)

Bottom line: ``developed markets have been holding their own against emerging markets" because of the rotational effects and global liquidity transmission of the global inflation dynamics more than representative of idiosyncratic strength or traits.

At the end of the day, emerging markets has still patently outperformed its developed counterparts under present "ultra loose monetary" conditions.
Monday, July 13, 2009

Emerging Markets Stocks Outperform: Signs Of A Top Or Of A New Dynamic?

Bloomberg's chart of the day shows how emerging markets have recently been outperforming the US S&P 500 in terms of weekly PE ratio.

Some notes from the article (all bold emphasis mine) including my comments in captions

-The MSCI emerging-market index had 13 bull-market rallies of at least 20 percent and 12 bear-market declines of the same magnitude since its inception in December 1987, according to data compiled by Birinyi Associates Inc., the Westport, Connecticut-based research and money management firm founded by Laszlo Birinyi. That compares with five bull markets and four bear markets for the S&P 500 during the same period.

(This implies that Emerging Markets stocks are more volatile than the developed market peers)

-The increase cut the dividend yield of the emerging-market gauge to 3 percent, compared with 3.5 percent for developed countries. MSCI’s emerging-market index fetches 1 times sales and 6.6 times cash flow, compared with 0.8 and 4.3 in the advanced gauge, data compiled by Bloomberg show.

(based financial ratios EM stocks seem more expensive, but financials don't tell the entire story)

-Developing nations’ share of global equity value climbed to an all-time high this month as investors poured in a record $26.5 billion last quarter, according to data compiled by Bloomberg and EPFR.

-The Washington-based IMF estimates developing economies will grow 1.5 percent as a group this year and 4.7 percent in 2010, while advanced economies will contract 3.8 percent in 2009 and expand 0.6 percent next year.

(And it won't be entirely a story of economic growth too)

-Developing nations traded at a discount to American equities from 2001 to 2006 even after their economies expanded at almost three times the pace, according to Bloomberg and IMF data. They moved to a premium in October 2007, the peak of a five-year advance that sent the MSCI gauge up fivefold. The index’s drop in 2008 was almost 16 percentage points steeper than the S&P 500’s 38 percent slide, the worst since 1937.

(the article suggests that when EM stocks outperform, a reversal looms)

-When emerging-market valuations climbed above the U.S. in 1999 and 2000, it foreshadowed the end of a seven-year global rally. The MSCI developing-nation index sank 37 percent in the 12 months after March 2000, compared with a 23 percent slide in the S&P 500.

(same argument here)

-Companies in the MSCI emerging-markets index that reported results since the end of the first quarter posted an average earnings drop of 92 percent, trailing analysts’ estimates by 14 percent, according to Bloomberg data. That compares with a 46 percent profit slide for Europe’s Dow Jones Stoxx 600 Index and a 31 percent fall for the S&P 500, Bloomberg data show.

Additional comments:

The general disposition of the article is one of negativity. It implies that EM stocks outperforming developed economy stocks seems like an anomaly and isn't destined to happen for long.

Not only that, such aberration in the past has signaled a reversal of global stock markets.

Looking at history to make comparisons, when present dynamics aren't the same seems either like anchoring or reductionism (oversimplification of causality).

While it is true that we seem to be seeing some weaknesses in global markets of late, it isn't certain that all global markets will behave similarly like in 2008 or in 2000. The article discounts the possibility of divergences, a phenomenon we think will manifest itself overtime.

Growth or financial ratios won't be the only issues that needs to be reckoned with, but more importantly for us, is the impact from concerted and coordinated policies by global governments on national markets and economy.

This is because every country has a distinct political economic structure that we assume would respond differently to such policies. And the diverse responses will likely be manifested on the asset market pricing.