Monday, October 17, 2005

Chart Buys: First Philippine Holding and Atlas Mining

Two interesting charts that I would like to share with this week.

First of which I believe that First Philippine Holdings has crossed a major inflection point, from which a state of indecision as reflected by the symmetrical triangle as shown in the chart below have been recently broken.


First Philippine Holdings

While some may argue that the developments in First Philippine Holdings (FPH) could be related to its proposed listing of its subsidiary First Gen or due to its dividend (P 1 cash ex-date October 18, special cash P 1 ex-date October 18), my inclination is that both these issues has little to do with the present breakout. I have been fundamentally bullish on the issue primarily because the company deals profitably with the sectors that I think would be the prime movers of the Philippine economy, particularly the energy and the infrastructure sectors, alongside my favorite the mining sector.

As you will note from the above chart, FPH is an uptrend given its one year outlook. However, since the Phisix peaked in March due to the spate of foreign outflows, FPH has moved lower during March to June and effectively consolidated from July to the present. It has formed what technicians would say as ‘higher lows’ where the bears have been unable to push prices lower than the previous. In effect, the symmetrical triangle is a manifestation of a stalemate between the bears and the bulls. However, it usually suggests of a continuation of the underlying trend, which in FPH’s case is an uptrend.

Last week, FPH broke out of the “sphere of indecision” with Friday’s activities built on heavy volume and a spike in share prices up about 6%. It tested its resistance level at 44.5 but closed a fluctuation lower or at 44. I believe that the momentum has switched greatly in favor of the bulls this time with a resistance breakout due possibly next week.

I would recommend a buy on breakout on this issue as it crosses the 44.5 level. The resistance levels are as follows 46.5, 49.5-50, 53-53.5, 61.5-63.5 and a stop loss on a break of 40.5 or 39 being key support levels.


Atlas Mining

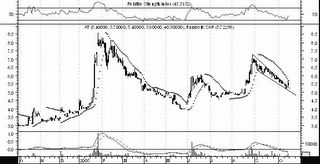
The second issue which I would like to share to you is Atlas Consolidated and Mining Corp (AT).

Since its peak in February, the copper-nickel mining company has fallen in line with its industry mates but unlike the others has resolved to keep its uptrend intact as shown in the above chart. Since its recent peak in late August, AT has been on a decline forming a bullish ‘falling wedge’ pattern. As you would notice in the past, AT has the penchant for short term spikes, which incidentally allows you the opportunity for trades, if history would rhyme.

On Friday, it broke out of the falling wedge pattern on heavy volume. Aside, the technical indicators appear to support a next run. Relative Strength Index (RSI) shown on the upper window has bounced off its oversold levels while on the lower window the Moving Averages Convergence Divergence (MACD) appears to have crossed, emitting bullish signals.

If Atlas would replicate its recent two spikes, I think it has an upside potential of 7.5 to 8 before retracing again. I would recommend a trade, buying at current levels and selling at the support levels, which should translate to about 30% in returns. Again, a stop loss at a break of the 5.2 support level considered, which translates to a loss of about 10%. In effect, your reward risk ratio is about 3:1. Posted by Picasa

Monday, October 10, 2005

The BIG Four Hedgers

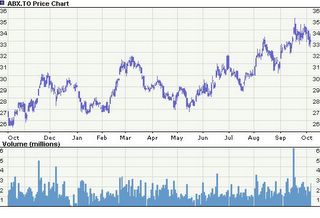
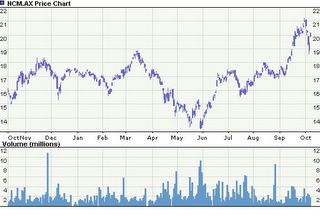
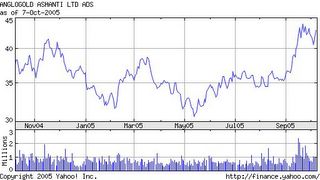
Today’s argument is about gold mining hedges. Let us examine chart performance of the BIG Four according to GFMS “The industry’s “big four”, Barrick, AngloGold Ashanti, Placer Dome and Newcrest (who account for two thirds of the global hedge book in nominal terms)”


Barrick Gold


Placer Dome


Newcrest


anglogold ashanti

They may underperform but they are all on the rise...at least over the interim.
Posted by Picasa

Wednesday, October 05, 2005

Mises.org: Free Markets and Social Welfare by Gabriel Openshaw

Our society’s penchant to ascribe effective governance or the lack of it to personality based politics leaves out the kernel of the country’s economic malaise. Mr. Gabriel Openshaw’s article published on Ludwig Von Mises (www.mises.org) correlates on a country’s economic straits, immigration patterns with that of social welfare states and those that adhere to free markets. As argued before, free markets and less governments are key to economic prosperity and NOT the other way around, Mr. Openshaw tells you why....

Free Markets and Social Welfare

by Gabriel Openshaw

Austrian utility and welfare theory [pdf] observes that all transactions in a free market economy take place only when both parties believe they will be happier as a result of an exchange. People act in ways that maximize their personal well being, subjectively understood. In contrast, in centralized economies the only way the state can enforce its economic decisions is through the threat of force for noncompliance, or fear.

We might say that capitalism is a happiness-based system where as communism (and all forms of interventionism) are fear-based systems.

This is a great idea in theory, but is there any way to validate its truth in practice?

If the thesis is correct, then we should expect to consistently see people wanting to move from fear-based economies to happiness-based economies.

According to the Index of Economic Freedom,[1] here are the 20 countries with the least economic freedom:

Congo, Republic of the

Vietnam

Guinea-Bissau

Syria

Suriname

Bangladesh

Nigeria

Belarus

Tajikistan

Haiti

Venezuela

Uzbekistan

Iran

Cuba

Laos

Turkmenistan

Zimbabwe

Libya

Burma

Korea, North

These are not typically countries that people want to move to. In fact, in a number of them it is against the law to leave the country.

Net migration statistics confirm that these countries have a migration outflow of minus 1.12 per thousand.[2] In other words, every year these countries see 1.12 more people moving to another country per 1,000 in population than people from another country moving in. Clearly, this represents overall dissatisfaction with life in that country (especially since these numbers would be higher if it weren't illegal to leave).

On the opposite end of the spectrum, the 20 most economically free countries in the world are:

Hong Kong

Singapore

Luxembourg

Estonia

Ireland

New Zealand

United Kingdom

Denmark

Iceland

Australia

Chile

Switzerland

United States

Sweden

Finland

Canada

Netherlands

Germany

Austria

Bahrain

Not surprisingly based on our thesis, these countries are much more desirable to live in and have a positive net migration inflow of 3.81 per thousand. And unlike those countries with extremely centralized economies where it was illegal to leave, in most of the economically free countries there are limits on immigrants allowed to move in due to overly high demand. If the restrictions weren't there on either side we would see an even bigger difference in net migration.

So our theory is holding: the most extreme centrally managed economies see either a net outflow of their population (or make it against the law to leave), while the most economically free countries see a strong net inflow of people from other countries.

This principle holds true not just for the extremes. Of the 154 countries that are ranked by the Index of Economic Freedom, comparing the top 77 with the bottom 77 you also see that the top half (more economically free) has an average positive net migration inflow of 0.83 per thousand, while the bottom half (less economically free) has an average negative net migration of minus 0.57 per thousand.

Migration patterns of people around the world clearly show that people consistently move from centrally-managed economies to free-market economies (and in fact the results of the analysis are statistically significant, with a P value of 0.0220).

Now, some may advance the argument that only rich countries can afford to be economically free, and thus it's normal to see migration from poorer countries to richer countries. This ignores the fact that rich countries are rich precisely because of their economic policies.

Here are the 22 "first-world" countries of Western Europe, Australia, New Zealand, the United States and Canada, ranked by order of most economically free:

Luxembourg

Ireland

New Zealand

United Kingdom

Denmark

Iceland

Australia

Switzerland

United States

Sweden

Finland

Canada

Netherlands

Germany

Austria

Belgium

Italy

Norway

Spain

Portugal

France

Greece

These countries are among the most free-market-based in the world, including 7 of the top 10. Even the three least economically free of this select group (Portugal, France and Greece, ranking at 37, 44 and 59, respectively) are well above average in their free-market orientation.

If our thesis is correct, even among these we should be seeing migration from less economically free to more economically free. After all, if the spectrum analogy holds true, people will always gravitate toward the greater happiness found in more free-market economies.

Of these 22 first-world countries, the 11 most economically free have an average net migration rate of 2.68 per thousand, while the 11 less economically free have an average net migration rate of 2.01. In other words, even among these countries the most economically free show 33% more positive net migration than their less free peers. The principle holds.

Even within a country, we can see migration from more restrictive to more free market policies. In the United States, net migration is 23% greater to states that have a right-conservative governor than to states with a left-liberal governor, and in general the conservative political platform is more pro-free market.[3]

Even at the county level, 97 of the top 100 fastest growing counties in America voted conservative, or more free market, in the last election.[4] Again, the principle holds.

By analyzing the net migration of millions of people making individual decisions every year in every country around the world, we are able to objectively validate the thesis: that on the economic spectrum ranging from centrally-managed economies all the way to decentralized free-market economic policies, people will tend to shun central planning and gravitate toward the free market. In all cases, people are happier with freer markets and repeatedly demonstrate this by their choice of where to live.


Gabriel Openshaw [gopenshaw@yahoo.com] is business-development director in Fairfield, Iowa, and runs the blog LogicalOpinion. Comment on the Mises blog.


[1] Source: 2005 Index of Economic Freedom.

[2] Source: CIA World Factbook.

[3] Source: National Governor's Association & U.S. Census Bureau 2000-2004 Migration Statistics.

[4] Source: Los Angeles Times, November 23, 2004.

Tuesday, October 04, 2005

Australian News: RBA warns of 'meltdown'

The Central bank of Australia recently warned of the risks of a major financial meltdown. Is this another case of Boy who cried Wolf? Quoting David Uren for the Australian News...

"FURTHER rises in oil prices, the collapse of a major bank or an unexpected jump in inflation could be all it takes to send the increasingly fragile global financial system into meltdown.


"The Reserve Bank of Australia warned yesterday that the current calm in financial markets could be the prelude to a storm that could wreak havoc in the world economy. "

Friday, September 30, 2005

Mises.org: K.Y. Leong: The Rat Catchers of India

In our country whose social moorings are in the belief that government is the principal source of its societal upliftment, a simple case of rodent catching in India exemplifies how bureacracy almost always fails in its duty to dispense of its fundamental functions, an article from KY Leong published at mises.org...

The Rat Catchers of India
by K.Y. Leong

Every major power in the world today has a spy agency. The Americans have the CIA, the Brits their MI6, and the Russians have the FSB (formerly the KGB). In the Indian capital city of New Delhi they have a Rat Surveillance Department (RSD). Unlike the others whose jobs involve tracking down the nasty "rats" who trade state secrets or crash airplanes into tall buildings, the RSD has a mission of a less sinister kind. It deals with a menace closer to the ground.

According to a recent report in the Hindustan Times (September 2005):

New Delhi's government has a rat-catching department that has not caught a single rodent in more than a decade… The Rat Surveillance Department employs 97 rat catchers, who each earns about 3,500 rupees (US$83) a month. But there are no records of any rodents having been caught in the past 10 years.

…Rats are not hard to find in New Delhi — they can be seen scurrying across public parks and streets and even in homes.

Obviously, to the dutiful taxpayer in India, this is highly disturbing news. Why?

First, it shows that rats are smarter than their human pursuers — the rodents have evaded capture for more than 10 years.

Second, the government has demonstrated its total incompetence in this game of Spy vs. Spy by committing the strategic error of telling the world it has 97 "specialists" out there, each being paid a lousy 83 bucks a month and thus, exposing them to the risk of being bought over to "the other side"?

A third and less obvious reason is the one offered by Henry Hazlitt: the Indian government had thought "only of the first half of the transaction." And the Indian taxpayer was left wondering: What happened to the second half of this simple deal, i.e. getting rid of some nasty rats?

But it doesn't take a PhD in rat-catching to figure out that annihilation of the rodent population could also mean the demise of the Rat Surveillance Department. For what would be the point of the taxpayer keeping 97 "specialists" employed if there were no more subversive rats around?

One can also imagine that the employment of the first rat catchers would necessitate the establishment of a chain of related public goods producers, e.g. a Rodent Counter-Intelligence Agency, a Criminal Rat Investigation Bureau, a Rodent Detention Center…, and maybe even a Rat Census Bureau (for how else would the government be able to obtain the necessary rodent demographics required to establish the need for exactly 97 rat catchers?).

Again, one would not need a doctorate in verminous espionage to deduce that systemic failure of this type of state-run structure is inevitable. In the case of the RSD and associates, one purposeful initiative from any one of the rat buster departments would necessitate action on the part of all the other public goods producers along this value chain. And since such an initiative, if carried out diligently, would eventually threaten the existence of all rat buster groups, it would clearly not be in the interest of any member within the value chain to make a first move, indeed any move at all.

Hazlitt again:

"While every group has certain economic interests identical with those of all groups [in this case, the elimination of a public evil], every group has also… interests antagonistic to those of all other groups [preserving the job of the government servant]."

So, for 10 years hence, we have the Indian rat catcher, possibly more competent than his government bosses, his self-serving praxeological thinking committing him to the noble cause of an idyllic existence.

There is another kind of street nuisance in India. Those who have traveled there cannot help but notice that cow droppings are often found on the streets and parks. Cows are considered sacred animals by the Hindus and allowed to roam the streets and let off droppings freely.

If you were a civic minded citizen of India, you might think it a good idea to call the rat busters and inquire if they could actually do the public a service by removing a similar street nuisance (since the government has yet to set up the Dung Elimination Department). But then you would be sadly disappointed by the response you would likely receive from the RSD officer: "That's not my department!"

But cow droppings are not really a public menace in India. These are industriously collected by villagers in the countryside to be dried, stored and burnt as fuel in cooking and heating. It is a freely available source of energy.

And fortunately for the villagers, the cow dung market got there ahead of the State, before it could set up the Rural Health Protection Department and decree all collecting, processing, buying and selling of cow droppings illegal (unless a state-imposed excise duty is paid in every transaction).

Indeed, if the State had gotten ahead of the villagers, it would soon have realized that cow droppings are more than just natural fertilizer. It would next have to declare such a strategic resource critical to national interests, which must therefore be protected and regulated by the Renewable Energies Agency. Furthermore, in the name of a potential Global Health Hazard, any foreign nation with plentiful cow droppings on its streets would be declared "evil" and have to be "liberated" as soon as possible.

Indeed, one public good propagates another and another…

Besides the concern for national security, processed dung could also pose a serious threat of a different kind to the State. Being highly portable (when shaped and dried) it is sometimes used in barter trades for beans, milk, tea and other basic necessities in the remote villages of India. Yes, there exists a parallel economy operating outside the purview of the State. Since everyone has a need for energy, but not every person likes tea or beans in his diet, processed cow droppings have come to function as money — a commonly accepted medium of exchange.

When Mises concluded that "In a socialist country, it is not the seller who has to be grateful, it is the buyer," he couldn't possibly have imagined the Indian taxpayer returning the favor of the idle rat catcher and paying his taxes with dung money — or the Central Bank of India, obsessed with controlling all money supplies in that country, accumulating this alternative Indian currency as a commodity reserve against the rupee!

That might put a stop to stinking inflation; and result in the government (unwittingly) doing everyone a great favor — stable money, at last.

But meanwhile, in the capital city of India, as long as the rat catchers are in government service, rats roam free.
______________________

K.Y. Leong is in business in Singapore. vertex_18@yahoo.com.sg. Comment on the blog.

Thursday, September 29, 2005

Gudani Expose: Last Straw to break the Camel’s back?

After the series of failed attempts to unseat the highly unpopular incumbent Philippine president through the withdrawal of support by former political allies and select cabinet members, augmented by street protests by militants and malcontents, the botched legislative route via the impeachment process, the unsuccessful stab to get members of the Catholic Church to demand her resignation and now, the persistent clamors for military interventions, Brig. General Francisco Gudani, assistant superintendent of the Philippine Military Academy and Col. Alexander Balutan assistant commander of PMA cadets expose at the Senate aims to highlight the crevice within ranks of the Armed Forces of the Philippines and possibly inspire an EDSA I type of ‘mutiny’ with the latter two as figureheads. Stated differently, Brig Gen Gudani and Balutan are providing themselves as an alternative to the Ramos-Enrile EDSA I tandem to the proposed regime ‘change’.

Their sensational appearance at the Senate has apparently failed to present any direct evidence damning the incumbent, with most of the allegations mostly based on hearsay evidence. In short, nothing more than sound bytes.

However, we will have to see whether this politicization within the ‘isolated’ ranks of the military organization will drawout more reluctant or shadow supporters and snowball into a much ballyhooed ‘last straw’ to successfully unseat PGMA.

So far the financial markets have relatively ignored the impacts based on the movements of the Peso (moved higher) and the slight decline of the heavily foreign supported Phisix as of Wednesday September 28th.


Tuesday, September 27, 2005

CNN Money: Wall Street storm may be brewing

Financial risks brought about by the untested exotic instruments as derivatives, which are now extensively used by hedge funds, have hit mainstream newswires, this report from CNN Money’s Amanda Cantrall, “Wall Street storm may be brewing

Some noteworthy excerpts...

``Hedge funds now manage an estimated $1 trillion in assets worldwide, and in some cases, a single fund can account for a big chunk of the volume on some exchanges...

“The credit derivatives market has swelled to an estimated $8.4 trillion -- that's trillion with a 't' -- and regulators are concerned about trading in these largely unregulated investments...

“Two complex derivatives -- credit default swaps and collateralized debt obligations -- have become especially popular with hedge fund investors in recent years.


Soaring Number of Hedge Funds


Exploding Credit Derivatives

Sep2705 Global Liquidity Spillover Lifts Phisix

The US Federal Reserve raised its interbank lending rates for the ELEVENTH time to 3.75% while our local counterpart the Bangko Sentral ng Pilipinas (BSP) likewise increased its repo rate by a quarter point to 7.25%.

All week long business headlines spoke about “pressures” on the BSP to raise the local rates and the Phisix incrementally advanced. On Friday the BSP made good on its “pressure” and raised rates, the Phisix fell and mainstream analysts were facilely attributing these to interest rates. Call these crass analyses. First, local interest rates have low correlation to the Phisix. Second, a quarter point increase is hardly a reason to cause a contraction, as the scale of the increase is marginal. Third, most local analysts are off tangent as to forget that foreign money are the main drivers of the Philippine equity markets, such that raising rates in fact benefits the Peso and the Phisix as to maintain the spread differentials between the rate framework of the US dollar and the Philippine Peso. Think of the US markets, it raised its rates for the Eleventh time, yet its equity markets have so far held its stead. Rising rates have in fact, uplifted the state of the US dollar, if not forfended the US dollar from its two year streak of losses, which is what I suspect as the prime reason for the US Federal Reserves’ decision to maintain its ‘measured pace’ of rate increases, aside from targeting to thaw the lathered US real estate markets.

As the Mr. Jen of Morgan Stanley argues, for as long as the Fed tightens it will be very difficult for the USD/Asia to trade lower. That seems to be the case as key global currencies weaken against the US dollar including those from Asia. The US dollar index firmed by 1.34% to 89.23 at the expense of the Euro (-1.39%), the British Pound (-1.66%), the Australian Dollar (-1.25%), the Swiss Franc (-1.91%), the Japanese Yen (-.81%), the Taiwan Dollar (-.7%), the South Korean won (-.3%), the Thai baht (-.3%), the Singapore dollar (-.3%), the Indian Rupee (-.2%) and the Indonesian rupiah (-.7%). So regional, if not the global currency selloffs, hurt the Philippine Peso too down by .1% to 56.225.

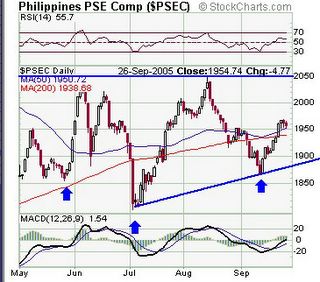
During the previous week I argued that global liquidity conditions are likely to spillover the country’s equity assets and to be further bolstered by the technical picture; it appears that such conditions have reemerged as foreign money have reversed from three consecutive weeks of outflows to inflows. The Phisix jumped by 2.6% on a “late cycle rally” which has been an ongoing regionwide if not worldwide phenomenon, although what really concerns me is the tepid volume accompanying the rise.


The chart above of the Phisix courtesy of stockcharts.com shows of a successful breach of the 50-day (blue line) and 200 day (red line) moving averages. The previous resistance levels are now reckoned as the current support levels. Yet, technical indicators such as the relative strength index (RSI) shown on the upper window, as well as, the MACD on the lower window are suggestive of a likely continuation of the present momentum.

In addition I would like to point out of two technical patterns that seem to highlight bullish undertones for the Phisix, again shown in the chart above. The lower blue line depict of an interim uptrend while the resistance is marked by the “flat” horizontal line. Both lines seem to denote of a convergence or a manifestation of a bullish “ascending triangle” formation. Further the lower three blocked arrows appear to indicate of a massive reverse “head and shoulder” formation whose neckline is likewise at the resistance levels of 2,050. A successful breach of the neckline would likely see the Phisix target the 2,300 vicinity.

Again barring any unforeseen events, global liquidity flows will remain as the key drivers of global equity markets. The Institute of International Finance (IIF) projects private capital flows to emerging markets to reach $345 billion in 2005 topping the record inflows of $323 billion in 1996.Posted by Picasa

Sunday, September 18, 2005

Gold At Fresh 17 Year Highs; Currency-wide bullmarket begins!

``Losing trust does not mean that there must be a ready substitute. On the contrary: when distrust will emerge towards the US dollar this would affect the attitude towards all paper currencies. In the final stages of the currency crisis, the dollar will most likely devalue not so much against the euro and the yen, but all of these currencies and most of the rest will devalue drastically against gold.” Anthony Mueller, The End of Dollar Supremacy, Oct 20, 2003.

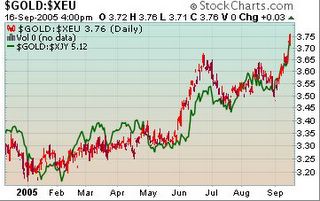
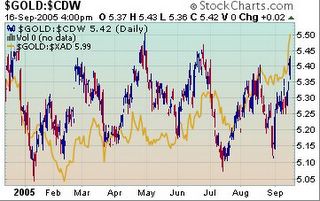
As mentioned last week, John Maynard Keynes’ barbaric metal ‘Gold’ was drifting along at a striking distance near its 16 year barrier based on the US dollar quoted price charts, but this week not only has it successfully broken out of them, it has done so against virtually almost all major currencies as shown in the charts below courtesy of stochcharts.com...


Gold breaks out against the Euro (red candlesticks) and the Japanese Yen (green line)!


Gold breaks out even against the key Commodity Currencies, the Australian Dollar (gold line) which incidentally bears a strong correlation to gold relative to other currencies! While treading at the upper side range of the strongest amongst ’em all the Canadian Loonie (blue candlestick)!

In the past, gold prices have largely tracked the Euro as it gained over the US dollar, however since the US dollar have firmed over for most of the year and gold manifested signs of eventual decoupling since June (see June 13 to 17 edition A Looming Genuine Bull Market in GOLD at Work??!!).

Further I also think that the oil gold ratio has something to do with the recent rally seen with the monetary metal.

Historically, gold and oil have moved up in the years where high inflation prevailed. For example here is a list of how assets performed during June 1970 to 1980...

Rank

Assets

Returns (%)

1

Oil

34.7

2

Gold

31.6

3

US coins

27.7

4

Silver

23.7

5

Stamps

21.8

6

Chinese ceramics

21.6

7

Diamonds

15.3

8

US farmlands

14

9

Old Masters

13.1

10

Housing

10.2

11

Consumer Price Index

7.7

12

Treasury bills

7.7

13

Foreign Exchange

7.3

14

Bonds

6.6

15

Stocks

6.1

Note: Compound annual rates of return. Source: Salomon Inc/Dr. Marc Faber Tomorrow’s Gold

As you would notice from the above table, tangible assets prevailed over the presently ‘known’ traditional investments themes.

One must be reminded that while history may not repeat itself entirely it may show signs of parallelism as today.

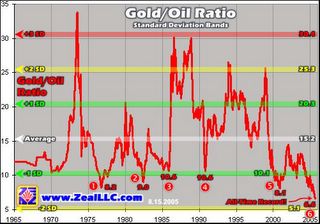
The chart below, courtesy of Adam Hamilton’s ZealLLC.com shows of the gold oil correlation or how many barrels of oil can buy an ounce of gold or expressed in a ratio the market price of gold divided by the market price of oil.


The remarkable thing is that in about four decades, the gold and oil ratio as shown above has traded in a well defined range, where the historical average ran at around 15.2. In addition, there were 5 instances in the past where oil outperformed gold which eventually resulted to a reversion to the mean, meaning gold prices eventually caught up.

Since WTIC’s crude Oil, traded at the NY Mercantile Exchange, surged above $70 two weeks ago, the ratio went into the extremes at around 6.2, which is the 6th instance of oil outperforming gold in 40 years!

As of Friday’s close of $63 per bbl and $459.5 for gold priced in US dollars, the ratio is now at 7.29 still way below its past lows at 8.1 to 8.2. This could be indicative of four probable scenarios to occur for oil and gold to revert to its historical averages;

1.
oil will move down back to $30 bbl, assuming gold remains constant at $459.5
2.
gold will rise to meet its historical averages at $958 (!!!) while oil remains constant at $63
3.
a combination of both or lastly
4.
oil would rise in much a moderated clip relative to the advances in the price of gold.

Let me quote, Adam Hamilton here, ``The six-decade old GOR relationship could certainly end at anytime, anything is possible in the markets. But odds are it won’t. Gold and oil are both tangible and finite assets, they can’t just be wished into existence but instead vast amounts of capital must be expended to recover them. Since they are both real, they tend to feel the effects of inflation similarly. As the US Federal Reserve continues its dangerous course of printing perpetually spiraling amounts of paper money, more paper will bid on gold and oil driving up both prices at the same time.

``In an inflationary fiat-paper regime such as the ones that exist in every country on the planet today, money supplies are guaranteed to grow faster than commodities supplies. As relatively more money bids for relatively less commodities, higher commodities prices are the inevitable result. To bet that the GOR is going to suddenly fail is not only to bet against six decades of history, but to somehow assert that fiat-paper inflation will miraculously cease so monetary pressures don’t push up gold and oil simultaneously.”

Gold’s rise in the US was largely blamed on inflationary fears and the financial markets seems to have corroborated this view as US treasury yields rose dramatically (prices fell) across the board.
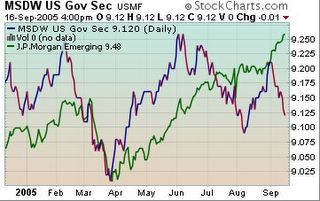

The chart below shows of the Morgan Stanley US Government benchmark (blue line) in a free fall even as emerging bonds, represented by the JP Morgan Debt Fund appears to surge higher even in the face of sharp declines in copper prices (-.65%) for the second consecutive week!

Yet hardly anyone has recently spoken about gold’s latest rise against all major currencies. Have global investors come to realize that the US biggest exports, its currency, have equally eroded the purchasing power of its major trading partners?

To put in proper perspective, gold prices has not actually risen but rather fiat or paper currencies has receded in value relative to their purchasing power against commodities, particularly against oil, gold and silver (+3.23%)...

Larry Edelson of Safe Money Report sees the landmark rise of gold as portentous of the following environment, he warns...

A. Inflation will rise substantially in the months ahead ...
B. Oil prices could be ready to explode again ...
C. The dollar may fall more sharply than anyone expects, and …
D. Some hidden surprise, such as a blow-up in derivatives, could be lurking just beyond the visible horizon.

While I do not intend to make a big fuzz out of it, the latter’s description of a blow-up in derivatives is certainly getting some officials to be ‘overly concerned’ about recent developments, such as investors asking for actual settlement of treasury futures contract, restatement of financial reports by the Federal Home Loan Bank of Pittsburgh due to derivatives, rumors of a derivatives meltdown, the collapse of a hedge fund called Bayou and the US Federal Reserve’s move to rein in derivatives trades through processing backlogs as global hedge funds access to these untested exotic instruments balloon.

Apparently the specter of a repeat of the Long Term Capital Management (LTCM) hedge fund collapse in 1998, has prompted these bankers and FED officials to contain possible ripples, notes Riva Atlas of the New York Times, ``Credit derivatives are bets on whether a company will pay its debts. In the event of a default, the party on the losing side of a trade must compensate the institution that holds the other end of the bet.

``The problem is Wall Street has been overwhelmed in keeping track of these trades - and if corporate defaults, which are at an 11-year low, suddenly rise, it could have a mess on its hands...

``The Federal Reserve called the meeting yesterday to address both a backlog in processing these trades as well as something called assignments, which refers to who holds the contracts at the time they are due.”

You see the world today is absolutely flushed with liquidity, if we are to reckon using Mckinsey Quarterly estimates global capital markets are now at about $118 trillion (bank deposits, market capitalization, private and public debts) while Global GDP is about $40 trillion. With the financial markets about 195% greater than economic output, this translates to a “financial economy” where activities are directed to more paper trading and credit creation, ergo speculative excess, rather than the “real economy” where goods or widgets are manufactured and services are rendered.

A sudden contraction of liquidity due to any proximate causes such as a derivative induced meltdown could cause a breakdown of confidence towards the prevailing monetary system; yet other circumstance can equally generate the same tumultuous conditions such as global central banks realignment of currency reserves, a shift in oil/commodities trading away from the US dollar (Iran’s proposed oil exchange in 2006 purportedly quoted in Euros), a pop in the real estate bubble in the US, a catastrophic war among major economies or a major terrorist strike or cataclysmic natural disaster could all be triggers. Remember while these are all reckoned as low probability events, with ample warnings issued by diverse institutions (IMF, OECD, World Bank) or renowned individuals (Sir John Templeton, George Soros, Warren Buffett, former US Federal chief Paul Volker, ex-US Treasurer Robert Rubin), like the recently tragedy of New Orleans, ignoring them could be costly to your portfolio.

John Hathaway of Tocqueville Asset Management estimated that above ground or physical gold which includes, among others, central bank holdings as well as private holdings through jewelries and stock market capitalization of the global gold mining sector (less than a $100 billion) are at about $1.5 trillion dollars. Considering that global stock market cap and bond markets at about $75 trillion, an allocation of only 1/10th of 1% would translate to 7500 tonnes, equivalent of three years supply of newly mined gold. In the words of Mr. Hathaway, ``Such an allocation would in time cause gold to trade comfortably in excess of 4 digits in terms of US dollars, Euros and just about any other currency as well.”

I know most of you remain skeptical of my view, whereas for your prudent investor analyst gold’s move against all currencies of late represents a critical milestone. It basically epitomizes a tectonic shift in the global financial market landscape where first, as commodity prices race higher, this would largely represent a squeeze in profit margins on higher input costs and possibly through politically inspired legislated wage hikes, second, higher commodity prices via inflation presages an era of higher interest rates or tight money environment and lastly rising gold prices are indicative of greater risks in the realm of financials, economics or politics or a combination thereof. Ignore the writings on the wall at your own risk!Posted by Picasa