``Imitation in markets often gets a bad name, but it's important to recognize how vital imitation is in our day-to-day lives. We imitate each other all the time, primarily because other people often have better information than we do. It becomes a problem in markets when everyone starts to imitate one another, and they forget about what they're doing in the first place. It leads to excesses.”- Michael Mauboussin
The art of economics consists in looking not merely at the immediate hut at the longer effects of any act or policy; it consists in tracing the consequences of that policy not merely for one group but for all groups—Henry Hazlitt
Monday, July 24, 2006
Research Process, Value of Time and Probabilities are Key to Outperformance
Domestic Political Developments Unlikely to Drive Markets
Figure 1 Moneyandmarkets.com: Commanding Share of 
Thursday, July 20, 2006
CBS Marketwatch Mark Hulbert: Explanations R US
The gullible investing public have been regularly inured to believe, especially by mainstream media and their coterie of analysts, that non-economic events (wars, natural calamities & etc.) have significant impacts in the activities in the financial markets. But do such events really move markets?
Monday, July 17, 2006
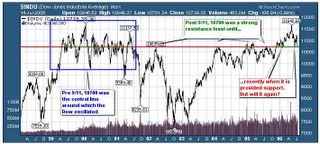
Dow Jones 10,700: Marking the Line in the Sand?
I had been looking at 10,400 level, about 10% from the recent highs, as a possible threshold level, but maybe have found a clue from Stockcharts.com's Chip Anderson. According to Mr. Anderson...
"Three big down days have sent the Dow back down to the 10,700 support level. What's that you say? 10,700 is just a number? Just a number like any other? Oh really? Check out this chart:
Sunday, July 16, 2006
Mixed Market Signals, Unfolding Business Cycles
``Ignoring market risk will mean that, from time to time, performance will be lumpy...The fund is unlikely to outperform benchmarks consistently. Rather, the goal is to outperform on average, most of the time, and over the long run.''- Martin Whitman, manager since 1990 of the $8.3 billion Third Avenue Value Fund.
While I might have been right about rising gold prices, the correlation between non-US equity benchmarks, particularly of the emerging market ones, and rising gold prices appears to have broken down.
Figure 2: Stockcharts.com: Rallying US dollar Index and Morgan Stanley Government Securities
Figure 5: Absolute Partners: Average Returns by stage of the Business cycle
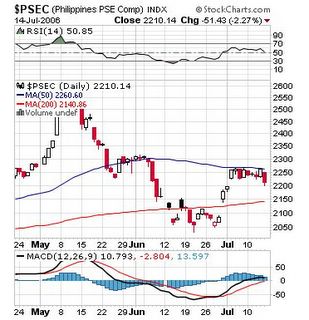
Figure 6: stockcharts.com: Phisix in a Predicament

Lebanon’s Proxy War may lead to $85 to $100 oil?
Last week, I mentioned that crude oil treaded at a critical juncture looking for either a correction or a breakout. With the market’s declarative stand, Oil finally resolved the impasse with a breakout to a FRESH record nominal High. Its sibling gold was equally buoyed as shown in Figure 1.
Figure 1 stockcharts.com: Record Oil, Gold Follows

Politics, Flawed Policies and the Road to Hell
``But there are many others who are not bashful about using government power to do "good." They truly believe they can make the economy fair through a redistributive tax and spending system; make the people moral by regulating personal behavior and choices; and remake the world in our image using armies. They argue that the use of force to achieve good is legitimate and proper for government - always speaking of the noble goals while ignoring the inevitable failures and evils caused by coercion. Not only do they justify government force, they believe they have a moral obligation to do so.”-Congressman Ron Paul of
Friday, July 14, 2006
Crude Oil hits Fresh Record at $78 per barrel amidst Media's stoicism
Anyway, what media papers over is what we deal with. According to Bloomberg (you may click on the link for the entire article),
Hezbollah militants fired rockets from Lebanon into Israel's third-biggest city after Israeli forces bombed Beirut international airport and other targets. A Nigerian newspaper yesterday reported that rebels had attacked pipelines, later denied by the owner of the facility, Italy's Eni SpA.
``There's real disruption to supplies in Nigeria, potential disruptions in Iran, and now you've got what's happening in Israel,'' said Tobin Gorey, commodity analyst at Commonwealth Bank of Australia Ltd. in Sydney. ``Who wants to sell in this environment?''
Crude oil for August delivery rose as much as $1.70, or 2.2 percent, to $78.40 a barrel in after-hours electronic trading on the New York Mercantile Exchange. It was at $77.95 at 7:45 a.m. in Singapore, 35 percent higher than a year ago.
Monday, July 10, 2006
Phisix, Peso Driven by Fedwatch Plays; The Gallery Experience
Figure 4: Phisix (candlestick) and the USD/PESO (blue line)

Record High Oil Prices and Interventionist Policies
``Since
Figure 1: stockcharts.com: benchmark WTIC Crude oil at a trading range?
Figure 2: Chart of the day: Inflation adjusted Oil prices
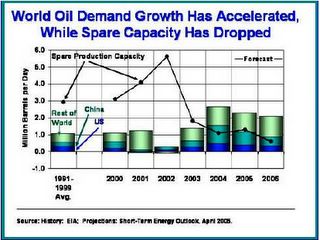
If government’s directives have been efficient, why has there been a massive shortage of investments by both public institutions and the private companies? Why has the demand-supply imbalances remained unresolved, if not aggravated? Or simply, why have oil prices persists to remain at lofty levels? And again, who pays for such miscalculations or ineptitude? Obviously, the people/consumers/constituents who ironically had been the intended party to benefit from supposed control. Whereas in the free markets erroneous decisions lead to individual losses or bankruptcies, flawed government policies have been borne by the citizenry or constituents via increased taxations or loss of purchasing power which essentially leads to the deterioration of the standards of living.
Figure 3: Energy Letter: Global Rig Count (April)
Investment implication: the obvious trend is to search for junior explorers who could build up sizeable reserves and become likely acquisition targets by Oil Majors. 
Monday, July 03, 2006
Bullish Gold Backed by Gold/Oil Ratio
Figure 5 Stockcharts.com: Holding WTIC Crude (candle) amidst financial market turmoil.
Figure 7 Dailywealth: Gold/Oil Ratio: Gold cheaper than Oil

Fed Dilemma: Too Much Pressure To Continue Hikes
Yes, I have raised such concern that the Fed may initiate a pause or even a succession of rate cuts on the premise of an adverse
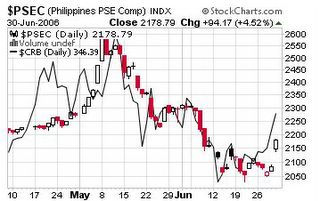
Figure 3 Stockcharts.com: Rebound in Phisix (candle) and CRB Index (line chart)
Figure 4 Economagic: Looks like a 40-year trough-to-trough cycle for benchmark treasuries

EZ Money Addicts and Pavlov’s Drooling Dogs
Figure 2 Stockcharts.com: US Dollar (left chart) and benchmark US Treasury Yields (right chart-candlestick) breaks down, while JP Morgan Emerging Debt (line chart) Rallies
In other words, while the endemic systemic risks have been mounting worldwide for quite sometime now, global financial markets have been inured if not hardwired into believing of the constancy of advancement, irrespective of the enormous leverage latched into the system. That’s how rational the markets are. Add leverage in order to advance the financial markets, which should translate to economic growth.


