Sunday, November 05, 2006

Asia’s Micro Bullish Case: Dividend Yields and RoE

``ASEAN is something of the forgotten entity in Asia these days as investors obsess over China and India. Still it is a very large region with many unique strengths and we remain focused on its long-term potential as a home to many excellent Asian companies. Thailand is one of the world’s great tourist destinations and one of the largest agricultural exporters. It has quietly built a significant automotive industry in recent years. Singapore has come out of a long slump and is enjoying the lowest unemployment rate in over a decade. Indonesia has been a darling of global investors and its very young democracy continues to make progress against a host of challenges. The region is finding a way to provide goods and services to China, Japan and India, with entrepreneurs as the real driving force, not the politicians or generals.”- Mark W. Headley, President and Portfolio Manager, Matthews International Capital Management, LLC

Finally, going back to Asian markets, the bullish case for investing in equity markets in Asia aside from the macro prospects are also due to the corporate fundamentals, i.e. steady improvements on Return on Equities (RoE) and above par dividend yields


Figure 6: Guinness Atkinson Funds: Steady Improving Returns on Equity

According to the latest Asian Brief by Guinness Atkinson Funds (emphasis mine), ``Over the last eight years attitudes in Asia have changed; markets and customers have grown more sophisticated as have the companies that serve them. Asia is still a high growth area and there are young and high growth companies emerging all the time. But there are now many more established businesses operating in this high growth region. These businesses now focus more on their main activities, have divested non-core divisions and are concerned more with profitability than empire-building.

``This has led to a big increase in the number of dividend paying companies in Asia and has also led to Asia becoming one of the highest yielding regions in the world…It stands in marked contrast to stocks in developed markets such as the US where the dividend yield is hovering around 2% and where the payout ratio has declined over the past 10 years.”

Dividend Yield 2006E (%)

Dividend Yield 2007E (%)

Payout Ratio

2007E (%)

China

3.17

3.83

41.86

Hong Kong

3.64

3.99

52.97

Indonesia

3.52

4.50

49.10

Korea

2.23

2.54

23.63

Malaysia

4.62

4.62

57.85

Philippines

3.89

3.38

45.60

Singapore

4.58

4.11

58.88

Taiwan

3.95

4.48

55.45

Thailand

4.83

4.92

44.82

India

1.70

1.89

20.94

Asia ex Japan

3.29

3.65

41.43

Table 1: Guinness Atkinson Funds: Asian Dividend yield

Corporate fundamentals, aside from the hunt for yields, have been the flanking support drivers for the Asian Markets, backed by many high growth areas/opportunities, improving returns on equities and rising dividend yields in general (except the Philippines, Singapore and Malaysia), as shown in Figures 6 and Table 1, courtesy of Guinness Atkinson Funds.

This should enlighten us why the region has become a magnet for cross-border capital flows and reinforces my belief that the secular advance phase of the Philippine financial markets has an ocean of expanse for growth OVER THE LONG TERM HORIZON. Posted by Picasa

Sunday, October 29, 2006

Should You Invest in the Phisix Today?

``People still want to believe in magic. Newsletters are the equivalent of magic. They are like prayer wheels for Tibetan monks. "Just write down a few prayers, paste them on a spinning wheel, and put the wheel in a breezy location. Then forget about it." They expect the wheel to bring blessings...People say, "I want specific advice." Most people really don't. Instead, they want pages of specific advice, so they can say in two years, "There was just too much advice, so I did nothing."...Why else do they read investment newsletters? For the same reason that men read "Car and Driver." It's low- risk fantasy...”-Prof. Gary North

With the Phisix successfully carving out a new landmark high, I know, many of you are now close to celebrating a festive Christmas season, especially those with well-cut diversified portfolios. However, expectations and realizations of such goals are two distinct animals. The Christmas Bonus question is, will the Phisix continue with its serendipitous roll?

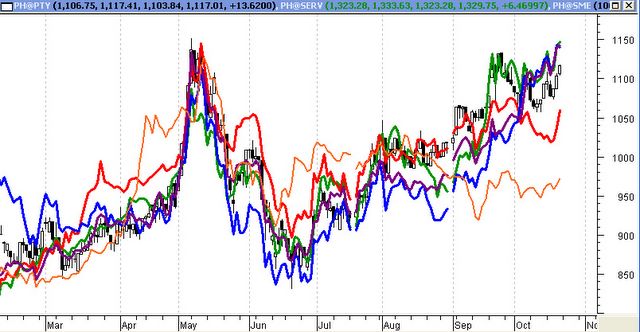
First of all, to broaden our visual spectrum, it is not only the Phisix that have been on a streak, Philippine assets as a whole as signified by the Peso, sovereign bonds and to even credit default swaps have either hit new landmark territories or are close to establishing milestone records.

The local currency, the Philippine Peso broke its psychological threshold level of Php 50 to a US dollar, was up .57% for the week at Php 49.82, marking its highest close since May 23, 2002, according to Bloomberg. Yet, but before anyone gets too agog to cite the wonders of “stabilizing” domestic politics or progressing microeconomics as the marvel behind this unfolding phenomenon, one must not forget that the Asian Currency universe has been mostly treading on new heights even prior to our Peso’s renascence. For instance, this week, coincidental to the rising Peso, the politically scourged Thai Baht likewise etched record levels, according to Bloomberg, ``Thailand's baht climbed to the highest since January 2000 (emphasis-mine), as foreign investors bought equities on optimism growth will accelerate.” Ergo, we are not alone.


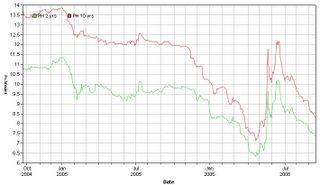
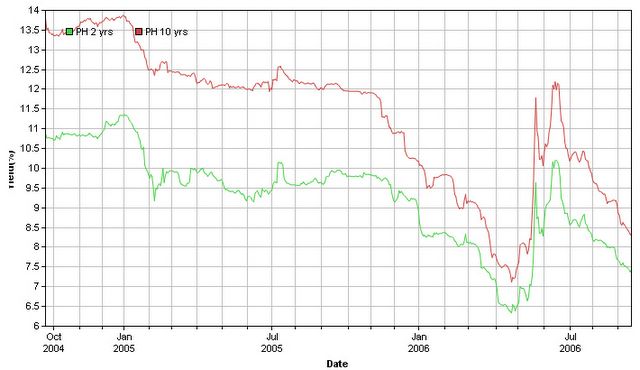
Figure 1: Asianbondsonline.com: Fierce Rally in Philippine Sovereign Bonds

While it took a rather lengthy period for Philippine bonds to rally (since 2004), following the May’s ‘risk aversion’ scare, our sovereign instruments took off dramatically over the past quarter, as shown in Figure 1 (Falling bonds yields are inversely related to Bond prices). According to the Philippine Daily Inquirer, ``Philippine 2016 bonds were traded at 111.50 and its 2031 bonds were at 109, a record high.”

Not limited to bonds, even derivative contracts as Credit Default Swaps have been gaining new record levels, again from the same Inquirer report, ``Five-year Philippine credit default swaps -- insurance-like contracts that offer protection against debt default or restructuring -- came in to a record low of 135/138 basis points.” With investors pricing our default swaps at a record low, this suggests that the Philippines would be less likely to emulate the Argentine paradigm.

Even the Philippine government’s Napocor which had in previous outings encountered difficulties raising funds, recently reaped a whirlwind of demand for its securities from the international credit markets to raise $500 million in a breeze; its offering was reportedly oversubscribed by 5 times!

No, I think that Philippine assets have not been rising primarily out of country-specific developments, as some others suggest, but rather surfing on a wave of a backstop of exploding liquidity in the global financial realm.

Back to the Philippine Stock Exchange; our Phisix indeed had a rather awesome week topping Asia’s key benchmarks with a sizzling 3.25% advance. Including the previous week’s advance, the Phisix has had a cumulative gain of about 145 points or an eye-popping 5.67%! And to consider, since the week that ended on August 25th, the local bellwether has been up in 8 out of 9 weeks to post a whopping 18.8% gains!

While on a year-to-date basis, the accrued gains of the Philippine benchmark has reached 28.93% as of Friday’s close. To consider, based on seasonality factors, the last quarter of the year has, statistically speaking, been the strongest or the most favorable environment for equities!

Year End


Phisix

Y-o-Y variance

27-Dec-96

3,170.56


29-Dec-97

1,869.23

-41.04

29-Dec-98

1,968.78

5.33

29-Dec-99

2,142.97

8.85

29-Dec-00

1,494.50

-30.26

28-Dec-01

1,168.08

-21.84

27-Dec-02

1,018.41

-12.81

30-Dec-03

1,442.37

41.63

29-Dec-04

1,822.83

26.38

29-Dec-05

2,096.04

14.99

Table1: Phisix Year on Year Changes since 1998

Defined in the following table (see table 1) is the year-on-year changes by the Phisix in the course of the past ten years. It must be remembered that during this span of time, the Phisix appears to have segued into two phases; first the declining phase of 1997-2002, then the recovery phase, 2003 until the present.

At the present circumstance, the Phisix looks poised to match or even possibly supplant the gains erected in 2004 (+26.83%), if it manages to hold current levels by the end of this year. Moreover, if the present momentum persists, the baptismal surge to hallmark the Phisix’s pivotal reversal could likely be an achievable target.

Now to offset my ‘framed’ optimism on you, I wish to also point out that despite the declining phase of 1997 to 2002, there had been two years where the Phisix actually registered advances. This means that it is natural to expect a cyclical rally within a secular bear market phase and conversely, a cyclical decline within a secular bull market.

Now if the Phisix would for instance, continues to prove its ‘Midas Touch’ to possibly end this year for its fourth successive yearly gain, especially with continued clip of outsized returns, then the law of averages or the market’s mean reverting tendencies could translate to a larger-than-average probability that the Phisix could suffer a pullback by next year. Put bluntly, you should expect negative annual returns in the future even if such cycle remains on the upside. One must be reminded that NO trend goes in a straight line!


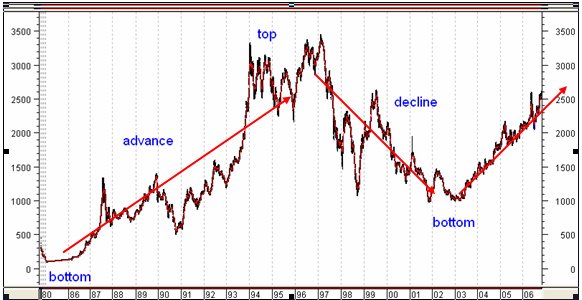
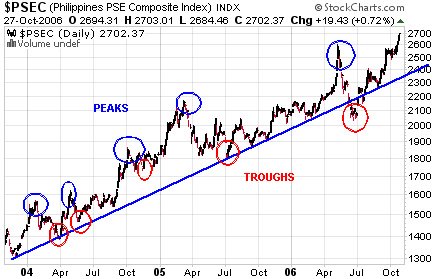
Figure 2: Stockcharts.com: Phisix’s Peaks and Troughs

It is said that one of the key defining advantage of mankind over its antecedents is our ability for pattern recognition. This method of supervised learning enables us to manage our lives for the better with constant invention and utilization of various tools or instruments to measure, control or manage risk. Applied to the markets, such variegated templates of patterns can usually be seen through the price behavior of securities, which incidentally signifies the collective investor’s outlook as determined by actual transactions (not polls/surveys).


Approx Period


Approx


Peak-to-Peak


Peak-to-Trough

Date

Peak

Gains

in Months

Date

Trough

Declines

in Months

22-Jan-04

1,572.21


28-Apr-04

1,620.37

3.06

3

29-Mar-04

1,385.16

-11.90

2.00

05-Oct-04

1,865.64

15.14

6

19-May-04

1,465.36

-9.57

0.50

08-Mar-05

2,172.76

16.46

5

12-Nov-04

1,734.10

-7.05

1.00

08-May-06

2,602.46

19.78

14

4-Jul-05

1,805.49

-16.90

4.00


21-Jun-06

2,034.49

-21.82

2.00


Table 2: Phisix Peak-to-Peak and Peak-to-Trough Patterns

Since the Phisix has broken past its critical threshold level of 2,602 with much OOMPH, as shown in Figure 2, maybe history could help us identify where this should lead us, in the assumption that external developments remain favorable to equities.

Table 2 in support of the chart, shows that since the Phisix reversed from its descending phase in 2003, the previous 5 watermark highs, as manifested by blue circles, over the present cycle reveals that gains based on a peak-to-peak basis have been ratcheting upwards. While the said sample is insignificant to draw a valid qualitative forecast, my four-leaf clover guess is that if the present momentum holds, then a 15% gain (it took 5 months to overtake the previous high, so I took the least % of returns over a similar period) from its previous peak of 2,602 may imply a 2,992 or a 3,000 target for the Phisix. Essentially, on a year-to-date basis, this translates to more or less 42% gain which fundamentally surpasses that of 2003!

In the same context, one should note that higher gains have likewise meant greater volatility. The same table shows that on a Peak-to-trough basis (troughs represented by red circles), the arithmetic mean for the 5 episodes of retracement is roughly 13%. Put differently, once the Phisix concludes a new high and goes into a “major” correction mode, the likely target for a retracement bottom would be 13% off from the Phisix’s new high.

So, at this instance you are equipped with a guidepost or an estimate of the possible price behavior of the Phisix. Yet, how I wish markets could be as simple as this, but they are not. They are hardly an exact science. But we can definitely work on playing the odds.

Now, given such approximations, would it be feasible to inject new money into the Phisix in light of the present circumstances?

If our target for the Phisix (30-company index) is 3,000 as explained above, then from Friday’s close of 2,702.37 suggests of a yearend % potential gain of 11%. On the other hand, based on my computed arithmetic mean, the possible downside is 13% from an upcoming peak which has yet to be identified.

Let us assume that if the Phisix does hit the 3,000 target by yearend and a possible 13% decline ensues, this should translate to a Phisix at 2,610 which is essentially lower than Friday’s close, and therefore implies that positioning at current levels would be a losing proposition, unless of course we can get to be lucky enough to accurately time the markets or if the Phisix manages to run past 3,000 by a significant margin.

In a different perspective, given the context of my assumptions, with an 11% prospective gain slightly eclipsed by a potential 13% prospective loss, the risks factors have evidently grown larger than potential gains, while simultaneously the present climate tells me too that our cost of capital have risen significantly relative to the potential returns on our invested capital and most importantly, considering today’s “euphoric” sentiment, there appears to be more “greater fools” found in the market today rather than “money” to be made. In short, before one reckons on investing on Phisix issues, one must be made to understand that the GIST of the present gains APPEARS TO HAVE ALREADY been made!

Therefore, in consideration of the persistence of today’s buoyant sentiment, I would reckon to either invest on issues with potentials to deliver over 15%, possibly on second or third tier issues which should benefit from the ongoing market’s rotational activities, or stay on the sidelines and await better times. Remember, should you decide to take upon today’s risks, then managing risks means knowing how much stake to put at risk.

Another not so bright scenario working against today’s high octane markets is that based on the charts, the Phisix has been quite overextended in terms of being overbought and is due bound for either a short-term pause or a natural corrective phase within its present momentum. I say present momentum with reference to the continuity of its interim uptrend, in contrast to a “major” corrective mode (potential 13% decline). Yet it is important to note that in bullmarkets, overbought conditions could go into the extremes, and vice versa for bearmarkets, which makes trading anticipation rather complex, if not abstruse. As mentioned above, patterns in markets are not something definite as to repeat exactly, but as Mark Twain puts it, it may “rhyme”. Prudent investing means measuring your potential gains against your potential losses and naturally, take on the appropriate action. Posted by Picasa

Excess Liquidity: Finding a Home in Assets Despite A Looming Slowdown

``There is no means of avoiding the final collapse of a boom brought about by credit expansion. The alternative is only whether the crisis should come sooner as a result of a voluntary abandonment of further credit expansion, or later as a final and total catastrophe of the currency system involved.”-Ludwig Von Mises

Taking the insulated prism of the Phisix without considering global fund flow dynamics into our markets lends to serious misdiagnosis, something so prevalent in today’s media, whose penchant is to oversimplify, in describing today’s activities.

Foreign money flows are at the margins LARGELY responsible for the appreciating Peso, surging domestic sovereign instruments and rampaging equity prices.

This globalization of cross-border portfolio flows could be seen even in the US, which has capitalized heavily on global flow dynamics to fund its debt-driven asset-dependent economy as depicted in Figure 3, courtesy of Yardeni.com.

Figure 3: Yardeni.com: Flow of Funds: Foreign Capital Flows in the US (upper pane) Financing Its Trade Deficit (lower pane)
Therefore understanding the mechanics of money flux by overseas investors or institutions has been the locus of our analysis.

I noted in the past that Global markets have been synchronically rising on expectations that a cooling off in the premiere consuming economy of the world would result to a more conducive financial environment for the asset markets; euphemistically, more leveraging for speculation purposes.

It is in the theatre of the absurd where we would find the investing public applauding on the expectations that record high corporate earnings will maintain its robust levels in the face of an overall cooling growth climate to justify for higher multiples.

The significant upside rally seen in the leadership of US equities, specifically the Dow Jones Industrial Averages (+12.8% year-to-date) since its July lows (+12.6%~gist of the gains came from the July 14th rally and so as the Phisix 22.27% out of the 28.93% year-to-date gains or 77% of the y-t-d advances) essentially boils down to Friday’s US GDP report as shown in Figure 4, courtesy of Northern Trust, which finally has given the major benchmark a raison d'être for a pause from its extraordinarily high adrenalin motion during the last quarter...a probable sell on News. It is in high likelihood that the Phisix will equally find a reason to correct on Monday.

Figure 4: Northern Trust: Declining GDP Reflects Soft Landing?
According to Asha Bangalore of Northern Trust, ``Real GDP grew at an annual rate of only 1.6% in the third quarter -- the smallest gain since the first quarter of 2003 when the economy poked along at a 1.2% clip. The U.S. economy has recorded the weakest 2-quarter growth since the two quarters ended 2003:Q1...The prospects of a quick pickup in growth in the fourth quarter are dim. Output of motor vehicles made a hefty contribution 0.7% point to real GDP growth in the third quarter.” In other words, a statistical fluke from the output of motor vehicles was responsible for giving US GDP a hefty lift, such that withholding these factors, the stated GDP figures could have been drastically weaker.

Yet with such dour outlook, the Dow and other US benchmarks fell modestly, instead of a rout.

There are those who argue that in spite of the Dow Jones’ reanimated rebound, the supporting indices as the Nasdaq or the S & P 500 have not risen to surmount their previous highs as the (30-company) Dow index. Moreover, there are those who question that the resurgent Dow Jones has been limited to a select few issues whereby none of the components have broken to NEW record highs, despite the record levels attained by the major benchmark, while about half of the component issues are still trading considerably underwater (over 20% below) relative to their 2000 highs. Even some argued further, that the Dow Transports which if based on the Dow Theory has so far failed to confirm the rise of its sibling index (Figure 5), aside from arguments that the Dow’s rise has been due to its structural composition being mainly price-weighted.

Figure 5: Stockcharts.com: Dow Theory Non-Confirmation? Dow Transports (red candle), DJIA (black line)
While these views have my sympathy, I think that most of these observations are in a state of denial considering that Dow Jones Industrial Average (DJIA) has actually led if not inspired all other benchmark higher, despite their below record performances including that of world indices.

Even if such actions were borne out of surreptitious intervening activities of the Plunge Protection Team, or Executive Order 12631-Working Group of Financial Markets, a supposedly covert US government body led by the US Federal Reserve with purported ``goals of enhancing the integrity, efficiency, orderliness, and competitiveness of our Nation's financial markets and maintaining investor confidence”, my point is global markets have chimed. They can manipulate one or two markets but for a whole spectrum of markets around the world would be close to impossible. Besides, manipulative activities have short-term effects and the likelihood is that the present underlying efficacies will erode over the long run, if indeed downright cooked.

Yes, the Dow and other key US benchmarks are likewise in strenuously overbought conditions and may retrench as they find an opportunity to do so, but my point is unless we see a genuine divergence, or moving in the opposite direction in contrast to the DJIA, by one or some or a combination of the other indices, to wit, the Nasdaq, the S & P 500, the NYSE, Russell indices or the Dow Transports, et. al., it would be impractical to dismiss outright the actions transpiring in the US equity markets as a nonevent.

Figure 6: Stockcharts.com Bullish signals from Gold
In addition, if one vets on the intermarket activities, only POLITICAL “INFLATION” associated commodities, particularly Gold (see Figure 6) and Energy commodities appears to be under pressure, despite the “significant” moderation seen in the US economy. Now with US elections coming in early November any incentive to “manipulate” these markets or any other markets may eventually wean.

In essence, mainstream economists and pundits will argue about the technicalities of the opposing potential directions of inflation (as measured in goods) in the backdrop of a supposed cooling of world economic growth led by the US, yet we are seeing a rebound in most asset prices globally, which is quite ironic. The US economy may have slowed during the third quarter, but obviously friendly and loose credit conditions have softened the impact of such slowdown. Will these conditions continue?

Since I think that today’s markets have been mainly liquidity and liquidity “expectations” driven, any furthering or reversal of these conditions will lead or dictate upon the directions of the world financial markets, be it in bonds, currencies, commodities or the equities or our own Phisix.

As liquidity conditions remain lax, and bountiful credit intermediation persists, and importantly, expectations of such conditions to remain in place; excess money will be finding a home in assets, notwithstanding a slowdown. Posted by Picasa

Monday, October 23, 2006

Exogenous Risks Amidst A Milestone Phisix High

``It is a mistake to try to look too far ahead. The chain of destiny can only be grasped one link at a time.”-Winston Churchill

As expected, the porous events unfolding abroad finally permeated to our own market as the Phisix blasted away from its May high hurdle to establish a 7-year landmark! Exciting right? This means that the July 5, 1999 high of 2,632 and its respective close of 2,621 is merely a breath away from last Friday’s close! A breach of this threshold level suggests that the Phisix would take at aim at its next goal of 3,447.6 (reached last February 3rd 1997), its ALL-TIME high!


Figure 1: Stockcharts.com: Phisix Charges to a 7 year high!

As Figure 1 courtesy of stockcharts.com shows, the Phisix now appears to be headed for the resistance level of its current channel (two blue lines) estimated at 2,670-75. Present momentum could push it towards these levels before a retreat ensues. But remember, I wouldn’t put so much emphasis on the Phisix alone, as I have previously noted, activities in Wall Street appears to be directing the flow dynamics of the world financial markets, inclusive of world equities or the Phisix. In a financial world with increasingly seamless borders, a singular focus on domestic analysis as drivers for the local market is a grave mis-analysis.

This outperformance of the Phisix, up an astounding 2.35% for the week, was surprisingly second only to Pakistan’s Karachi 100, which had a scorching 5.87% advance. Of course, this has been a worldwide phenomenon. World equity markets or even emerging market bonds have been on fire lately.

If you ask me anew, what all these “optimism” is all about? My repeated succinct reply as enunciated in my previous outlook is that all these have been mainly liquidity driven (expectations for loose money environment or room for further leveraging or veiled inflation channeled via asset prices).

Today’s financial world has been at the core of world economies, especially that of OECD economies or of the industrialized world. The financial markets have greatly outdistanced in magnitude the real value of the exchange of goods and services. Credit markets have grown itself a size with the help of technology, to engender innovative “financial intermediation” products enabling investors to shore up speculative positions compared to real investments. Again, the praxeological (``individuals engage in conscious action towards chosen goals”-Murray Rothbard) impulse...the stretch for yields!

Massive productivity growth coupled with weak real investments has led to outsized global current account imbalances which at the same time fueled worldwide asset speculations. In fact, one of the peculiar outgrowth of today’s financial structure has been that of “savings” or “surpluses” (Bernanke) from Emerging market economies “financing” the industrialized world. To say differently, believe the unbelievable...the Poor have been funding the Rich! Talk about inequalities or absurdities!

Now since the world is highly dependent on “wealth effects” from the world’s major consuming nations, it is but natural to revolve around on loose money/financial conditions to buttress further leveraging in an ever growing reliance for asset-based economies in the industrialized world. Hence the so-called spin on “low inflation expectations” which are nothing more than camouflaged excuses or alibis for maintaining the status quo or pining for the perpetuation of conditions conducive for more leverage. Give an inebriate more alcohol or an addict more of the substance!

Moreover, in a world of diminishing returns and intense competition, greater leverage is necessitated to accentuate yields. Last week, I quoted IMF’s Rajan who simply validated our standpoint that liquidity drivers have not been dependent on the traditional banking sector. He notes that “80% of value added is found outside the banking sector”, where non-bank activities has been “increasingly central” to economic activities and not to its traditional role of “passive holder of assets”. Thereby, several analysts focusing on bank aggregates as measure of world liquidity have been bewildered if not stupefied by the baton turnover from stocks to real estate and now back to equities. Yet, this is what has been occurring, in the US, to quote favorite analyst Doug Noland, ``The sharp slowdown in home sales activity is offset by more aggressive home equity, credit card, and small business lending. Almost across the board, commercial lending volumes are strong.” Inflation manifestations have been rotating.

Nonetheless, the greater the leverage, the higher the risks! But who is to say the music should stop (not me!), when the going even gets better! More dosage please?

Let me cite you an example of what non-traditional non-bank liquidity to the ever-increasing levered world means, from Randall Forsyth of Barron’s, ``Credit default swaps allow investors in risky assets to, in effect, buy insurance against something bad happening, just as a homeowner transfers the risk to an insurance company writing the homeowner's policy. But flood insurance has not reduced the chance of a hurricane. Indeed, flood insurance has increased the chance of a hurricane hitting a populated area by letting people build houses at the shore, seemingly without risk. In the same way, credit derivatives don't eliminate credit risk but arguably facilitate it. In so doing, the risk to the entire system has increased.” As somebody else or some other party takes on these transferred risks, risk taking appetite becomes even more proliferate or expansive. People or the investing public become less risk averse and gravitate to even illiquid stakes, which becomes a question of growing “Moral Hazard”?

Allow me another pertinent quote from IMF’s Raghuram G. Rajan (emphasis mine), ``The problem when the world has excess desired savings relative to investment, and when central banks are accommodative, is that it is awash in liquidity. Many investment managers can enter the business of liquidity provision, and even as they take ever more illiquid positions, they compete away the returns from doing so. The point is that current benign conditions engender "illiquidity seeking" behavior. But they could have worse effects.


Figure 2: Daily Wealth/Stockcharts.com: Where is the Fear?

And in the circumstances of a highly levered world, risk taking via more margin or borrowed bets becomes increasingly systemic!

Borrowing the memorable words of Nixon’s economic adviser Herb Stein, ``if something's unsustainable, it tends to stop”. Oh yes, it will one day. As to the timing, this is greatly beyond my ken or anyone else.

Now to balance your ecstatic outlook, figure 2 shows that US equity markets showing signs of pervasive confidence...the public getting lax and showing signs of more complacency!

Back to the Phisix, this next chart has been a favorite of mine (see Figure 3), I’ve been showing this since 2002 (Recall, Index Trading Edition?) and more importantly this cyclical chart has performed “Luckily” in my favor, thus far, even as the consensus had been stridently cynical then.


Figure 3: Phisix 20-year chart: Working towards a full-cycle?

In conversation with some market participants, to my surprise I figured that only a few have been seemingly aware that the Phisix is only about 25% shy of its record HISTORICAL high of 3,447 in 1997.

Let me reiterate, if I am right about the secular phase for our domestic market, which is supposedly operating in an environment under an advancing or (drum roll please) bullmarket phase, then the 1997 high would eventually be taken out in a cinch.

I may not be sure of the timeframe simply because I am not your Madame Auring (a famed local seer). I can’t read the minds of the investing public overnight, but certainly can use tools or indicators to measure it....(read my lips!) O.V.E.R.T.I.M.E. Time distinctions vary a great deal relative to risks-return analysis, example the shorter the time frame the greater the risks.

However, it is important to note that it is the characteristic of bullmarkets to replace previously established highs with FRESH record highs. That is why I’ve repeatedly said to you that at least 10,000 Phisix is a possibility in the future. No, I didn’t pick the figure from the sky...the rising Peso, restructuring of regional investment, trade and financial flows, growing evidence of increasing financial integration with our neighbors, demographic trends, et.al...as LONG-TERM fundamental drivers behind such target.

But enough of cheerleading, there is no shortage of immodest Panglossians in today’s perky atmosphere. We must continue to guard against complacency. Nonetheless, in my view, the epigram of William James (1842-1910), US pragmatist philosopher captures overconfidence at work, ``A great many people think they are thinking when they are merely rearranging their prejudices.” Posted by Picasa

Lagging Mines: Not For Long I Suppose

``Value is not embedded in the material properties of any good or service. Neither does a thing acquire value merely because labor was employed to create it. Value is not dictated by the production process or social conditioning. An economic good is valued because an individual mind values it. It is a product of the human mind.”-Jeffrey Tucker, Fortune Cookie Economics, Editor Mises.org


Figure 4: Rising Tide Lifts All Sectors?

Figure 4 shows, that aside from the rising general breadth of the market as the Phisix advances, sectoral indices (Property-candle; Banking- Red, Holdings-Violet, Services-Green, Commercials-Blue and the Mines and oils- Orange) have likewise been in close chime to the upside....except for the mines and oils (which outperformed earlier on the year).

The global selldown in the metals and energy prices have been used as a yardstick for “lower inflation” and has been a significant contributing factor to the weakness in the mines and oil sector of late. Aside, the outstanding gains, during the 1st semester by today’s lagging sector, have emasculated somewhat the overwhelming bullish sentiment built then. This could have possibly influenced its latest underperformance. But signs are such underperformance wouldn’t last...


Figure 5: Growth Stock Wire/Stockcharts.com: Unblemished seasonal Record for Oil stocks since 2002

Jeff Clark of Growth Stock Wire pinpoints consistent October bottoms since 2002 for the Oil stocks sector abroad as shown in Figure 5. With today’s rampaging equity markets, there is such possibility that global economies could surprise to the upside for the last quarter this year despite the much touted real estate slowdown.

It is important to note that the rotational activities in the asset sector indicate a shift in the inflationary manifestations which remains copious in the system despite the actions of the US Federal Reserve and the world central banks (remember, Rajan’s 80% non bank value added in the financial system). This could suggest for a subsequent rise in energy prices too and a corresponding rebound in metal prices, led by gold (looks consolidating as with global mines and poised for a second wind). As an aside, the pronounced cut in productions by OPEC could be a factor too (but I doubt so, considering their previous tendencies to cheat on quotas).

I also think that the eve of US elections could presage for a rebound in benchmark commodities, thereby, percolating into the domestic arena too.


Figure 5: Kitco: GFMS Base Metal Index: What Weakness?

It’s difficult to suggest for a demand induced weakness, as I had been earlier expecting or suspecting, if as measured by commodities, we see base metals on a blistering streak, Figure 5. As you can see, inflation manifestations reveal itself in different avenues unequally.

Consequently, improving OVERALL sentiment in the local market plus a turnaround in the prices of oil/energy (hopefully) should boost prices of local mines/oil to run at par with the rest of the market possibly until the yearend, in condition that external markets remain favorable.

However, we must be reminded that there are risks out there as described earlier, mostly exogenous in nature that are real enough to heighten volatility and destabilize world markets including ours and could risk expunging present gains. We are living in very interesting times.Posted by Picasa