Sunday, December 10, 2006

Watching Global Liquidity Amidst A World Economic Slowdown

``Political risk is no respecter of boundaries, and First World country politics could get increasingly ugly in the coming years as demagogues come to power and Western welfare regimes implode. That means we'll have to absorb some volatile swings… but it won't stop us from making good money.”- Justice Litle

I made my case in my previous edition, Should You Invest in the Phisix Today? (See Oct 23 to 27 edition), where I believe today’s bullish interim cycle is close to its maturity, subject to risks of correction from the market cycle’s mean reverting tendencies, aside from risks of arrant complacency and a murkier economic outlook for 2007.

However, global liquidity remains an insuperable force for the global financial markets, which means, what we want to watch is how global financial markets react to liquidity flows while global economies rollover following 4 years of exceptional performances.

So far global liquidity remains unblemished. ``While US commercial banks continue to provide lots of liquidity to the domestic economy, US mutual fund investors continue to do the same for both the US and overseas stock markets. These investors poured $592 billion into mutual funds over the past 36 months through October. They've done very well for themselves. The net asset value of US mutual funds increased $2,232 billion over the past three years to $5,670 billion. So, net capital gains totaled $1,641 billion over this period. Over the past 36 months, $333 billion, or 56%, of the inflows into US mutual funds poured into funds that invest overseas”, comments the ever Panglossian Dr. Ed Yardeni of Oak Associates Ltd.


Figure 5: Yardeni.com: Massive Fund Flows into Global and Emerging Mutual Funds

Figure 5 shows of the massive liquidity spilling over into the world and emerging market equity mutual funds.


Figure 6: BCA Research: Emerging Markets Preparing for a breakout

An even more bullish liquidity based outlook from the widely respected independent research agency, BCA Research, as shown in Figure 6.

Let me quote BCA (emphasis mine), ``Emerging equity prices have yawned lately at weakening growth numbers out of the U.S., China and emerging Asia, even amid technically overbought market conditions. This is an indication that the structural forces of multiple expansion are at work, which will diminish the ability of decelerating growth to inflict substantial damage. Hence, while a near-term correction in prices cannot be ruled out, it will be very mild and possibly even lateral. Meanwhile, other factors remain positives for emerging market stocks. Our measure of global excess liquidity, which typically leads trends in emerging market stocks, points to their outperformance over the next 18 months. Bottom line: investors should start boosting their exposure to emerging market equities on any softness.”

Of course, the assumption from BCA and Dr. Yardeni is that the US would manage to successfully “soft land” its economy or attain the “Goldilocks” (not too hot, not too cold) scenario in the face of a sizably decelerating real estate industry. Aside, they likewise expect that the FED would effectively steer clear from a recession through its monetary policies. In short, they both trust the bureaucracy to succeed at their mission. I don’t.

I am a skeptic of governments. One, a soft landing in the US has been a statistical outlier. And most importantly, the recent admission of Fed’s Bank of Dallas President Richard Fisher of their recent policy “shortcomings” reveals of the “comforting odds of their policy successes”, Doug Noland quotes Dow Jones newswires (emphasis mine), ``If the U.S. Federal Reserve had been aware of actual inflation prior to its recent tightening cycle, policy would probably have been more restrictive sooner, the Fed’s Bank of Dallas President Richard Fisher said… If we had had the correct figures at the time, we probably wouldn’t have kept interest rates so low, for so long,’ Fisher is quoted as saying by the German daily Handelsblatt newspaper… ‘In hindsight, one is always the wiser,’ he said, noting inflation at the time was higher than was visible from the then-available data.” Well, in hindsight, yes. But tomorrow is another matter.

While I agree with both that the Fed and global central banks would strive to keep liquidity ample and maintain loose environment conducive for the furtherance of asset inflation, and being bullish over the long-term over emerging market assets, I wouldn’t dare underestimate the potential risks arising from a paroxysmal unwind from a greater than expected economic slowdown (recession) or a prospective credit crunch from debt overload. Posted by Picasa

Dow Theory: The Emergence of a Divergence?

``Fools try to prove they are right. Wise men try to find when they are wrong.”-Dickson G. Watts

Finally, in my past edition, Excess Liquidity: Finding a Home in Assets Despite A Looming Slowdown (see Oct 23 to 27), I wrote of divergences which may presage for a much needed “healthy” correction,

``Even some argued further, that the Dow Transports which if based on the Dow Theory has so far failed to confirm the rise of its sibling index (Figure 5), aside from arguments that the Dow’s rise has been due to its structural composition being mainly price-weighted...Yes, the Dow and other key US benchmarks are likewise in strenuously overbought conditions and may retrench as they find an opportunity to do so, but my point is unless we see a genuine divergence, or moving in the opposite direction in contrast to the DJIA, by one or some or a combination of the other indices, to wit, the Nasdaq, the S & P 500, the NYSE, Russell indices or the Dow Transports, et. al., it would be impractical to dismiss outright the actions transpiring in the US equity markets as a nonevent.”


Figure 7: stockcharts.com: Dow Theory Divergence?

Then, I refused to join the ranks of the bears calling the rally seen in the US markets as “artificial”, given that it has inspired a worldwide phenomenon of rising equity market benchmarks.

Today, it appears that the 5-month inspirational run by the major benchmark, Dow Jones Industrial Averages, see figure 7, has been unaccompanied or is visibly undergoing some divergence as evidenced by a retrenching Dow Transports (upper pane).

Further, the Dow Transports seems to manifest of a bearish head-and-shoulders pattern (three arrows). Moreover, on the lower panel, the Dow Utilities index has likewise appeared to have rolled over.

The Transport’s Index failure to confirm its sibling’s (the Industrial Averages) test of its recent highs highlights the risks of a “top”. This will be further accentuated by a non-confirmation of the Utilities Index.

For the meantime, while it is too early to call for an inflection point, we will observe in the coming sessions for the continuity of the incipient deteriorations seen in both the Transports and Utilities Indices. Until such will be demonstrable enough to weaken the advances of its major benchmark counterpart the DJIA, we will simply tighten on our stops. Posted by Picasa

Sunday, December 03, 2006

Falling US Dollar Fuels Rising Oil Prices!

``So gold went down because of Volcker and high interest rates and oil went down because of increased supply and also high interest rates. In other words, it's best to think of commodites themslves as money, whether it's oil or gold or wheat.”-Eric Janzen iTulip

One of the more curious episodes in today’s global financial markets is the hullabaloo over the energy dynamics.

Amidst the recent price decline of oil and gas prices as well as its sibling metals, mainstream commentators and analysts piled atop each other to claim the “bursting of the commodity bubble”. Their arguments centered on a single dimensional premise that “higher prices translate to higher supplies”.

While, of course, there is merit to such argument; however, the oil economics is apparently more complex than what is commonly assumed by the public.


Figure 1: stockcharts.com: Oil’s Double Bottom?

For starters, like the currency and interest rate markets, the oil markets operate NOT under free markets, but are heavily distorted by collective government’s hand.

In short, political expediencies dictate on international oil economics more than the other way around. As a result, the increasingly opaque state of market realities leads to a more pronounced investment-underinvestment cycle. For instance, the lack of transparency among the actual reserves by oil-producing states implies for inaccurate forecasts for the supply side of the oil economic equation. The world’s largest oil field, Saudi’s Ghawar was said to have been last audited for its “field-by-field” proven reserves estimates in 1975!

In my previous outlook, courtesy of Jeff Clark of Growth Stock Wire (please see Lagging Mines: Not For Long I Suppose October 16 to 20), he pinpointed that Oil stocks found their seasonal bottom in October since 2001 and has consistently done so. Such seasonal strength could be playing out today, as Oil stocks, as represented by the OIH benchmark, appears to have signaled a rebound in oil prices, represented by the (WTIC) West Texas Intermediate Crude, as shown in Figure 1. The WTIC benchmark leapt 7% over the week.

The double bottom formation appears to indicate a firming momentum for oil prices going forward and may attempt to test its July 14th record high close of $78.71 per barrel over the coming months.

It has been a previous concern of mine that the recent decline of oil prices could have reflected a weakening of demand from the two major growth engines of the world, particularly the US and China. However, the asynchronous signals emanated from the different asset markets, particularly the performances from the base metals group and global stocks, have confounded this concept.

Altogether it seems that far from real economics, global liquidity appears to dictate on the present whereabouts of the diverse asset markets. Put on a different lens, it is not merely demand-supply dynamics that drives world economies today but of the endless creation and intermediation of money and credit (such as structured finance, carry trades, derivatives) that creates an illusionary demand channeled through asset inflation. It has increasingly been a “finance-based” highly levered global economy rather than “real” based one.

Today’s rally in crude oil comes in the face of a supposedly “negative” development for the energy benchmark....above average inventories! According to Bloomberg (emphasis mine), ``Crude inventories fell 360,000 barrels to 340.8 million barrels last week, the Energy Department reported on Nov. 29, leaving supplies 14 percent above the five- year average.”

Yes, crude oil inventories fell this week but are way above its 5-year average, yet oil prices rallied. Why? Bloomberg suggest a simplified answer, ``OPEC decided in October to reduce output by 1.2 million barrels a day starting in November to halt sliding prices.”

You expect OPEC, the purveyor of 40% of today’s oil supplies, to fulfill its avowed mission? Over the past years, the member countries have repeatedly cheated on each other, to pad their reserves in order to get a bigger slice of sales quota. Does one expect them to comply today, given present “high revenue” opportunities? Yet at the end of the day, it’s all about the color of money, isn’t it?


Figure 2: Rallying Commodities Fueled by the Enervated US Dollar

If they [collective oil-producing governments] can’t be candid enough to reveal their true state of proven reserves estimates, can we yet trust them to act on helping resolve the world’s energy or global financial or economic imbalances? How keeping data confidential from each other ever lead to mutual cooperation, beats me? If you trust governments, I surely don’t.

Which leads us to the next premise, the falling US dollar. Does today’s news likewise carry the rational that the collapsing US dollar has been ONE of the major catalysts for today’s rallying oil? Apparently not.

Figure 2, shows you that in the past three years, all peaks of the commodity benchmark, the CRB Index, have coincided with a trough in the US dollar Index. In 2005 where the US dollar staged a mighty rebound (marked by the uptrend in the upper pane and the two vertical lines), the CRB’s gains had been contained. It appears that today’s rallying oil prices has once again mirrored the travails of the US dollar.

Why so? Given that the demand-supply dynamics of a commodity (oil) is in equilibrium, this should translate to a price level which neither goes up or down. However, the fall of purchasing power of the underlying currency (traded in US dollars) causes the price level of the commodity (oil) to go up. So in essence, it is not only your typical supply-demand dynamics that influences oil but also the state of the purchasing power of the US dollar!

Simply, a falling US dollar translates to higher oil prices!

Let me quote Elliott Gue of the Energy Letters, ``The really big jump in demand came from the Asia Pacific region. The entire region, including Japan, China and India, accounts for less than 30 percent of daily demand for crude, but it accounted for well over half of the total jump in demand over the past five years. Trying to forecast global oil prices is really a matter of trying to forecast the future path of economies in the region; Asia is where the marginal demand for energy commodities will come from.”

In other words, if the Asian region constituted the “marginal demand” that has driven oil and commodity prices to these levels, its trend of firming currencies, which equates to lower oil prices, should further push demand to even greater levels that should offset any softening from the US.

Further yet, while commodity bears habitually make a comparison to the tech bubble, commodities are real assets compared to simply equity or financial based assets. To paraphrase investment maven Jim Rogers, gold or oil or commodities in general cannot go to zero, while shares in Enron can (and did)!

Of course, that is conditional on oil or gold or other commodities not being “grown on laboratories” similar to the miracle of the printing press where money can be issued limitlessly. Where something scarce and something abundant is compared for value, obviously the scarcer one gets the higher rating. As Voltaire. (1694-1778) once said, “Paper money will eventually return to its intrinsic value - nothing”.

So higher oil prices are not solely a function of demand and supply dynamics but also a manifestation of the US dollar’s declining purchasing power! Posted by Picasa

Oil’s Supply Side Constraints

``Nixon Administration officials were convinced that cutting the dollar's tie to gold and devaluing it against other currencies would increase our exports, slash imports and give us a fabulous round of prosperity. Instead, unhinging the dollar from gold gave us more than a decade of debilitating inflation, catastrophic increases in the price of oil and record-high interest rates.”-Steve Forbes

Well today’s rising oil prices is coming amidst further signs of deterioration in the US economy (growing signs of stagflation???)...


Figure 3: Economist: Spiraling Housing Inventories

Housing inventories in the US are scaling higher as shown by the Economist chart, see Figure 3. This denotes of a further downdraft in the housing industry. Cycles take time to unfold. This will not be an exemption, especially one that has been inflated by credit excesses.

According to the Austrian School of economics, recessions would begin at the “higher stages of production and not on the consumption stage”. And this had been the case in 2000, let me excerpt Mr. Gerard Jackson of Economic editor of BrookesNews, ``On 22 January 2004 the Joint Economic Committee’s Vice Chairman Jim Saxton pointed out that unemployment in manufacturing had been rising over a longer period. The unemployment situation was confirmed by the ISM’s manufacturing employment index which in 2000 had fallen below 50, showing that employment was contracting in manufacturing was still falling. The committee also reported that consumer spending continued to expand throughout 2001.”


Figure 4: Northern Trust: ISM Manufacturing Falls Below 50!

From Northern Trust’s Ms. Asha Bangalore ``Readings below 50.0 denote a contraction in factory activity. The PMI has held above 50.0 for 42 months. The details of the November ISM manufacturing report is important evidence for the FOMC about noteworthy slowing conditions in the factory sector. Historically, the PMI has a strong positive relationship with the year-to-year change in GDP when it is advanced by one quarter.”

With manufacturing showing signs of corrosion, would the Austrian’s viewpoint be re-affirmed again?

Of course, mainstream analysts usually base their comments from the framework of demand-supply dynamics, from which we do not dispute. However, our concern is today, can oil prices rise amidst an economic slowdown?


Figure 5 Chartoftheday: The Long term Oil cycle

The answer is yes, depending on the condition. So aside from the fraying state of the purchasing power of the US dollar, decreased demand can be cushioned by---an even faster rate of decreasing supplies!

I’d like to bring back an old chart from Chartofthday.com, which shows of the thirty year horizon and the previous declining oil cycle. As indicated in Figure 5, Oil has undergone a massive declining phase for about TWO decades, prior to the present upside cycle. The present cycle, of course, doesn’t indicate exemptions from obstacles as any trend does. The 2000 recession did bring oil prices down temporarily, but such decline was apparently utilized as a springboard for establishing new highs!

As mentioned above, politics have been undermining much of the progression of putting on stream the already strained oil supplies, evidently due to the color of money....and leverage for added political power.

A serious ramification to these developments have been the inability of Western major oil companies to replace their reserves, according to analyst Sean Brodrick, ``the Western oil majors — like ExxonMobil, Chevron, BP, and Shell — are failing to replace the reserves they pump. In 1997, they were able to replace 140% of their reserves; in 2005, they were able to replace only 75%! This indicates just how hard it’s becoming to find oil. Everyone’s trying to grab what they can, while they can. And as you know, limited supply will likely equal higher prices going forward.”

Yes, because of ongoing global trends of nationalization of the industry. For instance, in Bolivia and Venezuela contracts with private companies have been either cancelled or renegotiated for a higher share of revenue for the host government.

In addition, ``Last month, Russia threatened to revoke permanently the operating licenses of Western oil majors in the Sakhalin-1 and Sakhalin-2 project, while state-controlled Gazprom is excluding all foreign (notably Western) energy majors from its giant Shtokman gas project” adds Sean Brodrick of MoneyandMarkets.com.

According to analyst Martin Spring, ``Russia is extending its ownership of and control over natural resources and other industries regarded as strategic, as well as buying companies in other countries giving control over markets, such as pipelines and refineries. France has announced that cross-border mergers will not be allowed in 11 industries. The US has blocked foreign takeovers of ports and the oil/gas producer Unocal.”

There is also the unfolding phenomenon of utilizing domestic natural resources as political leverage for expanding political power. According to analyst Mr. Spring, ``Countries with large commodity reserves are increasingly using them to apply political leverage to achieve national aims. 85 per cent of the worlds oil reserves are effectively under state control.”

As Russia recently surpassed Saudi Arabia to become the world’s largest producer of oil and gas, according to Mr Brodrick, ``it’s ripping up contracts and forcing new deals on customers from Western Europe to the Asian steppes. The country uses its muscle to reward allies, like Armenia, by charging them much less for natural gas than critics like Georgia.”


Figure 6: US Global Investors: Rising Production Cost per Barrel

Moreover, there are also the cumulative effects of growing shortages in tools and equipments, rigs and importantly personnel like engineers and geologists to undertake such projects.

An added dimension would be the rising cost of production as shown in Figure 6!


Figure 7: WTRG Economics: World Rig Count

World rig utilization rates are at very high levels or at 93% according to DBS Vickers, see Figure 7.

According to WTRG Economics, ``International rig count, which excludes the US and Canada, was up 16 to 965 for the month of October, 2006 and is 114 rigs or 14.1 percent above last year's 846. The total number of rotary rigs worldwide in October was 3,130 down 4 from September and 264 higher than last year. US workover rig count for October, 2006 was down 8 to 1,562 and is 131 rigs above last year's level of 1,431.”

On the other hand, rig deployment level, while below the record numbers of the 1980s are at 15 year highs.

Yet, the technologically challenged oil rigs have been due to years of underinvestment, let me quote DBS Vickers, ``there has been massive underinvestment in rigs. Only 24 units were built since 1993 and only 40 units were built in the last 20 years. Thus, about 85% of the jackups rig fleet is older than 20 years. Currently, there are about 42 units under construction. However, including normal attrition, the jackup fleet could well remain flat over the next 2-3 years.”

Nonetheless, despite the massive deployment of rigs, only a handful of discoveries have been made, the largest of which have been at the Gulf of Mexico by Chevron, Devon Energy and Statoil ASA which found an estimated 3 to 15 billion barrels in several fields about 175 miles offshore and 30,000 feet below the gulf’s surface! Conventional oil gets harder to come by!

An additional constrain would be increased environmentalism which is doubling the lead time to operate these projects.

So as capital or required investments are diverted away due to increasing trends of political interference, aside from prospective supplies equally hampered by infrastructure shortages and production bottlenecks, the demand equation is unequally met by diminishing supplies!Posted by Picasa

Menace of Peak-Oil!

``Nobody likes the idea of Peak Oil. Firstly, you have the politicians. Naturally, a politician will never say that there is such a thing as Peak Oil. It is suicide to give bad news, so a politician will never do that…Secondly you have the media. The media do not like Peak Oil. Why? There is no sponsorship for Peak Oil. The oil companies do not like Peak Oil because you should not say that your soup is cold; you should always say that it is very hot and very tasty, yes? So nobody wants to hear of this phenomenon of Peak Oil.” -ALI SAMSAM BAKHTIARI is a retired “senior energy expert,” formerly employed by the National Iranian Oil Co. (NIOC) of Tehran, Iran.

Lastly, is the threat of the validity of the Peak-Oil!


Figure 8: WhiskeyandGunpowder.com: The Menace of Peak Oil

Recently we have noted of the output declines of major oilfields in Burgan Kuwait (“second largest oilfield”), and Cantarel Mexico (“second largest oil-complex”). These are major oilfields whose outputs contributed greatly to the present supplies. But whose rate of production has been dwindling with prospective intensifying declines in the near future as the well matures, as shown in Figure 8.

Yet, despite the massive search for reserve replacement (in terms of expanding present proven reserves-via new technology processes or new wells) as noted for above, recent oil “discoveries” have not been sufficient to replace rate of depletion (thought to be at least 5%). In other words, for every 4-5 barrels consumed only 1 barrel is replaced, said conservatively. And that is what the Peak oil theory is all about.

According to WhiskeyandGunpowder.com geologist Byron King, ``That is, you cannot extract what you have not discovered. Peak Oil is a shorthand way of saying that mankind’s ability to extract conventional oil from the Earth is “peaking” because mankind has found most of the world’s oil deposits. And it also appears that mankind has extracted about half of all of the conventional oil that will ever be extracted. This is the basic premise. Keep your eye on that ball.”

Even with the prospective unconventional oil candidates as “tar” or “shale” oil for possible substitutes (aside from solar, windpower, hydrogen, biofuels, coal gasification) for the “fossil fuel”, these would take massive Dollar investments, additional energy inputs (as natural gas), humongous amount of water and widespread infrastructure networks, aside from of course, overcoming over political obstacles. All these combined would take a rather lengthy period of gestation while the present rate of oil production decreases.

So even if the world economy does slowdown led by the US, if the validity of Peak Oil theory is accurate, then higher trending prices could be the norm.

At the end the day, the present world has been built under the assumption of a sempiternal or everlasting environment of cheap oil and easy money. It would probably take tremendous bouts of angst before cognizance, acceptance and enlightenment would prompt both private and public sectors of the world to act accordingly upon the required adjustments.

Give or take away Peak Oil Theory, the cycle is definitely not over. Posted by Picasa

Sunday, November 26, 2006

Asia’s Soaring Markets: A Matter of Decoupling from the US?

``Cycles in markets do exist, but it's impossible to pinpoint how long they will last with any precision. Much depends on the actions of government officials and the intelligence of the public. Each time is different. I recall commentators calling for a six-year gold cycle, or a 10-year real estate cycle. They are all ephemeral, because, as Shakespeare says, our actions are "not in the stars, but in ourselves."-Dr. Mark Skousen Investment U

Here is Friday’s introductory from the Economist magazine (emphasize mine),``Stockmarkets across the Asia-Pacific region have been hitting all-time highs recently, reflecting the underlying strength of economies across the region and the perception that Asian stocks represent the best prospect of growth at reasonable risk. Thanks in part to the de-linking of Asia's economies from the US, and a greater reliance on intra-regional trade (particularly with China), Asian markets seem well-placed to withstand the slowdown in the US that is expected next year. But a more dramatic braking of the US economy could yet see funds flowing out of the region as fast as they have flowed in.”

In my latest presentation I built my bullish case of the PHISIX and the Philippine asset class, over the LONG-TERM, premised upon the following: accelerating Globalization trends, the ongoing phenomenon of Wealth and Capital transfer, increasing dynamics of regional and global financial integration, evolving demographic trends, transitional fiscal and monetary policies under present conditions and cyclical factors.

It is true that part of the increasing Globalization trends has been the intensification of intra-regional trade, mostly due to the structural shift in the global trade framework which has been molded out of a mostly supply-chain platform paradigm.

Such evolution has equally led to a massive reconfiguration of the industrial construct among nations, which underscores the David Ricardo’s Theory Comparative Advantages and the international division of labor or the increasing trends of specialization, and importantly, the reformation of fund flows, which has likewise buttressed the progress of the world’s capital or financial markets.

Today, there has been increasing chatters of a de-linking or decoupling of Asia from the West, similar to the latest lengthy quip from the Standard and Poor’s who argues in their latest outlook ``The World Won’t Sniffle If the US Sneezes” (emphasis mine),

``Some of the strength can be attributed to a weaker U.S. dollar, attractive equity valuations, and healthy profit margins, helped by ample global liquidity and corporate restructurings induced by M&A activity. But there’s another key factor at work; namely, the rest of the world is beginning to look more like the United States.

``America’s robust gross domestic product (GDP) growth over the past few years has been fueled largely by consumers’ appetite for everything from iPods to hybrid autos to home refurbishments. But as American spenders are tightening their purse strings, falling unemployment in developed countries is causing German, French, and Japanese consumers to loosen theirs.

``More significantly, rising per capita income in emerging markets — which, according to the International Monetary Fund, account for 27% of global GDP — is dramatically increasing emerging middle-class demand for such things as autos, branded apparel, home appliances, packaged goods, and consumer electronics. This trend extends beyond products, however, and as employment rates and disposable income rise, consumers are demanding access to financial services and health care as well.”


Figure 1 S & P: Mitigated Impact by Decoupling?

Like typical coins, there is an obverse side, Stephen Roach, Chief Economist of Morgan Stanley argues against present day theme of decoupling is unlikely given the much entwined dimensions of trade, economy and finances, Mr. Roach wrote (emphasis mine),

``Given the dominant role that the US consumer has played in driving the demand side of the world economy and the equally important role played by the Chinese producer in shaping the supply side, decoupling won’t be easy. By our calculations, China and the US collectively have accounted for an average of 43% of PPP-based global GDP growth over the 2001-06 period -- well in excess of their combined 35% share of world output. Globalization makes decoupling from such a concentrated growth dynamic especially difficult, as ever-powerful cross-border linkages have become increasingly important in tethering the rest of the world to these dominant engines of growth.

Mr. Roach asserts that the evidential lack of sustaining domestic demand, the need for a diversified share of export mix (the USD $800 billion trade deficit suggests the world still depends on US as its key market whose consumption in 2005 totaled about $9 trillion or ``20% larger than consumer spending in Europe, 3 1/2 times that of Japan, nine times the size of China’s consumer, and fully 17 times the scale of Indian consumption” according to Mr. Roach), and the need for policy autonomy draws such an issue into serious question.

I actually stand in the middle ground of this debate.

Because we are aware that mainstream “experts” usually justify their explanation of events based on recent outcomes, we become wary over the penchant for oversimplification. In my case, the following chart is a res ipso loquitur (thing speaks for itself).


Figure 2: stockcharts.com:Dow Jones World and Dow Jones Industrial

In the past, I have repeatedly shown you of the accelerating correlation trend of global financial markets, such that for instance, the US Dow Jones Industrial Averages appears to have inspired for a rally in the global equity markets last July, as measured by the global benchmark, the Dow Jones World Stock Index, seen in figure 2.

The chart simply reveals that in over a year’s period, global markets have markedly shadowed or has been tightly associated with the performances of the US Dow Jones benchmark. In short, to argue that global markets have decoupled could be reckoned as hardly a fact. Yes, there is no question that global markets may have outperformed. Yet, outperformance does not itself translate to an autonomous motion.

Nonetheless, while there are indeed some signs that the world is undergoing some sort of transitional shift towards dissociation from developments from the US, the liquidity spring which has bolstered today’s financial and economic world still largely depends on the dictates from whence it originated.

Anyway, the embryonic “decoupling” signs could be gleaned from the present day developments in the world capital markets.

Yes, the US remains as the largest capital market of the world in general. However, a noteworthy development is the apparent signs of growing slippages.


Figure 3: The Economist: Europe overtakes US in Corporate Debt Arena

In terms of hedge-fund and mutual fund assets, securitization, syndicated loans and turnover in equities and exchange-traded derivatives, as well as high-yield “junk” bonds, the US still commands the prominent heft. However, according to the Economist magazine, ``Europe's corporate-debt market overtook America's last year”, as shown in Figure 3.

Nonetheless, London has been the leader in foreign exchange trading and over-the-counter or off-exchange derivatives.


Figure 4: The Economist: Hong Kong and London Leads the IPO market

``The loudest sucking sound has been in the market for initial public offerings, a crucial barometer of financial wellbeing. America's share (measured by proceeds) has collapsed since the late 1990s. Five years ago the New York Stock Exchange dwarfed London and Hong Kong. This year it is being beaten by both.” wrote the Economist.

So aside from Europe, we are today witnessing the emergence of the Asian financial markets as a potential moving force in the global financial markets stage.

Moreover, there has equally been mounting trends towards the private-equity investment or public firms taken private, worldwide. Trends of increasing corporate buybacks plus progressing private-equity developments, which has reduced supplies of equities available for public investment, have likewise been attributed to today’s buoyant equity markets. The “rationalization” being that of increasing “shortages of supply” relative to demand, which is essentially another euphemism for veiled inflation or too much money chasing for decreasing supply of listed equity firms.

Clearly, these trends could be discerned as indications that the US has been chafing at its competitive edge, in almost every segment of the industry, including that where it once mightily towered upon, the FINANCIAL DOMAIN.

Several factors had been cited to this erosion of leadership, such as growing competition, CHOKING regulatory policies (Sarbanes-Oxley), FRAGMENTED regulatory regime (multiple jurisdictions/entities), HIGHER COST of compliance, prominence of class-action suits, slow adaptation to technological innovation (electronic trading platform) and tougher immigration laws.

However, I believe that this is more than just micro-based policies or developments but as an offshoot to the prevailing collective macro trends of globalization, financial integration, global demography and the wealth transfer phenomenon.

As these trends gets to be even more pronounced, more capital will flow back into the Asian region, where in the backdrop of a “deepening” or growing sophistication of its financial markets, its excess/surplus foreign reserves, growing competitiveness of its manufacturing base, the leapfrogging of its technological research and development share, the development of more skill-based labor force and rising middle class will underpin any much touted decoupling.

Until the financing of the massive US current account deficit ends, such cross-linkages of Asia with that of the US will likely continue and be the dominant theme for sometime to come.

This essentially makes ex-US global financial markets STILL vulnerable to the sentimental turns brought about by adversarial developments in the US economy and financial markets, but much to a lesser degree compared to the 1990s.

Let me borrow the Economist’s poignant conclusion (emphasis mine), ``However, there seems little risk of a 1997-style meltdown, even if equity markets do look a little overpriced at the moment. Most major Asian economies are characterised by current-account surpluses, large foreign-exchange reserves and high rates of domestic savings. These improved economic fundamentals will serve the region well over the next few years as the global economy slows and investors become more risk-averse. Nevertheless, the dip in Asian capital markets and a slide in Asian currencies against the US dollar in May and June served as a reminder that the region is not immune to a change in global investor sentiment. In an environment of heightened investor uncertainty, some Asian markets could suffer further sharp corrections.” Posted by Picasa

US Dollar Breaksdown! Gold Should Prosper

``There is no subtler, no surer means of overturning the existing basis of society than to debauch the currency. The process engages all the hidden forces of economic law on the side of destruction, and does it in a manner which not one man in a million is able to diagnose."--John Maynard Keynes, The Economic Consequences of the Peace (1919)

Based on the circumstances presented by the developments in the financial markets, it would be safe to assume that the US is still a major driver of the world financial markets and economies, despite persistent chatters about “decoupling”. Ergo, we should be vigilant about the ongoing development abroad that may influence our local market.


Figure 5: St. Louis Fed: Spike in the US money supply!

Recently I pointed out that despite steps by world central banks to normalize its monetary policies, buoyant equity markets, the surge in base metals and a bullrun in the bond markets signified a backstop of an easy money environment, where credit has emanated from non-traditional sources such as structured finance products and derivatives, rather than tightness.

However, in figure 5, the St. Louis Fed chart recently shows a spike in Money supply as measured by MZM or Money Zero Maturity or a measure of liquid money supply where MZM represents all money in M2 less the time deposits, plus all the money market funds and M2 or M1 (physical money and demand deposits or checking accounts) in addition to all-time related deposits, savings deposits and non-institutional money-market funds.

This shows that the US has suddenly opened its liquidity spigot amidst an economic slowdown prompted by the rapid deceleration of its real estate industry.

In the past, significant surges in liquidity could be seen for sometime prior to periods of recession (gray areas-1990 and 2001).

While today’s surge hasn’t been as strong, I suspect that the Fed could be attempting to “soft land” economy by unleashing liquidity. Could it be that the recent economic developments or the ongoing recession in the real estate sector have expanded far beyond the FED’s expectation?


Figure 6: Stockcharts.com US Dollar Breaksdown while Gold test resistance!

As possible corollary to the precipitate surge in liquidity we note that the US Dollar plunged below its recent support level and is treading at its May levels. For the week, the trade weighted index fell by 1.93%, see Figure 6. The US dollar’s decline has almost been across all currencies.

So even while the COMEX market was closed following the US Thanksgiving Holiday, gold surged in Europe to test its critical resistance at USD $640 amidst the US dollar selloff!

It looks likely that considering the present move by the Fed to considerably ease, the US dollar index could drift towards its December 2004 low at 80.42 in the coming months.


Figure 7: stockcharts.com: Phisix’s inverse correlation with the USD

In the past, the Phisix has benefited greatly from a falling US “trade weighted” Dollar as the shown in Figure 7. The rise of the US Dollar (upper pane) in 2005 has led to a consolidation of the Phisix (box), which had been compounded by local political noise. Nonetheless, as the US Dollar resumed its decline, the Phisix continued with its upside ascent.

While history is no guarantee of an exact repetition, the US dollar’s losing momentum should continue to provide support for the Phisix over the long run. Although, present developments may not be clear as today, where global equity markets appears to have priced in such on expectations as vividly manifested by the bond markets. You can see from the chart that the US dollar had been consolidating even as global equities soared! This could even result to a “sell on news”.

The asymmetric messages emitted by the different markets gives us little clue as to the near future expectations. The global stockmarkets appears to have priced in a “goldilocks or soft landing” scenario, which aside from being overbought, could have overestimated its buoyant outlook, whereas the bondmarkets appear to have consistently factored in a weaker economic landscape.

The surge in money supply could translate to a confirmation of the prospects of a weaker than expected US economic environment and may cause global equities to either pause or retrace, or shift money flows into other asset class as to fuel further the rallying bond markets or into gold.

But again, in my view, liquidity is the main driver. The fall of the US dollar translates to an easy money environment, where, should there be any corrections in the global equity markets, the impact would be of less significance, while on the other hand gold should prosper! Posted by Picasa

Sunday, November 19, 2006

An Avalanche of Positive Publicity for Philippine Assets Elicits Different Perspectives

``There are four ways in which you can spend money. You can spend your own money on yourself. When you do that, why then you really watch out what you’re doing, and you try to get the most for your money. Then you can spend your own money on somebody else. For example, I buy a birthday present for someone. Well, then I’m not so careful about the content of the present, but I’m very careful about the cost. Then, I can spend somebody else’s money on myself. And if I spend somebody else’s money on myself, then I’m sure going to have a good lunch! Finally, I can spend somebody else’s money on somebody else. And if I spend somebody else’s money on somebody else, I’m not concerned about how much it is, and I’m not concerned about what I get. And that’s government. And that’s close to 40% of our national income.” In memory of Milton Friedman July 31, 1912 to November 16, 2006

Suddenly there have been an avalanche of bullishness on the Philippines, an amazing turnabout from the past few years, here are some examples....

Eoin Tracey of Fullermoney.com quotes, UBS Investment Research, in their latest report, “Is the Philippines All Priced In”? (emphasis mine)...

``It's important to point out that domestic participation in the equity rally has been relatively minor to date; most of the action has come from foreign investors. From a stock market point of view, there are three potential catalysts next year: First, we expect a mild increase in real growth - and this is a significant achievement given the expected slowdown in the global economy, which should bring down growth numbers in other parts of Asia. Second, very benign inflation conditions, and finally, a cut in official short-term policy rates.

``Now, having real GDP growth accelerate from 5.2% to 5.8% is not really a barnstorming expansion by historical standards, but it does stand out in a regional context. More important, however, it's a potent signal to investors that the economy can hold water - and that domestic demand can take over the real cycle. Over the past two decades the Philippines suffered a decline in the investment to GDP ratio, from over 25% in the mid-1990s to 20% in 2000 to around 15% today. So the physical capital base has been eroded, and the government recognizes this and has been trying to open doors to investment in the infrastructure, mining and resources areas. Our view is that this is not going to reverse quickly; it's a slow process, there's a lot of bureaucratic grit in the wheels, and now there's an election coming next year.

``However, we have had a fundamental recognition of the problem, and have seen some underlying reforms last year in the resources part of the economy. Significantly, FDI has increased 60% to USD1.2bn this year to date - which is not very much in the Chinese context, perhaps, but a very big increase for the Philippines. We already noted that the government is likely to step up spending and investment a bit next year as well, and on top of that you have the new economic zones that give tax breaks to new services areas such as call centers, relocation of back office by major financial institutions, and these sectors are absolutely mushrooming. All in all, we are looking at a recovery in investment spending to around 9% y/y growth in 2007, and this is a major factor behind our favorable GDP call.

UBS likewise cited the Philippines’ outperformance (+38.2% year-to-date, local currency, based on Friday’s close) possibly due to “headline export/GDP ratio below 50%” or what they categorized as “big” countries [China (Shanghai +69.83% y-t-d, Shenzhen +62.62%), India (+42.89), Indonesia (+43.82%), Korea (+23.8%), Philippines) in the region that have been less reliant on exports.

Quoting anew UBS, ``this is likely a reflection of a rising large country "premium", as investors learn to differentiate between markets in the face of an expected US slowdown. But it's also true that large economies have grown somewhat faster than their smaller neighbors over the past five years - and more important still, large countries have a much higher domestic contribution to overall growth, more than twice the pace of the smaller group.”

In short, UBS thinks that the traits of economic independence and domestic demand strength have rewarded these markets compared to the “small” export dependent ones [Hong Kong (+28.95%), Malaysia (15.67%), Singapore (19.84%), Taiwan (10.86%) and Thailand (+2.08%)].


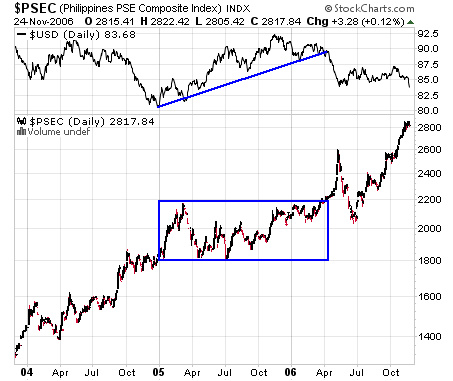
Figure 1: Bloomberg: Phisix treading on 9 year highs

This observation seems sensible considering how markets performed of late, see Figure 1, albeit, written obviously under the context of the recent past performance, or predicated upon the optimism etched from the current gains or the “rear-view mirror syndrome”.

Yet, it has been a long-time conviction of your analyst that as the region integrates economically and financially, to eventually decouple from its dependence on the US, such is where the meat of the advance of our economic and financial advance will be most pronounced.

This terse commentary from Gavekal Research, ``An upcoming large capital spending boom in the “third-tier” Asian countries (Thailand, Indonesia, Philippines, Vietnam…) fuelled by lower interest rates, higher currencies, cheaper machinery (often from China) and a clearer political situation.” Nothing new here, we’ve dealt with this since 2004, see November 29 to December 3, 2004 (Domestic Investment to Help Drive the Phisix?)

The Philippine investing theme has likewise hit mainstream media, Carl Delfeld, board representative of ADB and chief honcho of global investment advisory Chartwell Partners, writes about the Philippines and Indonesia in his “Two Surprising Markets” article in Forbes Magazine, excerpting Mr. Delfeld (emphasize mine)....

``Many would categorize Indonesia and the Philippines as relatively poor countries, but I beg to differ. Both countries have many assets and great promise. Indonesia is rich in natural resources, strategically positioned to benefit from Asian trade and economic growth, and it has a very young population, the fourth largest in the world. The Philippines' strength is its English-speaking population, giving it the potential to develop into a dynamic regional services hub....

``These markets can be volatile, so have in place some risk-management tools, such as a 10% trailing stop-loss order to lock in gains. Both Indonesia and the Philippines still have an upside, but the best time to score large gains is when investors are not showing the slightest interest in these markets.”

Sound advice from Mr. Delfeld. Nevertheless, he includes a buy recommendation on Manila Water Corporation [MWC].

Analyst Jim Jubak writing for thestreet.com, notes of the changing export patterns of the world plus growing domestic consumption ex-US, as primordial reasons for global portfolio diversification, and surprisingly in his 10 recommended blue chips stocks, he includes San Miguel Corporation [SMC]! The Philippine asset class appears to be hugging the today’s limelight!


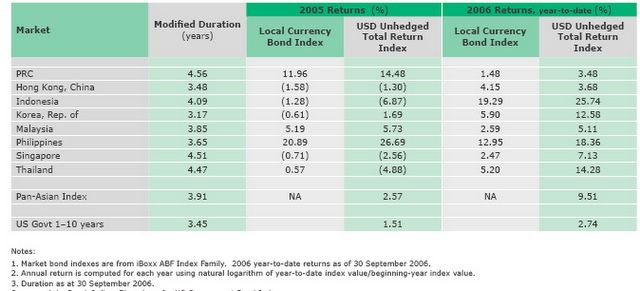
Table1: ADB Bond Monitor: iBoxx ABF Family Returns Index

In addition, Table 1 from ADB shows that the Philippines have likewise outperformed the region’s bond markets in both the local currency and the US Denominated instruments category since 2005, with double digit returns. So it is not a surprise for investor sentiment to shift and be more vocal on their confidence on the Philippine assets as present gains have buttressed such outlook.

I recall a local analyst argue lately that domestic “fiscal reforms” have been the mainly responsible to the present wellbeing of the Philippine asset class and cited neighbors as Indonesia as an example.

While I do not dispute the fact, that reforms have been made enough to makeover our asset class or even Indonesia’s as more palatable for investors, I would dissent on this frame of argument such that with reference to the Phisix, please refer back to figure 1, our equity market have risen since mid-2003, even when reforms were yet on the drawing boards. In other words, reforms have not been the key drivers to our markets, in my view, excess liquidity has.


Figure 2: Bloomberg: Indonesia’s JKSE have risen in tandem with the Phisix

And the same goes with Indonesia, as shown in Figure 2. Even prior to any change of administration or purported reforms, Indonesia's JKSE has been an equal recipient of global diversification emanating from the chase for yields phenomenon and has risen almost in tandem with our Phisix over a similar timeframe.

Yes today’s market makes everyone inexorably a genius. Every “rationalization” or justification, especially one that’s been in congruence with the current affairs, no matter how specious, meets a round of applause especially by mainstream media.

However, I would accentuate that the present euphoric mode of global markets are a result from a significantly lesser degree to domestic developments, but on a larger premise from that of massive credit and money creation and intermediation on an international scale.

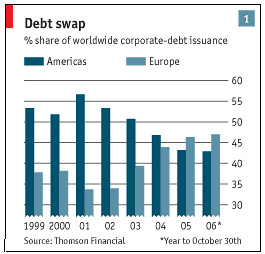
You have to look no further than the recent explosion of derivatives. Let me cite the recent press release from Bank for International Settlements (emphasis mine), ``The volumes outstanding of over-the-counter derivatives expanded at a brisk pace in the first half of 2006. Notional amounts of all types of OTC contracts stood at $370 trillion at the end of June, 24% higher than six months before. Growth was particularly strong in the credit segment, where the notional amounts of outstanding credit default swaps (CDS) increased by 46%. Rapid growth was also recorded in other market segments. Open positions in interest rate derivatives rose by 24%, while those in FX contracts expanded by 22%. Equity and commodity contracts grew at 17% and 18%, respectively. Gross market values, which measure the cost of replacing all existing contracts and thus represent a better measure of market risk at a given point in time than notional amounts, increased by 3% to $10 trillion at the end of June 2006.”

$370 trillion! That’s about 7.22 times the global GDP and about 2.14 times the estimated aggregate world financial stock components, i.e. sovereign and private debt, equity securities and bank deposits! And to consider, derivatives are supposedly instruments which derive their underlying value from a security, group of securities or an index, which to extrapolate, means that derivative contracts are disproportionately larger than the underlying values of the securities they represent. This simply implies that the world’s financial system keeps getting increasingly levered to the hilt. Until when the global financial system can accommodate these dynamics is one thing to behold, otherwise it poses no other than intensifying systemic risk!

The world central banks has tightened interest rates alright, but this has not been manifested in the rather buoyant financial markets as we have repeatedly asserted, according to Wall Street Journal’s Cynthia Koons and Michael Aneiro (emphasis mine), ``Global issuance of risky ‘high yield,’ or junk bonds -- which Wednesday surpassed the previous record for a single year -- surged further into uncharted territory following yesterday’s blockbuster sale of $5.7 billion in new debt by hospital operator HCA Inc.…Global high-yield issuance surged past the $210.8 billion mark set in 2004 to a record, according to Dealogic. By yesterday…total global junk issuance stood at $217.4 billion, with a month and a half to go until year end. October set a single-month record with $30.5 billion in new issuance… And a report issued this week by J.P. Morgan forecasts that this month could see as much as $25 billion in new issuance, which would be a record for November… Despite the surge in issuance, junk-bond yields have dropped to a 5½-month low of 8.15%...” To which we ask what tightening? And where?

This bring us to the logical explanation by Mr. Raghuram G. Rajan, Economic Counselor and Director of Research of IMF, ``The mismatch between unabated global desired savings and lower realized investment, between the amounts available for finance and the flow of hard assets to absorb it, has led to a liquidity glut which has pushed long term real interest rates the world over lower. This has spilt over into markets for existing real and financial assets — real estate, high-risk credit, private equity, art, commodities, etc — pushing prices higher. Indeed, casual empiricism suggests that the most illiquid markets, where typically there are few transactions, and small infusions of liquidity can have substantial effect, have been pushed the highest.”

Which brings us back to the year-to-date performances of Asia as cited above; the most illiquid markets has apparently performed the best, namely the stellar gains of the Philippines, Indonesia, India and China or the UBS’ rubric of “Big” countries, which appears to also reinforce Mr. Rajan’s viewpoint.

Now given the three varying perspectives, to wit, the local analyst’s “domestic reforms”, UBS’ “economic independence/domestic demand theme” or IMF’s Rajan “liquidity glut”, which fits today’s dynamics better? Go figure. Posted by Picasa

Bullish Retail Investors Suggests of Signs of A Nearing Top?

``We just need to understand that no matter how much conviction we have, events may prove us wrong...After all, not long ago, the world believed all swans were white; then the world discovered Australia—and a black swan”- Jack Crooks, currency analyst

An online stockmarket forum http://www.tradercentral.ph/ held an assembly last Saturday at the PSE, where I was invited as one of the guest speakers on the topic of global market analysis, (Yes, It was my first speaking engagement and hopefully the last).

The amazing thing about the event was that the expected attendees had been somewhere about 100, when over 200 participants came. In other words, there was a flood of prospective, if not relatively “new” retail investors.

While the event was indeed a resounding success for the organizers, it sort of revealed of today’s market psychology where local retail investors have become also “bullish” with today’s market, who seem to be willing to “take the plunge”. (Of course, I’d like congratulate and thank the organizers, as well as Mr. Rapi Juvida, Jeff Siy, and Wilson Chong for the assisting me on my most challenging experience.)

When local retail investors become bullish, I become anxious. It is simply because the social dimensions of the market’s activities or the recent continuing gains have made the average investing public believe that returns from the financial markets have been easy to secure, notwithstanding, their apparent limited awareness of the risks prospects.

Noticeably too, their attention span have been intensely focused on the “short-term” trading aspects, particularly on the momentum side. This reminded me of children awed by magicians performing the sleight-of-hand tricks on stage.

Put bluntly, they are wont to see the plus side of the market, but gloss over the risks outlook. Besides, in the order of investors, retail investors are typically the last to enter.

Yes, arguably the low penetration level of local investors could translate to more upside for the market over the long run, as fundamentals such as the rising Peso coupled with higher yields may impel more local funds flow to the market. Let me repeat, over the long-term.

But, considering today’s palpable complacency, not only in the domestic arena, but as well as in the global arena, in the view of a prospective global economic growth slowdown led by the US, there could be meaningful bumps along the road. Yet, no one wants to hear of this.

Moreover, while it was my case to present the positive cyclicality of the Philippine stockmarket, I made a reminder that NO TREND goes in a straight line. And when countertrends do arise, they maybe as severe a headwind as to shakeout many investors and contemporaries, and likewise could prompt for a rethinking about the cycle.

The big guys have been sounding the alarm bells, PIMCO’s Paul McCulley (emphasis mine) in his latest outlook wrote, ``While the potential growth rate of GDP may have decreased over PIMCO’s secular horizon, the potential for a reflexive correction in GDP growth to outright recession has increased over PIMCO’s cyclical horizon. We sense volatility is creeping back into the business cycle, and the Federal Reserve’s “transparency” will be put to the test in the not-so-distant future.”

Or even the normally bullish BCA Research, thinks that a correction is due soon, see Figure 3.


Figure 3: BCA Research: Global Equities Are Due For Breather

According BCA Research (emphasis mine), ``The odds of a global equity market consolidation or correction are rising. Global equities have gained 16% since mid-June, and are now well above their May high. Stocks have benefited from a stream of positive economic surprises, including the sharp fall in oil prices and bond yields, among other things. It will be increasingly difficult to sustain this positive news flow in the short term. Moreover, this latest surge in stock prices is already comparable to the past three rally phases during the bull run that began in 2003, indicating that stocks are more vulnerable to any “bad” news. Bottom line: although market fundamentals on a 6-12 month horizon are still favorable, stocks look stretched from a short-term perspective.”

Two things of note: one, BCA comments of a world bull run that began in 2003, which prompts me to revert on the dimensions of what could have prompted a synchronous global bull run? Is it mainly Macroeconomics, Monetary Fund Flows or Domestic Reforms?

Secondly, I made my case on the Phisix stating that the “GIST of the gains of the Phisix has already been made” in my October 23 to 27th edition, (see Should You Invest in the Phisix Today?), or in a different light, the Phisix could be near its cyclical top, eerily, almost in the same context of the above BCA’s analysis on the possibilities of a forthcoming correction.

In the said article, I mentioned that the Phisix could attempt to breach the 3,000 level by the yearend but in a larger probability could stay within its close ambit.

Yet, any further attempt to distance from the 3,000 mark by a significant margin, makes 2007 a likely candidate for an annual negative return following four years of consecutive gains. Remember, markets are basically mean reverting. 2007 or 2008 could be one of the odd-man out years in the ongoing advance cycle.

The prospects of a worldwide growth slowdown could be candidate for the trigger. And so as with the prospects of World Central banks to “continue raising interest rates” amidst a persistently high inflationary (consumer price inflation) environment, according to the latest G-20 outlook, or to even a combination of both (stagflation??)! There is also the risk outlook of rising protectionism.


Figure 4: Kitco.com: Collapsing Base metals signs of Shriveling Demand?

Last week, the base metal group led by DR. Copper, fell by a significant measure as shown in Figure 4. Over the past months, despite persistent calls for economic growth slowdown, base metals appear to have continually defied gravity to storm to new heights until last week.

Strangely too, the recent June rebound of base metals appears to have almost coincided with the rally in global equity markets. Does today’s correction imply or reflect on a genuine mark down in global demand? Does this represent merely a pause or a major inflection point? Will the decline in the base metals likewise lead to a cross-market liquidity squeeze? Or will it presage a corresponding decline in global equities?

As I’ve said in the past, the global financial markets have been sending asymmetric messages; the rallying bonds markets factors in a significant slowdown, while rising stockmarkets suggests of vibrant earnings and salutary economic outlook. With oil and metals down, the message appears tilted towards contracting demand.

In finale, let me repeat my October 23 outlook, ``Another not so bright scenario working against today’s high octane markets is that based on the charts, the Phisix has been quite overextended in terms of being overbought and is due bound for either a short-term pause or a natural corrective phase within its present momentum. I say present momentum with reference to the continuity of its interim uptrend, in contrast to a “major” corrective mode.

``Yet it is important to note that in bullmarkets, overbought conditions could go into the extremes, and vice versa for bearmarkets, which makes trading anticipation rather complex, if not abstruse.

``As mentioned above, patterns in markets are not something definite as to repeat exactly, but as Mark Twain puts it, it may “rhyme”. Prudent investing means measuring your potential gains against your potential losses and naturally, take on the appropriate action.” Posted by Picasa