Sunday, September 03, 2006

Market Dissonance: Bull or Bear Amidst A Slowdown?

``The market doesn’t reward fools for long.” — Timothy Vick, author of How to Pick Stocks Like Warren Buffett

We should not forget that from the second quarter of the year the Phisix, and Global markets have trailed the movements of key US equity benchmarks or that global markets have been strongly correlated to the activities of the US equity markets. The strong performances of the world indices appears to be factoring in a US “soft landing” scenario, although in my view, this has been supported by liquidity arising from unofficial channels.


Figure 4: stockcharts.com: What slowdown? Volatility Index shows complacency

As shown in Figure 4, the volatility Index as measured by the VIX has been treading lower following the May scare and equally supported by declining volatility in the technical indicator the Bollinger Bands. This implies that market participants seems to be discounting a disorderly unwinding of the US slowdown...signs of bizarre complacency. Could the bulls be right to treat such slowdown as simply a “wall of worry” to climb? We will see.

Which brings us to the seasonality factor as shown in Figure 5.


Figure 5: Chartoftheday.com: Worst month of the Year

September based on the return averages has been the worst month of the year for US equities since 1950 and 1980, according to chartoftheday.com. And if seasonality reasserts its relevance we could see some heightened volatility heading into the last quarter. But the good news is that in the face of the weakest month is an offsetting factor, the strongest quarter...the year end rally, which filters over to the start of the year. So in a tactical perspective, assuming the carryover effects of seasonality, the September dips should be used as an opportunity to accumulate.


Figure 6: stockcharts.com: End of Commodity Bullmarket?

But again, we take market signals on a macro scale in search of possible clues for directional paths. While US equities appear to be scoffing at the outlook of a turbulent unraveling of its high impact real estate industry, the furious rally in the bond markets appears to be indicative of more worries. Moreover, the breakdown by the commodity benchmark CRB index, as shown in Figure 6, led by the oil and energy sector has been giving the deflationist camp reasons to celebrate...


Figure 7: stockcharts.com: HUI-Gold bullish technicals

I am not easily swayed by the deflation story though, especially considering that governments by nature, especially those with the democratic leanings, will exhaustively work to appease over the short-term the demands of its voters. Besides, it is rare to see such governments work on the unpopular and painstaking reforms for the long term good.

In addition, US consumers may find alternative avenues to fund their profligate spending habits, to quote Morgan Stanley’s Andy Xie, ``As the US housing bubble bursts, US consumption could come down also. This is not assured. The US has developed an entrenched culture of ‘borrow and spend’. It allowed the US consumption to survive the tech burst, 9-11 and the energy shock. The ‘borrow and spend’ culture could allow US consumption to survive again.” Under such circumstances we presume that the credit bubble dynamics will continue to expand.

Having said so, the key mining index HUI or the Amex Gold bug has withstood the recent selling pressures in the monetary metal, which may have been due to possible stealth sales by European Central Banks under the European Gold agreement which is slated to end its calendar year this month, as shown in Figure 7. This serves a non-confirmation in the decline of gold or a divergence.

Since gold finds the gist of its gains during the last semester of the year based on consumer demands on jewelry due to traditional festivals in India, China and the Christmas season in the US, such fundamental support has backed gold’s strong end-of-the-year seasonality. Further as gold has rebounded from its lows, as shown in the lower window of the above chart, the Amex Gold bugs appears to be testing for an upside bullish breakout from its bullish ascending triangle formation. Once the breakout is confirmed the likelihood, that gold, silver and other metal related stocks would follow suit. Posted by Picasa

Peso and the Phisix: This Time Is Different?

The Philippine Peso raced to a 4-year high following a successful breach of the psychological threshold level at 51. The local currency closed 1.26% stronger at 50.735 per US dollar on Friday and was Asia’s best performing currency. Year-to-date, the Peso has firmed by about 4.4%.

Naturally, the strength of the Peso has been likewise reflected in the activities of the local financial markets. As previously shown Philippine sovereign bonds had been imbued with significant portfolio flows as to see its nominal yields decline. Similarly, the local equity market as measured by the Philippine composite index or the Phisix has been on an upswing following last May’s global “risk aversion” scare.

As I have noted in numerous occasions, at the margins it is capital flows to the local financial markets that has lifted the local currency more than the remittances, economic growth and other reasons cited by mainstream experts. And importantly, such flows have been dictated by the developments in the global financial arena. For instance, since the world financial markets has anticipated the US Federal Reserve to hold in abeyance its program of raising interest rates, the US dollar has resumed its secular decline against most Asian currencies and against currencies of its major trading partners.

Let me remind you that in today’s dynamics, the financial realm drive the real economy and not the other way around. You just have to take into account the ocean or seemingly boundless stream of liquidity emanating from monetary and non-monetary sources to support the exchange of widgets and services. In short, I am strictly referring to inflation. While global central banks appear to be in a tightening mode they have been doing it perfunctorily. The humongous build up of aggregate liabilities will require MORE dosages of liquidity injection to support the present framework, otherwise risk a financial system meltdown. Would the world’s political leadership allow this?

Further, you want to talk about a major source of income inequality? Look no further than the inflationary tendencies of the world’s collective monetary authorities. Inflation benefits those who FIRST access the newly issued money who can buy at yesterday’s prices while the late recipients (the public) buys at today’s higher prices. Guess who are the primary beneficiaries of “money created from thin air”? The Government, particularly the Politicians and their executives, and the bankers. For the former, it is of no wonder why they fight with tooth and nail to assume the jurisdiction of, and staunchly justify the Spending Other People’s Money (SOPM). Yet, based on historical accounts not just domestically but worldwide, in a very significant degree, SOPM programs have led to massive distortions and imbalances and has greatly reduced standards of living.


Figure 1: The Phisix (Red) Gets Flanking Support From Strengthening Peso (black)

Back to the world of asset driven growth dynamics, as shown in Figure 1, the incipience of the inverse correlation between the Phisix and the Peso could be seen in the second semester of 2005. As the Peso firmed, local investors had been prompted back to the market on the prospects of higher returns. This again is on the account of lower yields from dollar assets, aside from of course, the declining price value relative to the Peso. Some have commented that chasing yields does not necessarily translate to bullishness. In the financial markets, one earns by buying shares from and selling shares to another. Put differently, everybody is at the mercy of someone else’s expectations and buying power. If one EXPECTS to make money from the market how can one be not bullish? Markets are, after all, a mind game.

Last week’s market internals reveal of a dramatic upsurge in local investor participation as gauged by the number of issues traded. Number of issues traded for me, represents as a quasi-sentiment indicator. The more the issues traded, the bullish the outlook of local investors. As you can see in figure 2, number of issues traded has been on an uptrend since 2003. And this has apparently supported the climb of the Phisix as shown in Chart 1.


Figure 2 Surging Number of issues traded

For the week, number of issues traded hit a level almost similar to May, when the Phisix hit its apogee high of over 2,500. This had been equally supported by a remarkable spike, on the differentials of the advance-decline indicator, which hit a level similar to January’s 2005 peak! In fact, several companies suffering from a dearth of liquidity have shown electrifying performances.

While these frenzied speculative activities on the broad market coincided with major “inflection points” in the past, as in 1st quarter 2005 and May 2006 peaks, I’d like to emphasize that there has been some crucial differences: previous reversals had been externally driven, and the strong peso as sublime impetus for local investors into the market started only during the second semester of 2005. This means that while speculative activities may represent some signs of overconfidence and broadbased recklessness, the paucity of data under similar conditions to suggest of potential patterns makes me uncertain if this development would actually represent another prospective “inflection” point considering the “chase for returns” theme. In other words, different conditions could most likely translate to different outcomes.

In addition, we have not seen the longstanding effects of the rebounding Peso on the Phisix, as the equity benchmark has operated mainly on a tormented legacy of a Peso devaluation since I laid my blessed eyes on this world. In short, while I abhor quoting on this Wall Street phrase, I am compelled to...``This time it is different”. This suggests that if the long-term trend of the peso is to strengthen (which I think it would...out of regional considerations and barring domestic political shocks) then the domestic equity market would essentially be operating under new conditions. So while some patterns may have some subtle pertinence, as a whole the Phisix would be thriving under an undefined landscape. And if initial circumstances where to be utilized as a barometer, the prospective trends look auspicious and supportive of the underpinning market cycles for the Philippine financial markets...again barring any shocks.

Lastly, present market circumstances tell us that global capital flows are the indispensable drivers of the world financial markets. For instance, mainstream media has been emphatic on the prospective US economic growth slowdown; however, the global equity markets appear to twit this on outlook, as shown in Figure 3.


Figure 3 from stockcharts.com: What Slowdown? Dow Jones World Index (left), Dow Jones Industrial Averages (right) Posted by Picasa

Sunday, August 27, 2006

Balancing the Perspective: Using Market Cycles and Market Action

``One of the mysteries of human society is how we interact with each other. We’re an empathic species. When you have emotions, I see it in your face and I feel the same emotions. That means we kind of move as herds. And so when other people are getting excited and they are talking about the market, it gets me excited too. You can't stay above it. If you are human, you get drawn in. But then when the emotions start changing, you get drawn into that too. And the emotion does seem to be changing. It looks like we're at the beginning of a change in psychology”- Robert Shiller on the Housing Market, Yale Professor, Author Irrational Exuberance

Now the realization of a slowdown in the US real industry is one of the headwinds I have written and warned about repeatedly. Today, such trend appears to be snowballing and could have unmeasured ripple effects throughout the world economy and the financial markets. As demonstrated in Figure 1 from Merrill Lynch’s David Rosenberg, the chart of the NAHB Housing Index vs. S&P 500 lagged by 12 months, which incidentally has a correlation factor of an incredibly strong 79%!!!


Figure1: Merrill Lynch David Rosenberg: NAHB Housing Index vs. S&P 500

Analyst John Maudlin, citing Rosenberg’s studies noted that (emphasis mine) ``seven of the last ten housing downturns foreshadowed an outright economic recession. The lead time was long - about 20 months. The three housing downturns that did not precede a recession presaged a discernible slowing in overall economic growth within a year of the peak in starts, on average.”

Since the US housing industry has allegedly peaked in August of 2005, which makes it about a year ago, 20 months suggests of an impending US recession by the 2nd quarter of 2007. And US equity markets, given the strong correlation shown above, could trace the activities of the housing markets as Mr. Rosenberg suggests.

Since the world’s financial markets have been manifesting increasing degree of interconnectedness, the probability is that any significant downshifts in the US equity markets would reverberate to the world markets, including that of the Philippine Composite Index. Over the past quarter as shown previously, the Phisix has closely tracked the movements of the benchmark US S & P 500.

Now before anybody gets petrified by the prospects of a worldwide markdown of prices led by the US and go into a panic stricken selling spasm, there are two important factors one has to take in account, in my view, in reckoning of the future activities in the domestic market.

I say domestic because even as markets today have been strongly correlated, I think there will an eventual decoupling in the future from the trends of the US market, if one were to take into account the present cyclical phase of the domestic market cycle if not the region’s cycle led by Japan’s Nikkei.


Figure 2 Barry Ritholtz: 100-year chart cycle of the Dow Jones

Analyst Barry Ritholtz in his blog points out that since 2000, see Figure 2, the present secular phase of the US equity markets, as measured by the Dow Jones Industrial Averages, despite the recent uptick (in 2003) has been DOWN or has been in a BEAR market phase.

Besides, it takes a lengthy period of time of about 17-20 years for these secular phases to shift from peaks of overvaluation to the chasms of undervaluation. This suggest that any shift towards a new secular bullmarket in the US will probably begin somewhere near the latter half of the next decade. For the time being, as the chart suggest, US equity markets could likely either consolidate (rangebound) or decline.


Figure 3 Yahoo!: Japan’s Nikkei 225

In the same context, we see in Figure 3 Japan’s Nikkei 225 in a declining secular phase for about 13 years, from peak-to-trough, as shown by the red arrow. Today, the Nikkei 225 has rallied from its 2003 low of about 7,600 and appears to be treading in a secular advance phase.

What this implies is that the Nikkei which is coming off from the pit hole in 2003 is unlikely to head lower or decline in excess of its previous depths but could possibly trade sideways (which translates into a pause in the advance phase) or decline marginally but not to exceed its 2003 bottom level (or present market cycle could suggest of an extended bottoming out) as the US markets tails off. These historical divergent paths as manifested by the valuations of Japan’s key equity benchmark could be indicative of an eventual disconnect.


Figure 4: What you see depends on where you stand! The Phisix Cycle

In a same plane, the Philippine Composite Index manifests of similar transitional phases as shown in Figure 4. It took the Phisix about 10 years from trough-to-Peak to cap its advance cycle from where the Phisix skyrocketed from about 150 to 3,300 to gain by (take note)...21 times! Think about it; if a boom given the same magnitude as in the past would be replayed into the future, this should translate to a Phisix at 22,000! Impossible you say? Look closely at India’s BSE 50 in Figure 5.


Figure 5 Yahoo! India’s BSE 30

From a bottom of around 2,600 India’s BSE has risen over threefold to over 12,000 (in May) in just three years! No markets or trends go in a straight line though. But given the continuity of the present momentum, the longer picture looks favorable for India’s BSE to further carve new heights under the auspices of its sustaining its economic growth clip buttressed by a backdrop of liquidity friendly investing landscape.

Booms are usually characterized by having new record high price levels. To quote Dr. Marc Faber in his book Tomorrow’s Gold (emphasis mine), ``The longer a trend has been in place, the more time will be required after the turning point before the changes are perceived, even if the new investment themes immediately enjoy a very powerful bull market.” In essence, it takes time (again!) for the investing public to realize a change in psychology which prolongs, deepens and intensifies the trend (see market action below).

This is not however to suggest or predict that the Phisix would hit 22,000, although given the cyclical aspects of the present market, such probability could not be discounted. My point is, if indeed I am correct to assess that the underpinning of today’s market cycle as thriving at a secular advance phase, sometime in the near future, the Phisix would most likely take out its recent high of 3,300. And like India’s BSE, a new high price record will be set. That is what cycles are all about.

Going back to the Phisix, since it peaked in 1997 alongside our neighbors and segued into its declining phase triggered by the ‘Asian Crisis’, the benchmark fell by about 70% to a bottom of about 1,000 in 2003 or in about 7 years. This makes the entire trough-to-trough cycle of the Phisix to about 17 years. Of course, our scant records could hardly be used as sufficient grounds to make a trajectory. But if history would do a reprise then we could about 6 to 7 years before the market tops out.

The Phisix today, like Japan’s Nikkei appears to be coming from the low side, if one reckons from the recent milestone bottom. This makes an unlikely path for the Philippine benchmark to decline more than its previous threshold low. Aside, the Phisix compared to other emerging markets has had a modest advance during the US FED inspired liquidity driven asset boom years since 2003 relative to its peers.

In addition, I expect the market-supportive politically-motivated policies of global central banks led by the US Federal Reserves to maintain a continued lax or loose liquidity environment, since a significant segment of the world economy have been driven by the financial markets, through what we call the “wealth effect” or ``an increase in spending that accompanies an increase in wealth (in absolute terms), or merely a perceived increase in wealth (in relative terms), according to the definition of Wikipedia.org.

Another factor that could temporarily diminish the negative ramifications of the declining housing industry in the US is of “market action”, or the continued denial by the public that such adverse events would translate to equally unfavorable implications to the financial markets. In other words, it is all about market psychology. In the words of guru John Hussman of the Hussman Funds (emphasis mine), ``When a concept is widely believed by investors, they may not abandon it immediately, so it's important to gauge the amount of “sponsorship” they throw behind it. That broad analysis of investor sponsorship and the broad quality of market internals goes into what I refer more concisely as “market action.””

Put differently, if the psychology of the investing public or if Wall Street remains inexorably tilted towards the purview of favorable market action, and most importantly if such optimism is backed by the wherewithal to do so, then the markets may, in defiance to these “negative” developments, continue to rise. And the likelihood of the continued provision of cheap capital gets closer by the day as signs of weakening in the US economy may prompt its monetary authorities to relieve the pressures built by its recent moves and move to postpone the day of reckoning. As Mr. Hussman advises, ``we can’t simply ignore or trade against the market’s various “themes” or concepts just because we believe they’re wrong.”

Of course, one would argue that US rate cuts would translate to an open admission of an ongoing US recession, as economist Gary Shilling notes ``With only one clear exception in the mid-1990s, central bank ease since the mid-1950s means the economy is in a recession, or will be within a few months” and that such would imply muted growth prospects for emerging market economies and in effect, would be baneful for its equity assets. However, it is my view that since markets have been propelled by liquidity in 2003 and thereafter, for as long as these liquidity injections remains voluminous enough to offset any intervening economic weaknesses, asset classes would likely find a floor and most probably start to rise anew. Where else would all these excess money go anyway? Although, inflation signals would likewise rear its ugly head anew overtime.

Finally, there have been increasing debates among the experts today tackling on the supposed decoupling of Asia from the US, given the present US housing led downdraft. A majority of which have stated that Asia, at its present framework, appears unprepared to depend on its own. As an investor myself, I would stand aside the polemics and watch market signals to see whether such disconnect would transpire or not. My bet is, considering how the market cycles are operating, is that in the future they will. Posted by Picasa

A Wall of Worry or A Slope of Hope?

Now anent the possible ramifications of an disorderly decline in the US financial markets, there have been two opposing school of thoughts here, one is that rising risk aversion trades would possibly lead to an outflow of investments from high risk areas such as emerging markets and commodities to a “flight to safety” into the US dollar and US dollar denominated fixed income sovereign instruments “treasuries” on the account of the unwinding of leveraged “short” positions, capital outflows from subdued expectations for the yuan’s rise on China’s slowdown and possible improvement of the US current account deficits. On the other hand, the US dollar bears point towards an exodus or capital flight from the US assets into hard or real assets and international markets.

While your analyst may be inclined towards the latter, as I have shown to you the long term cyclical patterns of the US equities as well as US Treasuries both on a declining trend, (for US treasuries rising yields-to repeat, over the long term), I would have to listen to the markets to reaffirm my convictions. And thus, two other barometers are needed to support my adapted underlying theme, the Gold index and the US dollar Index.

The gold market appears to be in a long-term bullmarket as previously shown. I would like to remind you that gold’s motion has not been limited to a US dollar inverse correlation. As a matter of fact, while the US dollar climbed in 2005 against its major trading partners as measured by the US dollar trade weighted index- see figure 6, gold rose against ALL currencies. This is a significant development considering that mainstream media portrays gold as a plain vanilla inflation hedge.

When politicians and their bureaucrats on a global scale attempt to outdo each other via “beggar thy neighbor” policies of massively printing endless quantities of money and issuing grotesquely immense amount of credit to destroy the purchasing power of their currencies in order to keep their “competitive” pricing edge for export concerns, tendency is for these government mandated or “fiat currencies” to drop against gold. And this phenomenon of destroying the purchasing power of global currencies can’t go on forever....it would either lead to hyperinflation or a collapse in the world monetary system. And gold’s rise against all currencies in 2005 could be symptomatic of this stealthily progressing malaise.


Figure 6: Goldmoney.com/James Turk: US Dollar Index (Log scale)

In figure 6, we can observe of last year’s US dollar index rally. The long term chart also shows of the bullmarket of the US dollar from 1994 to 2002 marked by the green channel. The US dollar started its torrid decline following 2002 peak (marked by the red channel) and rallied steeply last year (small green channel).

Today, the lower green channel of last year’s rally serves as our guidepost (its resistance level) as to whether the US dollar index would benefit from the “flight to quality” emanating from increasing risk aversion trades.

Until manifestations that prove the “flight to quality” theme becomes evident, I remain in the camp of the US dollar bears.

Of course there is always the middle ground or the synthesis: the scenario of a soft landing, a goldilocks economy, subdued inflation and ample liquidity. As they say, bullmarkets climb on a Wall of Worry while bearmarkets slide down on a slope of hope. Posted by Picasa

Time: An Investor’s Friend

As a trend watcher and a market participant, my primary concern is to look for major trends or investment themes rather than to be immersed or get engaged in glamorous or fad based punts. Unfortunately, to the average investor’s mindset, expectations are weighted towards the actions of the ticker. Immediate gratification rather than long-term rationality is commonly preferred. The markets essentially become an arena for gambling. Yet when the cycle turns against them, they have everyone else to blame except themselves.

Do you think the outperformances of market savants as Warren Buffett, Ben Graham and their ilk come with short-term mark-to-market bets? These gurus had long periods of underperformances before the markets eventually proved them right. Take for instance the illustrious Bill Miller of the Legg Mason Value Trust. His fund has had a phenomenal streak of beating the S & P 500 for a period of 15 years! Yet his fund is down by about 10%, does it make him less of a guru for today’s short-term quirk?

Unlike contemporary analysts who rate “value” buys on issues which have been moving up, these investing icons load up on issues frequently ignored by the public which to them represent as intrinsic value. Market timing, in short, has been inconsequential to them. In the words of another guru David Dreman in his Contrarian Investment Strategies: The Next Generation (emphasis mine), ``Demanding immediate success invariable leads to playing the fads or fashions currently performing well rather than investing on a solid basis. A course of investment, once charted, should be given time to work. Patience is a crucial but rare investment commodity. The problem is not as simple as it may appear; studies have shown that businessmen and other investors abhor uncertainty. To most people in the market place, quick input-output matching is an expected condition of successful investing.”

Patience, after all, is a matter of managing one’s expectations of time. To quote investing wordsmith Peter Bernstein (emphasis mine), ``Once we introduce the element of time, the linkage between risk and volatility begins to diminish. Time changes risk in many ways, not just its relation to volatility.” In converse, the shorter the timeframe, the bigger the risk involved. Time is, in essence, an investor’s best friend.

Sunday, August 20, 2006

Gold Conundrum: European Banks Selling Behind the Curtains vs. Seasonal Strength?

``And when voters get scared, politicians leap into action. Unfortunately, fast government action almost always results in irrational action.”-D.R. Barton is the editor and founder of Traders’ Tuesday, and editor of the E.S.P. Profit System.

One of the discordant messages or might I say “conundrum” painted by today’s market has been the surprising underperformance of gold. In the wake of the Fed’s decision to hold in abeyance its interest rate hikes, gold has plunged by about $50 over the past weeks under the rationale of “lower inflation concerns” or “mitigated geopolitical risks” or “dragged by oil”.

I find such arguments as absurd. The benchmark precious metal has basically thrived on uncertainties in every known dimension (be it politics, economic, financial, monetary etc..). While the war in Lebanon may have temporarily led to a multilateral brokered settlement, the overall political climate in the Middle East remains as tense and poses as potential powder keg.

Listening to the US former Secretary of State Henry Kissinger’s interview at the Bloomberg, I have to share his view that the ceasefire interposed by the UN may not last considering that the Hezbollah is unlikely to acquiesce on disarmament. Furthermore, the Hezbollah claimed victory as the first Arab group to have dragged the Israelis into a war of attrition of which compelled their archrival to a ceasefire unlike the outcomes in 1948, 1956, 1967, 1973 and 1982.

George Friedman of Stratfor gives an incisive comment (emphasis mine), ``The group did not conduct offensive operations; it was not able to conduct maneuver combat; it did not challenge the Israeli air force in the air. All it did was survive and, at the end of the war, retain its ability to threaten Israel with such casualties that Israel declined extended combat. Hezbollah did not defeat Israel on the battlefield. The group merely prevented Israel from defeating it. And that outcome marks a political and psychological triumph for Hezbollah and a massive defeat for Israel.

Now with a psychological booster gleaned from the recent proxy war, backed by oil surplus oil funds, what stops the Hezbollah and/or its patrons (Syria and Iran) from expanding the theatre of war to attain their politically desired objectives or agenda?

Another fuzzy excuse is of the “slowdown” or “lower inflation” concerns; monetarist proponent and Noble laureate Milton Friedman once said that “inflation is always and everywhere a monetary phenomenon.” This means that inflation has less to do with state of economic growth since it is always and everywhere about money and credit. Morgan Stanley Andy Xie explains the present environment best, in my view:

``The basic reason for rising inflation is that global real policy rates are less than half of, and global inflation 50% above, average levels over the past decade. Real interest rates are not high enough to exert a headwind against inflation.

``The risk of accelerating inflation is even higher, considering that central banks have pumped enormous liquidity into the global economy over the past decade. Until recently, the inflationary effect of the liquidity was held back by deflationary shocks. Instead, the money inflated asset markets, which, in turn, boosted global demand.

Where consumer demand may have been temporarily curtailed driven by a deceleration of the US real estate industry, the transmission mechanisms of the inflationary policies by global central banks could be channeled into other areas of interest by the speculative community. Hedge fund dabbling on the field of property catastrophe reinsurance or betting on weather outcomes is just one of such vivid manifestations.

Has the recent rise in global equity markets, despite the semblance of a tightened money environment, as manifested by the full inversion of the yield curve spectrum in the US, presuppose a future or forward easing by the US Fed? Are the actions in the financial markets today, compelling central bankers around the world to adopt a more investor or market friendly regime?

In addition, the argument that oil has dragged gold lower fallaciously presumes that inflation is driven by energy rather than excess liquidity stimulating inordinate demand for oil or oil as a major beneficiary from inflationary policies that has lowered the “price value” of the US dollar relative to oil.

Further, real interest rates will have to climb further to wring out “inflation” or excess liquidity out of the system similar to the actions of former US Fed chair Paul Volker in 1980; something of which “measured” pace of rate increases by global central banks are unlikely to accomplish.

In short, inflation is very much embedded and entrenched around the global financial and economic system and would most likely find its way in different outlets, unless global central banks act decisively. Moreover, as discussed previously, political expedience and credibility concerns are likely future drivers for sustained inflationary growth. So in essence, the financial markets appear to be “mispricing” or underrating the relationship of gold to a prospective slowdown, the oil-gold affinity and easing of geopolitical concerns.

One more thing; because inflation is essentially what Central bankers stand for, controlling inflation expectations is one of their major functions. And for a little spice, let me add my conspiracy theory.

While it is summer period in the in the US and Europe possibly much of the market participants could be off from work for a vacation which leads to relatively light volume of trades in the markets.

In the meantime, European central banks have been significantly behind schedule in offloading their gold holdings allotment under the 15 member European Gold Agreement (EGA) by about 169 tonnes which ends in September 26th, according to Resource Investor’s Charlotte Mathews, ``In the year to this September, the signatories were permitted to sell 500 tons of gold but by the end of July they had sold only 331 tons. They cannot carry over the allocation from one year to the next.”

It could be that central banks have taken advantage of the present “lean season” in the financial markets to carve out a “low inflation” scenario to “manage the public’s inflation expectations” by unloading the remaining balance of 169 tonnes. Of course, heavy selling on lean volume equates to lower prices, which is possibly what we are seeing today.

However, as a matter of seasonality gold appears to be entering its strongest period as shown in Figure 6.


Figure 6: CaseyResearch.com: gold Rises more in the Second Half of the Year

According to market savant Doug Casey, ``As you can see in Chart A, which summarizes gold's monthly price moves over the past 30 years, the yellow metal typically shows weakness from February to April, rallies in May, then heads down for summer. In August, gold typically begins to rebound and moves up pretty much for the rest of the year. Of course, this is an average pattern, not an invariable one. In 10 years out of the last 30, gold dropped in the fourth quarter. Even so, the long-term data suggests the average pattern is worth paying attention to.”

So what drives gold higher during the second half?

Seasonal jewelry purchases, according to CNN, ``September and October are key holiday periods in China - the mid-autumn festival -- and India -- the revival of the wedding season -- and precede Christmas purchasing in the OECD countries.” Aside from of course, Christmas shopping in the US of which gold is sold most during the fourth quarter or about half or 45% of the annual gold jewelry sales in 2005 according to Resource Investors.

Market maven Mr. Casey remind us of India’s share as a major consumer of the gold jewelry segment as substantial, he says ``In fact, in 2005 Indian gold jewelry sales rose by 25%, and now that country takes credit for about 23% of the world's consumer gold sales. The U.S., at #2, takes down just 12%.”


Figure 7 shows that during the past three years, gold has markedly used August for its springboard towards a yearend rally.


Figure 8: stockcharts.com: HUI Amex Gold bugs follows gold’s footsteps?

As a matter of benchmark, I used the composite HUI Amex gold bugs index representative of unhedged gold mining stocks as possible clue to the movements of local mining shares counterpart. In figure 8, the HUI index has also followed the footsteps of gold during the past 3 years as to mounting a last quarter rally.

To recap, the present movements of gold appears to be founded on nebulous grounds; low inflation/demand slowdown, oil as a drag and mitigated geopolitical risk, as the inflation scenario remains deeply entrenched into the system and remains a politically expedient and “credibility” friendly alternative to politicians and their bureaucrats compared to the “deflationary option” while geopolitical environment remains critically volatile despite present news accounts.

It could be that European central banks have been trying to “manage” inflation expectations by possibly selling their balance due to end this September under the EGA agreement on a lean light volume market as brokers and financial market players could be in vacation.

One mitigating factor despite the recent selloff is the seasonal strength of gold going into the fourth quarter usually with August as springboard. Finally, real interest rates, the US Federal Reserve’s forward policies which could be expected to err on the side of inflation and a declining value of the US dollar will continue to cast a favorable light for higher gold prices.

Verbum sapienti satis est (A word to the wise is enough- Titus Maccius Plautus Roman comic dramatist) Posted by Picasa

Perplexing Ambiguities in the Global Financial Markets

``Money, again, has often been a cause of the delusion of the multitudes. Sober nations have all at once become desperate gamblers, and risked almost their existence upon the turn of a piece of paper.” Charles Mackay (1814-1889), British Poet, author of Extraordinary Popular Delusions and the Madness of Crowds

Illustrious economist Lord John Maynard Keynes once wrote, ``the markets can stay irrational longer than you can stay solvent.” When bad news is deemed as a premise to buy, and good news as an impetus to sell, isn’t that reckoned as irrational?

Just observe the world financial market’s dissonance; some segments appears to have factored in a looming temperance of the pace of global economic growth, and thus we have been witnessing a vigorous rally in global sovereign bonds as well as significant declines in prices of key commodities as oil and a majority of basic metals. As shown in Figure 1, Philippine treasuries have rallied strongly in tandem with its counterparts. This has been likewise reflected by the outstanding performance of the peso (which has been on a roll) as portfolio flows have recently supported the domestic financial markets.


Figure 1 Asianbondsonline: Philippine Treasury 2-year (green) and 10-year (red) Yields headed lower

Paradoxically, global equity benchmark indices have ascended briskly as if to discount the possible adverse effects of a prospective economic slowdown to corporate financial health. The basic presupposition is that a low inflation landscape would be conducive for higher price earnings multiples. As shown in Figure 2, the Dow Jones World Index and the Dow Jones Asian Index has so far staged a mighty comeback. If the present momentum holds, the clearing of the present obstacles (resistance levels) paves way for a retest of its recent highs!


Figure 2: Stockcharts.com: A Resurgent Dow Jones World Stock Index (red-black) and Dow Jones Asia Pacific Index (black)

But what of earnings growth? In my July 24 to 28 outlook (see Liquidity Driven Rally Amidst A US Slowdown?), I noted that the widely followed independent Canadian research outfit BCA Research expects global earnings to be revised downwards as the US growth engine cools. To extrapolate; as the earnings growth cycle peaks and most likely downshifts on a backstop of moderating pace of global economic growth, the price earnings ratio would essentially bloat. Higher prices then would exaggerate p/e ratios under this environment. But does anyone care about P/E ratios today? Or have P/E valuations been germane to present market conditions?


Figure 3: US Global Investors: Baltic Dry Index on a 52 week high!

Or could it be that equity markets are right, and that deceleration worries have been arrantly or even at least partially misplaced, as the bulls would have it. Can the prevailing boom conditions in the global economy cushion or offset the present headwinds from the US economy?

While most commodities have been on a decline, oddly, shipments to China have once again lathered up as shown in Figure 3. According to US Global Investors, ``The Baltic Freight index once again made another 52 week high to 3,681. Dry bulk tankers used to ship iron ore and other commodities to China are in demand and are receiving higher day-rates.”

The Baltic Dry Index is ``an assessment of the price of moving the major raw materials by sea" or to quote Daniel Gross of Slate Magazine represents `` a good leading indicator for economic growth and production. After all, it doesn't deal with container ships carrying finished goods. It deals with the precursors to production: bulk carriers carrying building materials, cement, grain, coal, and iron. Unlike stock and bond markets, the BDI "is totally devoid of speculative content," says Howard Simons, an economist and columnist at TheStreet.com. People don't book freighters unless they have cargo to move.”

Aside from seasonal factors (BDI index tends to go up during the last semester of each year), could the 52-week high BDI suggests of an upturn in commodity prices bolstered by a “surprising” turnaround in the global economic setting presently bogged down by “slowdown” expectations?

Or have global markets been anticipating more liquidity injections from the US Federal Reserve and global central banks? The recent decline in US inflation indicators as represented by Producer and Consumer Price Indices appears to have bolstered the case for a continued stance towards maintaining present interest rate levels by US authorities, and that a more pronounced retrenchment may even lead to a more accommodative monetary environment (slashing of rates).


Figure 4: Bond Market Association: Surging Credit Instruments (mortgage related securities, US treasury issuance, Money Market Instruments-Commercial Papers and Large Time Deposits and Asset Backed Securities): What tightening?

Figure 4 shows that even as Central Banks such as the US Federal Reserve go over the rigmarole of raising the cost of lending at a graduated clip, non-monetary aggregate measures of liquidity in the US have been exploding to the firmament, such as Mortgage Related Securities, Asset Backed Securities and Commercial Paper issuance. In the words of Dr. Kurt Richebächer excerpted from the Daily Reckoning, ``There never was any monetary tightness (emphasis mine). Instead, there has for years been a sharply accelerating credit expansion that has grotesquely run out of relation to economic activity. We see an economy and financial system that have pathologically become addicted to a permanent credit and debt deluge.”

Talking about addiction, the prospects of more booze for the continuity of the asset backed shindig have most likely kept short-term oriented investors in celebration. As Lord Keynes once wrote, 'Men, like dogs, are only too easily conditioned and always expect, that, when the bell rings, they will have the same experience as last time.”

Anent to surplus liquidity, the quest for higher yields and diversification into uncorrelated markets have driven hedge funds into investing or betting in...believe it or not...weather outcomes! According to the New York Times, ``Reinsurance companies, staggering from their 2005 losses, need more capital, and hedge funds, in search of high returns, have a lot of it.” Yes, excessive money and credit has led money managers and financers to tap, aside from conventional markets into the remotest geographical corner of the world, to unorthodox or seminal markets as property catastrophe reinsurance. Hedge funds and private equity capital have contributed to $7.3 billion of the $23 billion recently raised to recapitalize the reinsurance business. Talk about inflationary manifestations.

Finally, the short-term noise or the present market incongruities could also be attributed to quirks such as the expiration of options, as shown in Figure 5.


Figure 5: Mish Shedlock’s The Survival Report: Option Expiration rallies

According to WhiskeyandGunpowder’s Mish Shedlock, ``This week's rally has everything to do with inflicting maximum pain on options holders, and almost nothing to do with economic reality. For instance, one week ago, the QQQQs were flirting with a breakdown below $36, but with close to 700,000 $36 put options set to expire at the close of today, there was no way the market was going to let those options close in the money. In fact, there are over 1.2 million put options spread between strikes $35-38 for the QQQQs, all of which will expire worthless with a close above $38 this week. On the flip side, there are significant numbers of call options at strike $38 and $39, and not much at lower strikes relative to the numbers of put options. The bottom line? A QQQQ close near $38 this week will have the largest number of puts and calls expire worthless, which is a spot of maximum pain to options holders that the market often seeks to find at the end of expiration week.”

Perplexing ambiguity indeed. However, my view remains that over the interim, global Central banks will maintain their “market friendly” stance, while over the long term interest rates are bound to move higher on the continued adoption of inflationary policies and an attendant rise in inflation expectations.Posted by Picasa

Friday, August 18, 2006

People's Daily Online: ASEAN officials seek to speed up building of AEC

I have noted that the increasing trend of regionalization will enhance crossborder investments, which should also translate to corresponding advancement in the financial markets. According to China's People's Daily online,


"The AEC is a unified community similar to the European Union that ASEAN hopes to establish by 2015 through various ways, such as the integration of business sectors.

"ASEAN countries have worked out roadmaps for the eleven priority sectors toward liberalization, that is, automotive, garment and textile industries, e-commerce, healthcare, airlines, tourism, wood-based products, marine and aquatic products, rubber, agro-based products and electronics."

Progress finally taking shape?


Sunday, August 13, 2006

A Knee Jerk Reaction to the Foiled Terror Plot in UK

``Nobody likes the idea of Peak Oil. Firstly, you have the politicians. Naturally, a politician will never say that there is such a thing as Peak Oil. It is suicide to give bad news, so a politician will never do that…Secondly you have the media. The media do not like Peak Oil. Why? There is no sponsorship for Peak Oil. The oil companies do not like Peak Oil because you should not say that your soup is cold; you should always say that it is very hot and very tasty, yes? So nobody wants to hear of this phenomenon of Peak Oil.” -ALI SAMSAM BAKHTIARI, retired “senior energy expert,” formerly employed by the National Iranian Oil Co. (NIOC) of Tehran, Iran.

An uncovered terrorist plot in Britain which allegedly intended to hi-jack and bomb or crash several planes into targets in the US, in the scale and magnitude of September 11 recently roiled some markets. Except for Eastern European markets, most of Europe’s equity bellwethers tumbled alongside its currency the Euro, while Crude Oil fell plunged by over $2 on Thursday following the rationale that reduced demand for travels by air would send jet fuel prices lower and take a knock at consumer confidence. As the Euro and Oil took a hit, gold came crashing along with them. See Figure 5.


Figure 5: stockcharts.com: Heavy Loses in Oil and Gold on terror plot

I find this reaction as rather fuzzy reasoning. The world did not stop in the aftermath of September 11. While there may have been reduced interest to take up air travel particularly with relevance to discretionary tickets, it did not stop travel in entirety as travel shifted in other forms. Further, terrorism was definitely not cause of the derailment of consumer confidence as shown in Figure 6.


Figure 6: NASDAQ: Technology Bust not 9/11 is the Culprit

Since the peak of March 2000, the technology bubble bust led the US technology benchmark the Nasdaq to a climatic decline and was at near bottom when September 11 transpired. In fact, barely a month following September 11, the technology-rich bellwether managed to edge higher from its September 11 levels but eventually faltered as the US recession culminated. In short, the consumer confidence in the US had already been battered by the unfolding recession with 9/11 delivering the exclamation point.

Further, based from the initial reports of the botched plot, it would appear that the terror group’s attempt to wreak havoc in the scale of 9/11 encountered a serious breakdown in its operational security; either intelligence efforts by the respective authorities have succeeded in sufficiently penetrating the group’s operations or a would be participant turned cold feet as to snitch on the conspirator’s grand design. This means that the group’s potentials had been severely degraded, and that efforts to regroup and redeploy would take sometime and possibly utilize other areas as staging points for future operations. Therefore, one should expect the carry-on effects to be minimal, if not knee jerk or reactionary, unless of course, other publicly unseen factors working behind the present developments in the financial markets remain camouflaged. Posted by Picasa

Inflationary Proclivities of Central Banks

``Lenin is said to have declared that the best way to destroy the Capitalistic System was to debauch the currency. . . Lenin was certainly right. There is no subtler, no surer means of overturning the existing basis of society than to debauch the currency. The process engages all the hidden forces of economic law on the side of destruction, and does it in a manner which not one man in a million can diagnose." John Maynard Keynes, The Economic Consequences of the Peace, 1920, pg 235.

As anticipated, Wall Street took the US Federal Reserve’s hiatus from its 2 year endeavor to normalize money policies as a reason to markdown equity prices, on the premise of a “slowdown-hurts-earnings” excuse, alongside with it, the Philippine Composite Index, which has closely tracked the movements of the US equity markets. The bizarre part came with Friday’s US strong retail sales figures, which had been imputed as a potential fulcrum for future Fed action on raising borrowing costs, as a reason to sell. Sell on Good news, Buy on negative news...this is today’s Wall Street mantra.

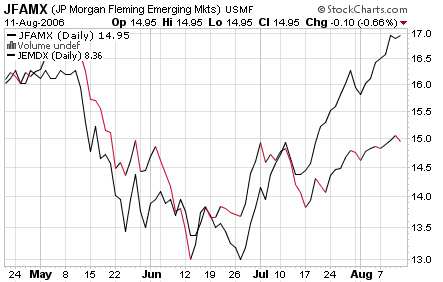
While the Phisix trailed Wall Street, this has not been the case with most emerging markets for last week. To wit, our ASEAN neighbors performed energetically on the broad financial markets, namely currencies, bonds and equities, which equally reflected the advances in other emerging markets of other regions, as shown in Figure 1.


Figure 1: Stockcharts.com: JP Morgan Emerging Market Index (black-red) JP Morgan Emerging Market Debt Fund (black)

Advances in bond prices (declining yields) have outperformed equities of late, as the chart above shows. These activities suggest that investors have been factoring in a slowdown in world economic growth. For the week, as the Phisix fell (-.89%), ASEAN markets were mostly on the upside, particularly Vietnam (+1.83%), Thailand (+.73%), Indonesia (+.92%) and Malaysia (+.46%).

In the light of moderating inflation indices, ASEAN central banks have either cut rate (Indonesia for the third time in four session for this year) or kept rates at unchanged (Philippines, Thailand and Malaysia) to spur economic growth. The “focus” on growth have led to an ardent rally in the region’s currencies as the Thai baht raced to a six year on a 1.3% jump to THB 37.26 over the week, while the Philippine Peso surged by .5% to a four month high at PHP 51.25, the Indonesian rupiah edged higher by .2% to 9,075, while Malaysia’s ringgit remained unchanged.

As of August 8th, according to Bloomberg’s Yumi Kuramitsu and Jake Lee, ``The Indonesian currency has gained 8.1 percent this year, with the Thai baht rising 8.8 percent and the Philippine peso strengthening 3.4 percent over the same period.”


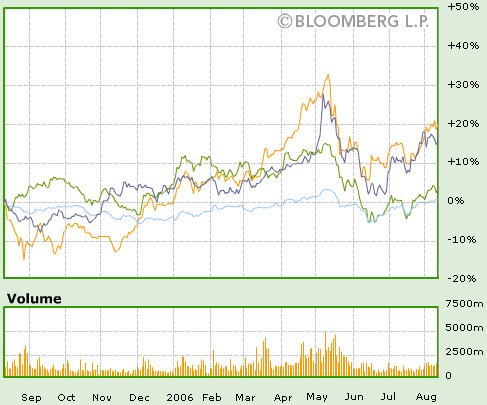
Figure2: Bloomberg: Relative Performances; Indonesia (orange), Phisix (blue), Thailand (green), Malaysia (light blue)

As shown in Figure 2: rising regional currencies has mostly been reflected in buoyant equity benchmarks (except Thailand) led by Indonesia (returns on a year-on- year basis), followed by the Phisix, Thailand and Malaysia. Following May’s dramatic selloff, the above equity benchmarks have been trading below May’s peak.

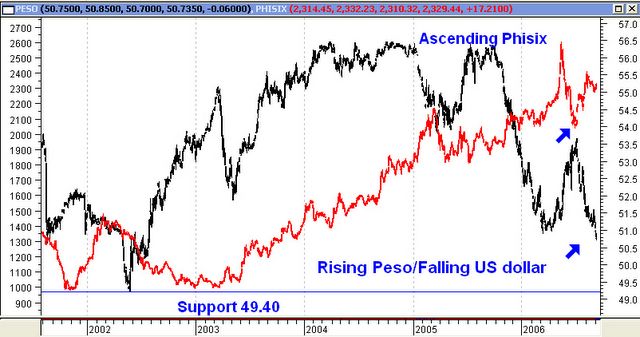
At the margins, I have noted in the past that the rising peso has been inspired or set by foreign portfolio flows buttressed by OFW remittances and trade receipts.


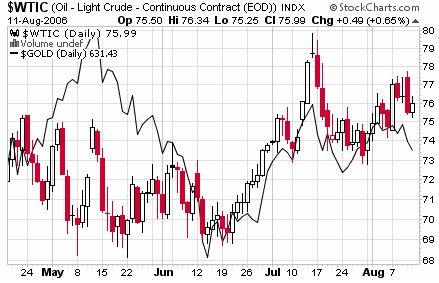
Figure3: Ascending Phisix (Red candle) on the backdrop of a falling US dollar/rising Peso (black candle)

As shown in Figure 3, the rising Peso has preceded a rally in local equities, manifesting a remarkable correlation, and should be further boosted as the Peso firms on the backstop of a prospective relaxation of monetary policies by global central banks and loose liquidity environment.

On the other hand, widely followed BCA Research admonishes that A Fed pause will do emerging equities more harm than expected (emphasis mine),

``A Fed pause typically does not help emerging market (EM) equities...EM equities have rebounded about 15% in the past two months, following the deep correction in May. There could be more upside in the near term in response to the Fed’s rate pause this week, but history suggests EM stocks will likely struggle if the Fed tightening cycle is over. EM stocks are growth sensitive and tend to advance when the Fed is hiking interest rates because the latter reflects improving U.S. economic conditions. While the structural story for EM stocks remains positive, the developing slowdown in the U.S. is a powerful headwind, especially since Chinese policymakers are also trying to cool their commodity-intensive economy. Bottom line: we recommend a neutral stance on EM stocks in global equity portfolios.”

It is rather odd where BCA views positive prospects on US stocks and bonds amidst the dour outlook they have publishing of late, yet maintains a neutral stance on emerging equities to which, according to them, is anchored to US economic conditions.

If the US bond markets are to continually rebound on the backdrop of a moderation economic growth (read: soft landing) and subdued inflation outlook, this indicates further loosening of the money policies ahead. As indicated last week, benchmark treasuries have mostly led Fed policies rather than the other way around.

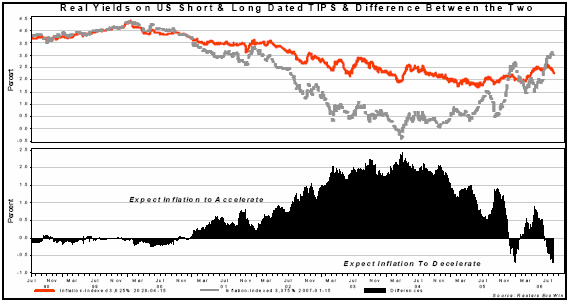
Inflation as gauged by the activities in the bond markets appears to be indicative of a prospective meaningful reduction as shown in Figure 4.


According to the Bureau of Public Debt, TIPS or Treasury Inflation Protected Securities ``are securities whose principal is tied to the Consumer Price Index. With Inflation the principal increases. With deflation, it decreases.” In short, TIPS are sovereign debt instruments with yields computed based on activities of the Consumer Price Index as a measure of inflation.

Based on the yield differentials of long and short dated TIPS instruments, the bond market appears to be looking at deflationary conditions, according to the Gavekal Research team, ``The short dated bond, indexed on the short term cost of money has seen its yield move from 0% in 2003 to 3% today. Meanwhile, the long dated TIPS has been range trading between 1.5% and 3% since 2002, and we are basically smack in the middle of that trading range today. More interestingly, the difference between the two is almost at an all time high. So, in other words, the US bond market is positioning itself for deflation rather than for inflation. While, a few months ago, bond markets were by and large saying that inflation was a threat, this message has now reversed. This is an important development.”

Again, should the bond markets persist to manifest on the trends indicated by BCA and Gavekal corroborated by either economic data or significant deterioration in the equity markets then one can expect the US Federal Reserve to act on relaxing or reversing its present course to “stimulate” or “reflate” both the financial and economic settings.

Loose money and credit policies equate to abundant liquidity which is highly conducive for the leveraged speculative community. Under such circumstances, one should expect the indispensable participation of financial management entities (hedge, mutual, institutional funds, et. al.) to further adopt yield chasing strategies or finding returns in excess of cash or funding costs, even to the farthest and remotest corner of the most unstable areas of this world, as had been during the past three years.

My point is liquidity or the present inflationary biases, as manifested in the realm of global finance in its myriad forms, such as massive trade imbalances, explosive growth of structured finance or ubiquitous credit boom, frenzied worldwide M&As, petro revenue liquidity et. al. , has driven economic growth on a macro framework rather than the other way around, and would continue to do so unless interdicted by a financial accident. In the same context, we find that these inflationary biases would likely be channeled into various asset classes as we are witnessing today.

In the appearance of coordinated tightening by global central banks led by the US Federal Reserve, liquidity has apparently been persistently accommodative allowing for intermittent rallies as seen in diverse markets and asset classes geographically.

Although there could be indeed signs of softening of inflation expectations, yet on the premise where global central banks would like to be seen as “successfully managing” the financial system, they are likely to err on the side of tolerating inflationary biases than to allow deflationary forces to overwhelm and render their policies as inutile.

Who among the bureaucrats would like to be perceived as being ineffective or inept? You can just imagine how its Japanese counterparts threw every known textbook response from adopting Keynesians measures of massive deficit spending to the monetarist approach of slashing rates to Zero or flooding central banks with cash to stave off a deflating bubble in the 90s only to fail miserably. Japan’s failed policies could be freshly ingrained in the minds of every member of the US Federal Reserves.

Moreover, you have the present war policies, an extended military exposure worldwide, massive defense and homeland security spending, humongous future liabilities concentrated in welfare entitlement programs as medicare and healthcare and foreign holdings of US bonds. Likewise globally, trend towards increased globalization and the deflationary shocks from the emerging market crises, the tech bubble bust, China’s accession to the WTO and Japan’s banking reforms, which have previously contained the effects of inflation, has permitted central banks around the world to adopt loose money policies too. ``As the effects of these unique factors pass, the inflationary effect of the excess money supply is becoming apparent” notes Andy Xie of Morgan Stanley.

At the end of the day, Central banking is all about inflation. According to analyst Puru Saxena (emphasis mine), ``You must understand that the central banks don't raise interest-rates to fight inflation. After all, the modern-day central banking system IS inflation! Central banks raise or lower interest-rates in order to manage the public's inflation fears or expectations. During such times when the public wakes up to the inflation problem and starts losing faith in the world's paper currencies (present scenario), central banks raise interest-rates to show that they're fighting inflation. Interest-rates are pulled up in an effort to restore confidence in the world's currencies as a higher yield makes currencies more attractive. On the other hand, when the public's inflation fears are under control and confidence in the monetary system is high, central banks lower interest-rates to create even more inflation!” Posted by Picasa