Fools and their money are soon parted, but economists are always with us. They are there to encourage the next generation of fools. That’s the way the world works.—Gary North
In this issue
Phisix: Mean Reversion Prevails: Philippine 3Q Growth Rate Falls to 5.3%!
-Financial Instability Warnings from the ADB (Again), the Germany’s Bundesbank, and Singapore’s MAS
-ECB’s Draghi on Bubbles: Who Cares? QE Must Prevail; World Billionaires Dump Stocks, Hoard Cash
-Bipolar World: Record Stocks, Crashing Commodities
-Collapsing Oil Prices Signify the Periphery-to-the-Core Bubble Dynamics
-Slowing EM and DM Growth Compounds on China’s $6.8 Trillion ‘Wasted’ Investments
-Reversion to the Mean: Philippine 3Q Growth Rate Falls to 5.3%!
-1 Household Growth Remains on a Downtrend
-2 Investments Picked UP; Construction and Finance as 3Q Leaders
-3 Why Statistical Growth Will Decline: Surging Credit Intensity!
Phisix: Mean Reversion Prevails: Philippine 3Q Growth Rate Falls to 5.3%!
We do live in interesting times.
As each day passes, the world appears to be headed in opposite directions.
But this isn’t what you will glean from the consensus literature.
Financial Instability Warnings from the ADB (Again), the Germany’s Bundesbank, and Singapore’s MAS
While most developed economy stock markets continue with their seeming implacable push to the upside, international political authorities seem to be ringing the alarm bells with increasing alacrity.
Last week, I pointed[1] to UK’s PM David Cameron’s open letter stating that red warning lights of global financial instability have been flashing once again. I also noted that current conditions seem to be ripe for a ‘debt trap’ as the general manager of the central bank of central banks, the Bank for International Settlements, Mr. Jaime Caruana warned in a recent speech. Meanwhile on a localized dimension, the central bank of Australia, Reserve Bank of Australia, headed by Governor Glen Stevens expressed concerns over a housing boom-bust cycle. And in a more subtle way, the US Federal Reserve Open Market Committee (FOMC), while maintaining optimism at current developments indicated disquietude over a build-up of “asset valuation pressures” as well as a “loosening of underwriting standards” in the debt markets at their minutes.
Understand that in today’s deeply connected world, problems in one country can be transmitted to become a contagion.
For this week, like her peers and for the second time this year the Asian Development Bank (ADB) has issued sanitized words of caution in the press release of their publication of November’s edition of the Asian Bond Monitor. The ADB aired their concerns over sustained expansion of foreign denominated bonds by Emerging Asian nations where from January to September, the amount of bonds issued have already surpassed the entire 2013. This robust bond growth comes in the face of what ADB sees as rising risks, particularly “a faster-than-expected US interest rate hike and a stronger dollar” aside from “other challenges from tightening liquidity in the region’s corporate bond markets as Basel III requirements deter banks from holding large bond inventories, and a weaker property market in the People’s Republic of China (PRC), given many property developers there are highly indebted.”[2] Also amidst the current risk climate, the ADB mentioned of the record holdings of foreign holdings of Indonesian bonds. The ADB, to my construal, probably sees this as a potential source for financial market disturbance.
[As a side note, capital flight, which frequently has been used by the consensus as scapegoat and pinpointed as the cause of instability, only represents a symptom of an underlying disease—domestic bubbles which has been magnified by international carry trades]
Germany’s central bank, Bundesbank, likewise counsels of the amplifying risks from low interest rates in fueling “risky behavior”. Bundesbank Vice President Claudia Buch at the bank’s annual presentation of financial stability report was quoted by the Bloomberg (bold mine)[3]: “Signs of an excessive search for yield are particularly evident in the corporate-bond and syndicated-loan markets…The longer the period of low interest rates lasts, the greater the risk of exaggerations in certain market segments.”
Well, massive economic maladjustments and severe mispricing risks from zero bound have indeed become mainstream. They reinforce what I have been observed and have been pounding on the table here for quite sometime.
On a domestic perspective, Singapore’s central bank, the Monetary Authority of Singapore (MAS), this week conveyed of serious misgivings over the ballooning of the financial system’s debt, viz. corporate debt and household debt. According to the MAS, Singapore’s debt-to-gdp ratio has inflated to 78% in 2Q 2014 as against only 52% in 2Q 2008. Household debt-to-income has also bulged from 1.9x in 2008 to 2.3x in 2Q 2014.
The MAS is concerned that “an interest rate hike combined with an earnings shock could increase the number of financially distressed corporates and households,” and likewise frets over the still-elevated property prices and increasing cross-border banking exposure[4].
In short, the MAS validates on my theory of the politics of monetary easing policies: I recognize the problem of addiction but a withdrawal syndrome would even be more cataclysmic.
Yet the MAS can do something. They can choose to short circuit the credit cycle by nipping the bubble in the bud or they can keep inflating it until it snaps. Either way the bubble will burst.
The difference is who will do the job? Will the markets forcibly do it? Or will they do it? It’s a choice between current pain and a much larger and more agonizing unraveling overtime. That’s because the longer the wait, the bigger, the malinvestments.
It’s obvious that the MAS dreads the implosion of unproductive debt as revealed by their statement “an interest rate hike combined with an earnings shock could increase the number of financially distressed corporates and households”, yet paradoxically they claim that their banking system has been sound. Perhaps. Relatively. But inconsistency stands between official concerns and the declared resiliency of the system.
If the banking system has been truly sound, then “shocks” from financially distressed firms—from interest rate hikes or from allowing interest rates to be priced at market levels—can fully be absorbed by the banks without much turmoil. The test to real stability is the ability for the institutions to take on volatility. The proof of the pudding is in the eating.
Yet an ounce of prevention is better than a pound of cure. After all, banks took the gambit, so they should be held responsible for their portfolios. Taxpayers should play no role in the bank’s activities. For political purposes, the MAS may take shelter the depositors but should hold equity and bondholders liable. So why the sustained subsidies via zero bound?
Subsidies which has reduced if not eliminated the Profit and Loss discipline for such institutions based on the moral hazard only encourages risk taking. [Personally there should be no privatize gains and socialize losses]
Yet the MAS haven’t been alone with this ploy. Almost all central banks, including the Philippine BSP, will claim using a wall of statistics or stress tests of the “stability or soundness” of their banking system. However they have been mostly averse to raise interest rates.
Aside from the questionable stability, could it be that the recalcitrance towards altering or weaning away from zero bound policies has been the issue of chronic addiction to the privileges from political redistribution in favor political agents and their cronies?
ECB’s Draghi on Bubbles: Who Cares? QE Must Prevail; World Billionaires Dump Stocks, Hoard Cash
Such addiction to zero bound can be seen via the ECB’s declared policies.
The risks of bubbles will not stand in the way of the ECB determined to combust inflation.
The Reuters quotes ECB President Mario Draghi[5]: If we see that a certain real estate market or corporate bond market, for example, shows signs of having a bubble, would this be enough to justify a different monetary policy where we would raise interest rates, when the monetary policy stance based on considerations of price stability would not justify that? The answer is 'No'," Draghi said in Helsinki.
Stoking inflation is promoting price stability? Reducing purchasing power of consumers through arbitrary confiscation and redistribution to the elites produces wealth?
It is not clear if Mr. Draghi was emotionally responding to the Bundesbank’s warnings. The Bundesbank and Mr. Draghi have reportedly not been in good terms. The Bundesbank continues to oppose the ECB. ECB member and Bundesbank president Jens Weidmann early this week reemphasized that “monetary policy alone can’t create growth and must be based on higher productivity and policy reforms”[6]. And that was followed by Bundesbank VP Ms. Buch warnings. Mr. Weidmann also rejected clamors of stimulus for Germany after Mr. Draghi’s blasts against bubble warnings.
Yet bubbles equate not only to price fluctuations on asset prices but to financial system instability as well.
This simply means to ignore the risk from bubbles is to tolerate or even promote financial and economic dislocations. The ECB seems dogged determined “do whatever it takes” to proceed with QE, even if it means running the Eurozone economies to the ground. What a sign of desperation!!!
Yet these warnings have also a private sector component.
A global capital markets (lobby?) group, the International Capital Market Association (ICMA) composed of a broad range of capital market interests, e.g. investment banks, regional banks, asset managers et.al., predicted of a meltdown in global credit markets which they see as “inevitable” and where the only question is the timing and the catalyst for it.
Reasons? Regulations has resulted to a massive concentration of bond ownership and to far less liquidity for the global bond markets or a “combination of larger bond markets, with fewer, larger investment firms, and a weakened capacity for bank intermediation,” “largely fuelled by a wave of cheap central bank money and the unquenchable thirst for yield”…“all make for the perfect storm”[7].
Finally, while developed economy stock and bond markets have been at record or milestone highs, smart money appears to be seeking safehaven.
A poll covering veteran investors from United States, Europe, Britain and Japan have reportedly been dumping stocks, adding to bonds and importantly raising cash.
And a more interesting story has been of the actions of the world’s growing numbers of ultra-wealthy investors or new ultra high net worth (UHNW) with $30 million and above in assets. These financial elites have reportedly been not only shunning stocks and curiously even bonds! They are hoarding record cash due to perceived mounting uncertainties.
The CNBC quotes a UBS Wealth Management study[8] (bold mine): Nonetheless, Simon Smiles, chief investment officer at UBS Wealth Management, warned of the risks the wealthy few face. "This report finds that UHNW individuals hold nearly 25 percent -- an extremely high proportion – of their net worth in cash," he said in Wednesday's accompanying press release. Fearing that their millions are being eroded away with inflation, Smiles also said that holding government bonds from Germany and the U.S. is no longer safe. The return outlook for these fixed income assets is highly and negatively "asymmetric," he added.
This shows two things. First, that smart money has been playing increasingly defensive, and second, zero bound has made cash a worthy alternative.
Nonetheless has warning signals from political authorities been echoing the concerns of the financial elites? Or has this been the other way around?
Bipolar World: Record Stocks, Crashing Commodities
Bipolarity has enveloped global financial markets.
On the one hand we are seeing record stocks and bonds mostly in developed economies.
Financial Viagra has sent US stock market benchmarks to record highs, specifically the Dow Industrials, S&P, biotechs, transports, S&P Mid-caps…or at near record highs, e.g. Nasdaq, Russell 2000. German Dax also on a stunning vertical climb since the bottom of Mid-October closed the week at near the June record highs. Japan’s Nikkei has been fast approaching the May 2007 highs. The astounding 7.89% meltup in the Chinese Shanghai Composite index this week lifts the benchmark to a 3 year high. India’s sensex continues to post record after record highs.
Even more amazing has been the record low bond yields across Europe as seen by the 10 year yields of Germany, Italy, Austria, Belgium, Netherlands, Finland, France, Ireland Spain and Portugal.
Much of these low yields have been due to bond speculators whom have been front running the ECB. The latter has broadcasted their intention to include sovereign bonds as part of their asset purchasing program. So the ECB, functioning as the greater fool, will be buying grotesquely overpriced bonds from a few financial market participants. This would serve as a wonderful example of transferring of risks from private bond holders to the taxpayers. It would be a fantastic Christmas gift to the financial elites courtesy of Europe’s and most especially Germany’s taxpayers.
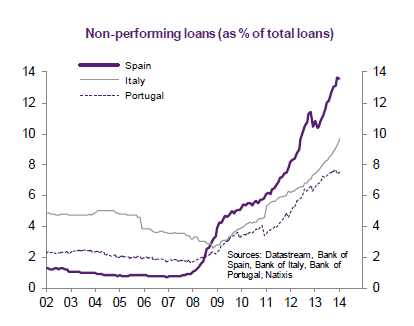
Remember much of Europe has been stagnating, which is why the ECB asset purchasing programs came into existence in the first place. To demonstrate the absurdity of bond pricing, 10 year yields of crisis afflicted Eurozone peripheries as Spain (1.9%) and Italy (2.03%), as of Friday, have even been vastly LOWER than the US (2.194%)! Italy, for instance, still has been stuck in a recession, as unemployment rates continues to ascend to record levels! Also non-performing loans of Italy, Spain and Portugal have been at its highest watermark since the millennium or even relative to the height of Europe’s financial crisis. Yet the region’s government debt (aside from world’s overall debt) has been one of the highest in the world. In short, bond speculators have totally been dismissed credit risks!
It’s simply incredible to see how financial markets have been entirely deformed from central bank policies.
Yet there has been a dark side, which has been ignored by the mainstream or has been rationalized as positive.
Yields of US 10 year treasuries are presently at levels when October ‘correction’ occurred. Ironically stocks remain on record highs. What has transformed such correlations?
Friday, as OPEC the deadlock persisted, oil prices crashed! West Texas Crude collapsed 10.18% and Europe’s Brent dived 9.77%! Friday’s meltdown compounded on the losses of oil prices for the week, specifically at 13.98% and 12.95% respectively!
Oil producing Norway’s all share index missed the region’s risk ON boat and instead got walloped by 7.13% this week.
GCC states, whose markets were closed during oil collapse, have already been drubbed due to prior oil price weakness. For the week, Saudi’s Tadawul plummeted 3.75%, UAE’s DFM sank 1.5%, Qatar’s Qatar Exchange plunged 3.72%, and Oman’s Muscat fell 2%.
This week, gold also got hit by 2.97%, silver by 6.46% and copper by 5.6% to its lowest level since 2010. The Bloomberg Commodity Index which incorporates 22 raw materials dropped as much as 2.3% to 114.8341, last Friday, the lowest since July 2009.
Some emerging market currencies had been clobbered. For the week, the Russian ruble dived 7.3% to a record low, Brazil’s real and the Mexican peso had been trounced by a similar 1.9%, the latter has been at the lowest level since 2012. The Colombian peso got hit by 3.2% so did Columbian stocks (the COLCAP index) which plummeted by 4.56%. In Asia, the Malaysian ringgit fell .83% to a five year low.
Over at the bond markets, Russian 10 year yields reportedly jumped 43 bps to 10.53%; civil war torn Ukraine 10 year equivalent soared 297 bps to a record 19.43% which according to Bloomberg was “the worst week on record”, while Greek 10 year yields surged 42 bps to defy the Eurozone’s record low rates[9].
Actions by the ECB-PBOC-BoJ have apparently failed to reflate global markets. To the contrary, market crashes are once again a real time phenomenon.
Collapsing Oil Prices Signify the Periphery-to-the-Core Bubble Dynamics
The entrenched consensus view has been inflation is good while deflation is bad. So they support central activism to promote inflation.
Now that oil prices have crashed, the consensus seems to have rediscovered that deflation hasn’t been bad after all. They have recently chimed to claim that low oil prices are good for the consumers. It’s a splendid example of cognitive dissonance or grasping at anything to justify the unsustainable speculative boom.
While indeed low prices should be good for the consumers, they didn’t explain why oil prices have been collapsing which now stands at 2009 levels in the first place. Has this been because of slowing demand (which ironically means diminishing consumption)? If so, why has there been a decline in consumption (which contradicts the premise)?
Or has this been because of excessive supply? Or a combination of both? Or has a meltdown in oil prices been a symptom of something else—deflating bubbles?
Consumption is derived mainly from income (which includes profits, rents, dividends, interests, and wages) from production and from savings, such that if the productive activities have been depressed or savings has been drained, then this will reflect on consumption that will also get manifested in the demand for oil.
OPEC has cut its forecast for both global economic growth and demand for oil.
Why? Obviously because economies like Japan-Eurozone and China have been floundering out of overcapacity, too much debt, or have been hobbled by balance sheet problems for political authorities to require and implement central bank interventions. So how will low oil prices improve demand?
Bluntly put, how can low oil prices overwhelm staggering burdens from a debt overload acquired to finance the previous booms?
This is not to deny of the marginal benefits that may accrue to the consumers, and even to the financial conditions of the non-energy industry but for the consensus to expect a consumption boom from low oil prices should signify a fairy tale.
Yet what is the impact to the energy producing sectors and nations how will they affect the world?
For oil producing states, as I have previously noted[10]: economies of these oil producing nations will see a sharp economic slowdown, the ensuing economic downturn will bring to the limelight public and private debt problems thereby magnifying credit risks (domestic and international), a downshift in the economy would mean growing fiscal deficits that will be reflected on their respective currencies where the former will be financed and the latter defended by the draining of foreign exchange reserves or from external borrowing and importantly prolonged low oil prices and expanded fiscal deficits would eventually extrapolate to increased incidences of Arab Springs or political turmoil.
Political turmoil should be expected for oil dependent welfare based political system which constitutes most oil producing nations.
The Zero Hedge estimates that Oil and gas exporting EMs account for 26% of total EM GDP and 21% of external bonds[11].
Well that’s not all. As pointed out above ex-oil commodities have also been slammed.
So to blame the problem on an OPEC stalemate would be misguided—OPEC doesn’t have control over other (non-oil) commodities. If the current predicament has been solely an oil dynamic then there would be no crashes in other commodities.
So the economic turbulence will extend to both commodity producers and exporters not limited to oil.
This suggests of a serious downturn in terms of EMs economic performance, as well as, the attendant prospective surge in credit risks for EM.
EM have been exposed to ballooning foreign currency debt where in the first nine months issuance posted $942 billion or just $162 billion off from last year’s $1 trillion mark according to Bloomberg[12]. Emerging Asia accounted for 84% of debt sold. And as previously explained, EM’s other fault lines has been in the concentration of Asset Under Management (AUM) and of their similar strategies as well as record Cross Border Lending based on BIS data[13].
Yet this represents part of the periphery to core feedback loop process between Emerging Markets and Developed Markets which I previously explained[14]:
If EM growth affects DM, so will there be a causal chain loop, or DM growth will also have an impact to EM growth!Doing so would extrapolate to a contagion process, as the slowdown feedback mechanism in both EM and DM will self-reinforce the path towards a global recession!
So with slowing economic growth along with debt burdens surfacing, those record global foreign exchange reserves will start coming down. And the decline in foreign reserves will translate to diminishing global liquidity that should pressure respective EM currencies as well as to imply monetary tightening of EM economies.
Thus the 2013 Taper Tantrum opened the Pandora’s box of debt deflation (bubble bust) where EM got the first taste via market turmoil and slowing economy of what is to come. This has been transmitted to DM via economic growth which has boomeranged on EM economies dependent on oil exports…first.
The contagion process will intensify and accelerate.
As a side note, I also pointed out earlier that it would be interesting to see how the collapsing oil prices will affect the US credit markets given that the energy sector’s share of high-yield bond markets has been estimated at 17.4%. How much of energy borrowings will mutate into bad debts? Will the troubles in the energy market spread to others?
Slowing EM and DM Growth Compounds on China’s $6.8 Trillion ‘Wasted’ Investments
With world economic growth to decelerate further, despite the interim rebounds from “stimulus”, just how for instance will China be able to cope up with her debt problems?
A study recently revealed how the Chinese government supposedly “wasted” $ 6.8 trillion of investments from 2009-2013 which accounts for “nearly half the total invested in the Chinese economy”.[15] Those wasted investments allegedly “went directly into industries such as steel and automobile production that received the most support from the government”. The authors say that “ultra-loose monetary policy, little or no oversight over government investment plans and distorted incentive structures for officials were largely to blame for the waste”. The author also blames corruption where Communist Party officials with direct responsibility for boosting growth through investments “stole” a significant portion of China's post-crisis stimulus.
In the recent years, much of these investments have been has been “funneled into real estate projects” where industries grew to feed them as steel, glass and cement, have been awash with overcapacity
One can argue with the top line (statistical) numbers but this would be irrelevant.
Yet the above account should serve as a great example of how zero bound compounded by government interventions misallocates resources. It’s not just losses from government spending but more importantly how a chain link of industries grew behind the boom. All these firms, which originally looked like productive enterprises during the boom, transformed into excess capacity when boom metastasized into a bust.
Now much of China’s “wasted” or “idle” resources are considered as sunk costs or consumed capital—because these have no economic use. Those resources would have to be significantly repriced for these to be reallocated to where consumer preferences are—that’s if markets are allowed to do the adjustments.
But spent capital on these resources had been financed, and they have financed by debt—from banks, shadow banks, domestic and external debt. So much of these debts would have to also be repriced for them to reflect on consumed capital also via the market process.
Such repricing process has already been ongoing. Rating companies have been reported to scoff at the PBOC’s rate cut since they would do little to prevent “worsening record debt downgrades”. A Bloomberg reports says that Chinese credit assessors slashed grades on 83 firms this year, already matching the record number in all of 2013”, and that in the first half of 2015 a huge 2.1 trillion yuan ($342 billion) would have to be raised to pay off creditors[16].
As I have been saying even at zero rates, if any entity would not have enough money to pay for the principal, then there would be a debt problem. Zero bound isn’t free lunch.
More importantly, this shows of the predicament of the Chinese political economy which comes from both external and internal developments.
In terms of internal factors, the real economy having been faced with excess capacity and onerous debt means that only a few resources have been left unencumbered and free for investments. Consequent to these has been that the Middle Kingdom’s real economic growth is headed for a meaningful decline, regardless of what government statistics say.
True the Chinese economy may benefit from lower commodity prices. But much of what the Chinese imported in the past accounted for as feedstock for bubble industries. Chinese gargantuan appetite for commodities has been previously predicated on a debt financed property boom, with the property sector deflating, demand for commodities has evidently followed suit.
So current collapsing commodity prices are likely more evidence of a deepening Chinese economic slowdown.
On the external side, with EM and DM bound for a slowdown, which likewise means pressure on Chinese exports, what will the Chinese government do? Will they devalue? But how about their massive foreign debt exposures?
Also about 63% of China’s overseas investments of $53 billion in 2013 have been in metals and energy sectors[17]. Crashing commodity prices may translate to more “wasted” investments.
For now the Chinese government has adapted the US Fed, Bank of Japan and the ECB’s formula for growth. Engineer a stock market boom by easing, (this week, the PBoC recently refrained from sterilizing by refusing repo sales) and by further promises to ease to generate the “wealth effect”—intended to support prices as discussed last week, to provide additional avenues for financial access for debt constrained firms to tap, and importantly to disguise her intensifying credit problems.
Actions in the Chinese stocks provide evidence that modern day stock markets are NOT driven by economic growth but by hope provided by political authorities through promises and accommodation of credit, liquidity provision and confidence.
Reversion to the Mean: Philippine 3Q Growth Rate Falls to 5.3%!
In contradiction to the deeply embedded popular opinion, Philippine statistical growth in 3Q 2014 decelerated to 5.3%.
This is interesting for me, because virtually NOT ONE from the mainstream experts as surveyed by Bloomberg[18] has seen this coming. Experts seem to have taken only one side of the trade. When everyone crowds into a single side of a small boat what happens? The boat capsizes. Such are the stuff which crises are made of.
Let me repeat a favorite quote from Harvard’s Ms. Carmen Reinhart and Mr. Kenneth Rogoff[19] (bold mine)
The essence of the this-time-is-different syndrome is simple. It is rooted in the firmly held belief that financial crisis is something that happens to other people in other countries at other times; crises do not happen here and now to us. We are doing things better, we are smarter, we have learned from past mistakes. The old rules of valuation no longer apply. The current boom, unlike the many previous booms that preceded catastrophic collapses (even in our country), is built on sound fundamentals, structural reforms, technological innovation, and good policy. Or so the story goes …
What the mainstream have overlooked is what I have warned about last June—based on two theories: reversion to the mean and the business cycle[20].
Let me add to my act as the unpopular spoiler of this boom…
If the laws of the regression/reversion to the mean will be followed (even without economic interpolation) then statistical economic growth will most likely surprise the mainstream NEGATIVELY as economic growth are south bound in the coming one or two years, with probable interim bounces.Another way to look at this is if history does rhyme, then it means a big, big, big disappointment for the consensus bearing exceptionally high expectations.Oh yes, the inflation (stagflation) story alone represents a huge headwind to real economic growth. Compounded with a bubble cycle, these twin lethal forces would fluidly dovetail with the reversion to the mean.
I noted that 1Q GDP 5.6% wasn’t anomaly but rather a statistical phenomenon known as reversion to the mean. Statisticians should know this.
Back then, experts rationalized the 1Q slowdown to Typhoon Yolanda. I pushed back.
I also chronicled how statistical outliers particularly large growth numbers eventually fell back significantly to establish historical averages.
.png)
I showed the past chart here. The above is the updated chart which includes the 3Q 2014 data. 3Q GDP seems fast approaching the mean. Trading Economics says that the average has been at 5.02%. Yet this doesn’t suggest that once the statistical GDP hits the “mean” it stops and rises again. What this implies is that statistical GDP will likely fall to levels where the historical average may be derived. This means statistical GDP at much lower than 5%.
This doesn’t suggest too that statistical GDP will fall in a straight line. Since hardly any trend goes in a straight line there will bounces as the chart above demonstrates. History does share some invaluable insights.
So I have also previously noted that the 2Q GDP of 6.4% represented such a bounce.
So why can’t there be a mean reversion? Because of the illusion of “this time is different”? Because statistical gazing mainstream experts say so? Because economics is about “Vox populi, Vox dei”? Because politicians and their favorite business people declare so? Because credit booms have vanquished basic economic laws for euphoria to last forever?
It’s funny but mainstream experts expected strong growth from consumers suffering from vastly reduced purchasing power due to the 9 month 30+% money supply growth which led to a sharp rise even in statistical official inflation. They probably expected robust growth in the industry, which for them, should have translated to wage growth or at least more formal work that would have offset inflation pressures.
And perhaps because these lucky highly paid ivory tower experts don’t feel the brunt and angst of shrinking purchasing power in the same way the minimum wage earners and those employed in the informal sectors (which comprises about half of the labor force) does, they simply ignored the man on the streets.
But the writing was clearly on the wall, surveys on self-rated poverty revealed such quandary for consumers. Libyan OFWs caught in the crossfire refused to return to their native land despite the boom due to “better chances of surviving”. In addition consumer price inflation had been elevated to a media and political sensation.
1 Household Growth Remains on a Downtrend
.png)
As measured by Household Final Consumption Expenditures (HFCE), resident household growth has been sharply decelerating since Q3 of 2013 or a year ago (left). That’s even before the 30% money growth fueled CPI surge in 1H 2014.
Declining growth rate of household consumption squares with the performance of retail trade (right). Retail trade has been in a slowdown since Q4 2013. 2Q-3Q posted marginal growth, but that’s after a big data revision in Q2. In general, this household measure of activity “Trade and repair of Motor Vehicles, Motor cycle, Personal and household goods” has been rangebound since Q2 2013.
From the household perspective, unless we see significant improvements, the current decline in household growth trend points to even more reduced statistical GDP overtime. In 3Q, household contributed to 68.3% of statistical GDP. There’s no Typhoon Yolanda to blame now and OFW remittances continue to grow strongly, so what’s been the hitch? Media blames it on government spending on construction which I say is a good thing.
And an even more troubling trend has been the divergence between household growth and the elaborate expansion plans by bubble industries. Such divergence will only lead to excess supply. Yet what makes them critical has been they have been funded by debt.
For now those expansions look very productive, wait until we see a reversal.
2 Investments Picked UP; Construction and Finance as 3Q Leaders
In my previous analysis of 2Q GDP I noted of the bizarre silence by the consensus in taking notice of the ‘contraction’ of investments. The NSCB even described it as “plunge”. I realized that for as long as the top line number met the mainstream expectations this wouldn’t be an issue.
Well it is important for me, why?
Because investments drive growth. Business spending represents future income, earnings, demand, consumption, jobs, wages, innovation, dividends, capital gains or what we call as growth.This also means that if the downturn in investments represents an emergent trend, then current rebound may just be temporary and would hardly account for as resumption to “high trajectory growth”.
.png)
In 3Q, key investment areas of construction, capital formation and durable goods broadly bounced. So this could be good news. If investments continue to recover then statistical GDP should bounce too. Question is where has investments been directed at?
A look at what I call the bubble sectors reveals that growth rates of trade, real estate and hotel output has steeply declined. It’s only the financial sector that has been markedly up. Additionally while I don’t consider manufacturing as generally bubble, there are sectors that have piggybacked on bubble industries. Yet manufacturing output has likewise sharply declined.
.png)
Construction activities from private sector rebounded strongly (left). This marks the third consecutive quarter of increase, with the 3Q providing the statistical 11.9% growth heft (right). Yet it’s a question whether the 3Q surge in private construction can be sustained.
For the real estate sector, both growth output plus banking loan growth seem to have slowed. This implies that the construction boom may have been due to private sector activities on government infrastructure or Public Private Partnership (PPP).
If I am right where construction boom has been in infrastructure projects then this explains the decline in public construction.
Yet for the consensus which sees government spending as growth omits the fact where government funds come from. While government spending translates to statistical growth, in the real economy extraction of funds from productive agents for social spending consumption activities whether welfare, infrastructure or military et.al., reduces growth. You cannot multiply wealth by dividing it. So the pullback in government spending should be positive for the real economy overtime.
Meanwhile the average banking system’s loan growth to the construction sector while still at an astounding 39.14% in 3Q has been decelerating compared to 41.05% in 2Q and 46.64% in 1Q. The declining but still extraordinarily high loan credit growth suggest of a slowdown but still strong pace of output construction for 4Q.
The GDP numbers by industry (right) only reveals a small part of the 3Q GDP story. Basically among the major contributors (share of sector contribution to GDP; fourth column from the right), 3Q GDP has been a story of construction and finance. Both sectors have been on the upside while the rest has turned lower. Yet both have been funded by strong credit activities. The share of bubble sectors (real estate, trade, hotel, construction and finance) to GDP has grown to 42.97% compared 42.22% last year. Again such is based on the outperformance of these two sectors which more than negated the declines of the others.
For financial intermediation, where has the activities been directed to? The stock market? Has the repeated index management via the ‘afternoon delight’ and ‘marking the close’ been part of the banking loan to statistical ‘growth’ output?
As a side note, I also find it pretty much peculiar for banking loans to the fishing industry soar ever since the second semester of 2013 where the average loan growth for 15 months (ending September 2014) has been 31.98% while for the credit growth for the first 9 months of the year has averaged 40.13%. Yet the fishing industry’s output for the past 4 consecutive quarters has been NEGATIVE (from Q413 to Q314 in %: -4.4, -3.1, -1.6 and -.4, respectively). Why the sustained pace of incredible increase in the banking sector’s loan portfolio to the fishing industry? Where has all the money been going? Why hasn’t there been a surge in NPLs here?
3 Why Statistical Growth Will Decline: Surging Credit Intensity!
.png)
And finally here is the main reason why mainstream’s growth expectations for sustained 6%-8% growth rate will be frustrated. The answer lies in the evolving spectacular disproportionate growth rates between banking loans and the statistical GDP.
I call this the diminishing returns of debt, while others call this ‘credit intensity’. The ratio’s usefulness is simple: how much credit growth has been used to produce every peso growth in output.
For instance, it took 3.68% growth in bank credit to generate 1% of statistical growth 3Q 2014 (see right window). The bubble sectors reveal of the remarkable credit intensity which implies of the increasing degree of leverage used.
In other words, those numbers tell us that the Philippine formal economy has been gorging increasingly humungous amount of debts that has been generating declining output.
Yet remember, given the low penetration level of the populace on the banking system, this implies two things: One) bank debt per capita, not applied to general populace but to the loan clients of the banking industry, should be exceedingly high and or, Two) there has been a concentration of leverage mainly to a few supply side companies.
Since debt represents the frontloading of spending, having too much debt or overleveraging is in and on itself a financial burden for the simple reason that cash flows from the future are uncertain. So if there is no margin for errors to deal with uncertainty, having too much debt can lead to insolvency.
And unless offset by income growth, overleveraging reduces the ability to spend or consume in the future. This applies whether debt/loan is commercial or consumer.
So current Philippine debt dynamics not only underwrites the lower than expected future economic growth, it also reveals of the extent of credit risks that has been building beneath the surface. This despite the wall of statistics erected by the government to ease the concerns of credit risk. In short, the sustained buildup of debt makes the Philippines vulnerable to a credit shock or credit event.
Yet just look at the opposite routes taken by banking loan growth and the statistical economic growth (left)
The lift off in banking sector loans in Q2 2013 seems almost like a hockey stick. Yet the ascent in bank loan growth comes as statistical GDP has been declining. Simply said debt goes up, growth goes down.
Soaring banking loans in Q2 2013 almost mirrors the money supply growth rate which rocketed on the 3Q of 2014.
.png)
However M3 and banking loan growth parted ways after in 2Q 2014. M3’s growth has collapsed even as the banking sector’s credit growth continues to swell at a fantastic rate.
Why hasn’t the fabulous bank credit growth rate been translated to M3? What happened to all those fresh spending power from credit expansion? What happened to ‘aggregate demand’? Has it been because much of the borrowed money today has been merely been used to pay off existing liabilities or debt in debt out?
You see, to ignore risk is to become blind to risk. Blindness leads to erroneous decisions.
[1] See Phisix: Global Markets Parties on BoJ, PBoC and ECB’s Steroids! November 24, 2014
[2] See ADB Warns (Again) on Rising Risks! November 25, 2014
[3] Bloomberg.com Bundesbank Says Low Interest Rates Spurring Some Risky Behavior November 25, 2014; See Bundesbank Warns of Excessive Risk Taking from Low Interest Rates November 27, 2014
[4] See Monetary Authority of Singapore Warns of Domestic Debt Bubble! November 28, 2014
[5] Reuters.com Risk of price bubbles won't stop ECB trying to revive inflation: Draghi November 27, 2014
[6] Wall Street Real Times Economic Blog, ECB’s Weidmann: Monetary Policy Alone Can’t Create Growth November 24, 2014
[7] Financial Times Traders’ credit market concerns grow November 25, 2014
[8] CNBC.com Rich hoard cash as their wealth reaches record high November 19, 2014
[9] Doug Noland The King of Dollar Pegs Credit Bubble Bulletin PrudentBear.com November 29, 2014
[10] See Crashing Oil Prices: OPEC Deadlock, Shale Bubble, Global Liquidity and Philippine OFWs November 28, 2014
[11] Zero Hedge How The Petrodollar Quietly Died, And Nobody Noticed November 3, 2014
[12] Bloomberg.com Emerging-Market Bond Sales Surge Over $900 Billion on Asia Deals October 1, 2014
[13] See Phisix: ASEAN Currencies Dive as the BIS, IMF, OECD Warns About Bubbles! September 22, 2014
[14] See Periphery to Core Dynamics: IMF Warns of Deepening Emerging Market Slowdown September 23, 2014
[15] Financial Times China has ‘wasted’ $6.8 trillion in investment, warn Beijing researchers CNBC.com November 27, 2014
[16] Bloomberg.com Record China Downgrades Test PBOC as More Defaults Seen November 28, 2014
[17] Wall Street Journal China's Global Mining Play Is Failing to Pan Out September 15, 2014
[18] See Hot: Reversion to the Mean? Philippine 3Q GDP Falls to 5.3%! November 27, 2014
[19] Carmen Reinhart and Kenneth Rogoff From Financial Crash to Debt Crisis Harvard University
[20] See Phisix: 30+% Money Supply Growth Rate Now Seen in Official CPI Data June 9, 2014
No comments:
Post a Comment