Showing posts with label Machlup-Livermore. Show all posts

Friday, January 13, 2012

US Equity Markets: Sectoral Rotation

I have been pointing out how asset markets have increasingly been driven by monetary factors, which leads to the interim relative price changes and eventually to tidal flows that in the end accounts for boom bust cycles or what I call the Machlup-Livermore paradigm.

Activities in the US equity markets seem to be following this pattern.

Here is last year’s performance by industry

clip_image001

Table from Money and Markets

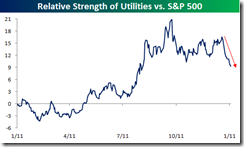
Now we seem to be seeing a rotation of leadership away from the previous leader, i.e Utilities.… [The following great charts from Bespoke Invest]

clip_image002

…to the laggards…

clip_image003

clip_image004

clip_image005

Wednesday, November 02, 2011

More Evidence of Tidal Flows in the US Stock Markets

Boom. Bust. Financial markets are being held hostage by politics and subjected to monetary tidal flows which can be seen in increasing correlations of price actions of US stocks.

clip_image001

Evidence from Bespoke,

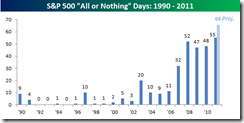
We consider all or nothing days in the market to be days where the net daily A/D reading in the S&P 500 exceeds plus or minus 400. With today's current net A/D reading of -460, there have now been 55 all or nothing days for the S&P 500 in 2011. At this rate, 2011 is now on pace to see 66 all or nothing days, which is well above the prior high of 52 back in 2008.

In the 66 trading days since the start of August, more than half (35) have now been all or nothing days. As we noted last week, the number of occurrences that we have seen in the last three months eclipses the total number of all or nothing days that we saw from 1990 through 2001 (34).

Again because of the politicized nature of the financial markets, price actions can go extremely volatile either way.

clip_image003

It would signify a reckless assumption that the prevailing risk environment can be traded short term.

The highly fluid turn of events that brings about an aura of heightened uncertainty appears to enhance the risks of rapid deterioration of events which could be vented on the marketplace beyond anyone’s expectations.

This should apply to the Philippine markets as well.

Where the extreme gyrations of the financial markets reflect on casino like odds, I’d rather play cards.

Wednesday, October 05, 2011

Reported Bailout of Belgium’s Dexia Spurs a fantastic US Equity Market Comeback

Another day, another sharply volatile markets.

clip_image001

US equity markets made another spectacular comeback.

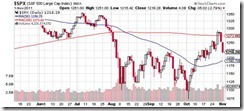
The actions of the US S&P exhibits the amazing turnaround today. Down by over 2%, the major US bellwether hit the bear market threshold then sharply recovered during the last hour to make a dramatic 4.1% swing as shown in the above chart from stockcharts.com.

The reported trigger: another bank bailout in the Eurozone.

This from Bloomberg (bold emphasis mine)

U.S. stocks rallied, driving the Standard & Poor’s 500 Index up 4.1 percent in the final 50 minutes, amid speculation European Union officials are examining how to recapitalize the region’s banks. Treasuries fell and the euro rallied.

The S&P 500 surged 2.3 percent to 1,123.95 at 4 p.m. New York time, sparing the benchmark measure of U.S. equities its first bear market, or 20 percent retreat from a peak, since 2009. Yields on Treasury 10-year notes climbed 6 basis points to 1.82 percent. The euro appreciated 1.1 percent to $1.3322. Futures on Germany’s DAX Index pared their loss to 1 percent from 4.9 percent.

Equities rebounded after the S&P 500 fell below 1,090.89, the closing level required to give the index a 20 percent slump from the three-year high reached on April 29. Stocks rose after the Financial Times quoted Olli Rehn, European commissioner for economic affairs, as saying there is an “increasingly shared view” that the region needs a coordinated approach to halt the sovereign debt crisis. After U.S. markets closed, Belgian Prime Minister Yves Leterme said a “bad bank” to hold Dexia SA (DEXB)’s troubled assets will be set up.

It is important to note that US municipal bond markets (state, cities and etc.) has significant but dwindling exposure to Dexia, from previously $54 billion to the current $9.6 billion (Reuters). Thus, the reported bailout sent US financial stocks leading the way for the fiery rally in the broader equity markets.

To add, the US Federal Reserve has a big loan exposure on Dexia in 2008, which most likely postulates that the Fed will be part of the rescue package.

From the telegraph

At the height of the financial meltdown, on October 24, 2008, Dexia's New York branch was used to borrow $31.5bn (£19.6bn). The total borrowing from all banks during that week climbed to $111bn, according to lending data released by the central bank on Thursday.

This serves as another evidence manifesting how financial markets have become deeply dependent on government bailout or steroids.

Importantly, that the heightened volatility in the markets have been due to the whack a mole strategy applied by policymakers on bank rescues. Remember, this is just one of the many banks that would 'require' bailouts.

Lastly, the exposure by the US Federal Reserve and US banks to Europe’s imploding banking system only means that team Bernanke will be reengaged in his helicopter option soon

Thursday, September 29, 2011

US Equity Markets: More Signs of Tidal Flows

Anyone who argues that stock market valuations have been about contemporary fundamentals should see this.

clip_image001

The market breadth of the US S&P 500 has increasingly been either about floating or sinking ships from tidal flows.

This great observation from Bespoke Invest, (chart above from Bespoke)

We consider 'all or nothing' days in the market to be days where the net daily A/D reading in the S&P 500 exceeds plus or minus 400. With today's A/D reading of -470, there have now been 42 'all or nothing' days for the S&P 500. At this rate, 2011 is now on pace to see 57 all or nothing days, which would eclipse the record high reading we saw back in 2008.

The most shocking development of late is how common 'all or nothing days' have become. Up until a few years ago, these types of days were pretty rare, but in the 42 trading days since the start of August, more than half of them (22) have been 'all or nothing'.

This exhibits how US and global equity markets have been massively distorted by sundry government interventions, such that intense ebbs and flows into the marketplace are increasingly manifestations of internal boom bust cycles at work.

So sharp market volatility on both directions should be expected or has become the 'new normal'. This makes stock markets seem more like a gamble, since steep gyrations encourage short term actions rather than long term investments. Yet the above dynamic basically tilts the benefits to those whom are proximate or personally close to policymakers at the expense of the public.

Again, such skewness is courtesy of the politicization of the financial markets by political stewards led by Mr. Bernanke et. al.

Thursday, September 22, 2011

Bernanke Jilts Markets on Steroids, Suffers Violent Withdrawal Symptoms

Despite my current circumstances, I felt the compulsion to offer a reaction on today’s market meltdown.

Here is what I recently wrote,

I would certainly watch the US Federal Reserve’s announcement and the ensuing market response.

If team Bernake will commence on a third series of QE (dependent on the size) or a cut in the interest rate on excess reserves (IOER), I would be aggressively bullish with the equity markets, not because of conventional fundamentals, but because massive doses of money injections will have to flow somewhere. Equity markets—particulary in Asia and the commodity markets will likely be major beneficiaries.

As a caveat, with markets being sustained by policy steroids, expect sharp volatilities in both directions.

Obviously the market’s response on team Bernanke’s failure to deliver on what had been expected has apparently been violent.

clip_image003

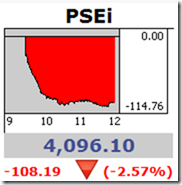
The Philippine Phisix (chart from technistock.net), as well as ASEAN equity markets, has basically suffered the same degree of bloodbath relative to her developed economy equity market peers

clip_image004

This reaction from a market participant captures the underlying sentiment. From a Bloomberg article

“This is not likely to provide any significant stimulus,” said Jason Schenker, president of Prestige Economics LLC in Austin, Texas. “The market really needed a boost of confidence. There is no confidence from this.”

So what did the Mr. Bernanke deliver?

Again from the same article at Bloomberg

The Federal Reserve will replace $400 billion of short-term debt in its portfolio with longer- term Treasuries in an effort to reduce borrowing costs further and counter rising risks of a recession.

The central bank will buy securities with maturities of six to 30 years through June while selling an equal amount of debt maturing in three years or less, the Federal Open Market Committee said today in Washington after a two-day meeting. The action “should put downward pressure on longer-term interest rates and help make broader financial conditions more accommodative,” the FOMC said.

Chairman Ben S. Bernanke expanded use of unconventional monetary tools for a second straight meeting after job gains stalled and the government lowered its estimate of second- quarter growth. Yields on 30-year Treasuries fell below 3 percent for the first time since 2009 and U.S. stocks had their biggest drop in a month on the Fed’s plan, dubbed “Operation Twist” after a similar Fed action in 1961.

The twist, as earlier stated, has been telegraphed. What was not expected has been the non-appearance of Bernanke’s QE which resulted to today’s convulsions.

The ‘twist’ which essentially attempts to flatten the yield curve basically reduces the banking system’s profitability from the borrow short and lend long (maturity transformation) platform that has partly catalyzed these selloffs.

From the Wall Street Journal

But for bankers, who are already struggling with low interest rates on loans and tepid loan demand, the twist option could further dent already-weakened profits. That is because lower long-term interest rates would result in contracting net interest margins for banks—essentially, the profit margin in the lending business—at a time when their revenue is growing slowly, if at all. Banks would earn less on loans and investments, and might end up making fewer loans as well.

"Ouch" is how one executive at a big retail bank described the prospect of Operation Twist. (Bankers typically don't publicly comment on Fed policy given the central bank's role as a bank regulator.)

Austrian Economist Bob Wenzel says that Operation Twist represents a failed experiment

So how did the original Operation Twist turn out? Three Federal Reserve economists in 2004 completed a study which, in part, examined the 1960's Operation Twist. Their conclusion (My bold):

“A second well-known historical episode involving the attempted manipulation of the term structure was so-called Operation Twist. Launched in early 1961 by the incoming Kennedy Administration, Operation Twist was intended to raise short-term rates (thereby promoting capital inflows and supporting the dollar) while lowering, or at least not raising, long-term rates. (Modigliani and Sutch 1966).... The two main actions of Operation Twist were the use of Federal Reserve open market operations and Treasury debt management operations.. Operation Twist is widely viewed today as having been a failure, largely due to classic work by Modigliani and Sutch.”

The economists go on to state that the size of Operation Twist was relatively small, possibly too small to determine if such an operation could be successful if carried out at on a larger scale. That experiment is now being conducted on the economy of the United States with the $400 billion Operation Twist announced today. How big was the original Operation Twist? $8.8 billion.

The three Fed economists, who seem to concur that the first Operation Twist was a failure, are sure going to get an experiment on the United States economy on a much grander scale to see if this time it will work different than it did the first time. So who are these three lucky Fed economists who are now going to be able to witness Operation Twist on a grander scale? Vincent R. Reinhart, Brian P. Sack and BEN S. BERNANKE.

So part of the market’s virulent reaction signifies a revolt on Bernanke’s experimental policy. This is an example of how interventionist measures prompts for heightened uncertainties.

The Fed also promised to support mortgage markets by keeping the interest low. Again from the same Bloomberg article,

The central bank said today it will also reinvest maturing housing debt into mortgage-backed securities instead of Treasuries “to help support conditions in mortgage markets.”

Yields on Fannie Mae and Freddie Mac mortgage securities that guide U.S. home-loan rates tumbled the most in more than two years relative to Treasuries. The average rate on a typical 30-year fixed loan fell to a record low 4.09 percent last week.

So why has Bernanke failed to live up with the expectations for more QE?

Like in the Eurozone, there has been mounting opposition to Bernanke’s inflationist bailout policies as seen by a divided FOMC… (same Bloomberg article)

The FOMC vote was 7-3. Dallas Fed President Richard Fisher, Minneapolis Fed President Narayana Kocherlakota and Charles Plosser of the Philadelphia Fed voted against the FOMC decision for a second consecutive meeting. They “did not support additional policy accommodation at this time,” the Fed statement said today.

…and from some Republicans who mostly recently who made public representations against further QEs.

Republican lawmakers including Boehner and Senate Minority Leader Mitch McConnell urged Bernanke in a letter this week to refrain from additional monetary easing to avoid “further harm” to the economy.

This is aside from political pressures applied by his predecessor, Paul Volker

In my view, Chairman Ben Bernanke could be:

-trying to lay the blame of policy restraints at the foot of his opponents in the recognition that markets would behave viciously from a stimulus dependent ‘withdrawal syndrome’, or

-that his penchant for grand experiments made him deliberately withhold QE to see how the markets would respond to his innovative ‘delusion of grandeur’ measures.

By withdrawal, I don’t mean a reduction of the Fed’s balance sheet, which the Fed aims to maintain (which probably would incrementally expand on a less evident scale) but from further specifically targeted asset purchases. The ‘twist’ essentially sterilizes the operation which means no money supply growth.

Today’s brutal reaction in global financial markets essentially validates my view that the contemporaneous market has been built on boom bust policies such that NOT even gold prices has been spared.

clip_image005

The tight correlations in the collapsing prices of equities and commodities as well as the rising dollar (falling global currencies) are manifestations of a bust process at work.

The primary issue here is that in absence of government’s backing via assorted stimulus, mostly via monetary injections, artificially established price structures from government stimulus or from credit expansion unravels.

Only when the tide goes out, to paraphrase Warren Buffett, do we know who has been swimming naked.

Or as Austrian economist George Reisman writes,

A fundamental fact is that our present monetary system is characterized both by irredeemable paper money, i.e., fiat money, and by credit expansion. There is no limit to the quantity of fiat money that can be created. This is the foundation for potentially limitless inflation and the ultimate destruction of the paper money, when the point is reached that it loses value so fast that no one will accept it any longer. The fact that our monetary system is also characterized by credit expansion is what creates the potential for massive deflation — for deflation to the point of wiping out the far greater part of the money supply, which in the conditions of the last centuries has been brought into existence through the mechanism of credit expansion

Saturday, September 10, 2011

More Evidence of Boom Bust Cycles Driving Equity Market Prices

I have repeatedly been saying that inflationism or the boom bust cycle or my Machlup-Livermore paradigm, have signified as the key force in determining equity prices around the world (Philippines included).

The Financial Times observes of the same pattern taking hold in the US stock markets, (bold highlights mine)

The correlation between the movement of big US stocks is at the highest level since Black Monday in 1987, with price moves increasingly driven by the ebb and flow of investors’ fears over the economic environment.

Stocks, in theory, should move in individual directions based on company fundamentals. But markets of late have been characterised by mass selling alternating with waves of buying, as investors upgrade or downgrade the risk of the US slipping into recession, or a financial crisis sparked by a European sovereign default.

The correlation between the biggest 250 stocks in the S&P 500 over the past month has reached its highest since 1987 this week, at 81 per cent, according to JPMorgan figures.

This means those stocks move in the same direction 81 per cent of the time. The historical average is 30 per cent. The measure peaked at 88 per cent during the October 1987 US crash, when the Dow Jones Industrial Average fell 22 per cent in one session.

Other spikes in correlation, including the collapse of Lehman and the Japanese earthquake, peaked at about 70 per cent but quickly fell away.

The unusually high level of correlation this month has raised speculation that markets could repeat the aftermath in 1987, when relationships between stocks did not return to their historical norm until several months later, in March 1988.

With intensifying government intrusions in the marketplace everywhere, one should expect the financial markets to behave in tidal flows or in undulating motions with high or tight correlations, especially during steeply volatile days.

Yet such insights have not been covered within the ambit of conventional analysis, which is why most will find today’s environment bewildering.

Thinking out of the box is required to navigate today’s increasingly distorted marketplace.

Wednesday, August 24, 2011

Sensing Steroids, US Equity Markets Sharply Rebounds

Last night the US equity markets made a substantial move

image

Here’s how the mainstream sees it. This from Bloomberg, (bold emphasis)

U.S. stocks rallied, driving the Standard & Poor’s 500 Index up from the cheapest valuations since 2009, as weaker-than-estimated economic data reinforced optimism the Federal Reserve will act to spur growth.

Monsanto Co. (MON), Chevron Corp. (CVX) and Microsoft Corp. (MSFT) added at least 3 percent, pacing gains in companies most-tied to the economy. The Morgan Stanley Cyclical Index rose 2.9 percent, breaking a five-day losing streak. Sprint Nextel Corp. (S) jumped 10 percent, the most since May 2010, after the Wall Street Journal said it will start selling Apple Inc.’s iPhone. Financial shares reversed losses after the Federal Deposit Insurance Corp.’s list of “problem” banks shrank for the first time since 2006.

I have talked about this earlier here

This only shows that current behavior of stock markets

-has hardly been driven by earnings but by politics,

-have been artificially boosted

-reacts like Pavlov’s Dogs, and

-importantly like addicts, has totally become dependent on steroids.

Never mind if recent reports say that stimulus money ends up going to the coffers of the rent-seekers, as graph of the bailout money by the US Federal Reserve in 2008 shows

clip_image002

From Bloomberg interactive

The important thing is to have the Fed print money to pacify Wall Street insiders, who constitute part of the cartelized incumbent political system.

Profit from folly.

Sunday, August 21, 2011

Applying Emotional Intelligence to the Boom Bust Cycle

One of the myths perpetuated by those who can’t explain the behavior of markets is to resort to the “emotions” fallacy.

A good example as I pointed out is this comment[1]

Hong Kong financial official K.C. Chan urged investors to “stay calm” and not be “spooked by the market”

These people are mistaking effects as the cause. Markets don’t spook people. That’s because markets are essentially people and market price signals represents the collective actions of people. People react to markets out of certain stimulus or incentive. People don’t get euphoric or frightened for no reason.

A good example can be seen below

clip_image002

A fight or flight response by our brain is always result of a stimulus or incentive to act or react.

As I earlier wrote[2],

When uncertainties or the prospect of peril emerges, our brain’s amygdala responds by impelling us either to fight or to take flight. That’s because our brain has been hardwired from our ancestor’s desire for survival—they didn’t want to be the next meal for predators in the wild.

Applied to the present state of the markets, the legacy of our ancestor’s base instincts still remains with us.

So when people’s collective action results to a stock market crash, that’s because there has been an underlying uncertainty or imbalance which these participants see as having “baneful” impact to their portfolio holdings. Such stimulus or incentives triggers the amydgala’s fight or flight response even on the marketplace.

Hence if crashing markets are seen as an ephemeral episode unsupported by fundamentals then many buyers are likely to step in and put a floor to the prices. People who say that markets have been “irrational” or “emotional” are only appealing to their interventionist intuitions.

clip_image004

Yet if crashing markets are seen as fundamentally driven, then the crash dynamic will continue. Interventions such as the recent ban on short sales will fail[3] which 4 European nations recently applied to bank and financial issues[4].

Differentiating Short and Long Term

In addition, one cannot coherently argue that the long term outcome of markets is rational while short term outcomes are emotive (or irrational). To apply this to Warren Buffets’ celebrated commentary,

In the short run, the market is a voting machine but in the long run it is a weighing machine.

Every action by individuals contains elements of emotion. That’s because our actions are always designed to replace the current state of uneasiness. Content or discontent signify as emotional states. Emotions are simply part of individual actions. Thus seen in a collective sense, markets are always ‘emotional’ even during ‘normal’ days. Perhaps it is only in the degree where the nuances can be made.

To add, since the long run represents the cumulative effects of short run actions, there has to be a smoothing out effect for the long run actions to dominate.

Applied to Mr. Buffetts’ axiom, for the weighing machine effect to prevail over the long run, the series of short term ‘weighing machine’ dynamics has to dominate the series of short term ‘voting machine’ actions. Or the probability of distribution has to skew towards forces of the weighing machine dynamic otherwise the voting machine effect will takeover.

Boom Bust Cycles Have Real Effects

The state of the US markets appears to be revealing on such symptoms, a nice illustration can be seen in the chart below.

clip_image006

US markets have become nearly an “all or nothing” pattern, where market breadth reveals that stock prices in general either floats or sinks in near simultaneously during volatile days.

As Bespoke writes[5], (bold emphasis mine)

Whenever the market has a day where the net advance/decline (A/D) reading of the S&P 500 is greater than 400 or less then negative 400, we call it an 'all or nothing' day. During the credit crisis, all or nothing days were incredibly common. In 2008, we saw a peak of 52 all or nothing days, which works out to an average of about one per week. Since then, we have seen a decrease in the number of all or nothing days, but they still remain elevated.

So far this year there have been 27 all or nothing days, which works out to a still elevated annualized rate of 43. At this time just last month, there had only been 17 all or nothing days this year, which at an annualized rate of 31 would have been the lowest level since 2007. Back then, many investors were hoping that the market was finally returning to pre-crisis levels of normalcy.

As one would note from the above, current markets have hardly been about earnings, as cluster based movements represent as the NEW normal where markets have been latched to political actions more than from market forces as dogmatically embraced by mainstream.

In short, this exhibits more evidence of the increasing dependency of the S&P 500 to political interventions as a major force in influencing equity prices.

As the great Murray N. Rothbard wrote[6],

In the purely free and unhampered market, there will be no cluster of errors, since trained entrepreneurs will not all make errors at the same time. The "boom-bust" cycle is generated by monetary intervention in the market, specifically bank credit expansion to business.

Remember, boom bust policies impacts not only the financial markets but has real impact to the economy. Through the manipulation of interest rates, patterns of consumption and savings and investment, wages, relative price levels at every stages of production, capital structure, earnings, and etc., are directed away from consumers preferences and rechanneled into stages of capital goods sector where politically directed actions would now signify as distortion of prices, miscoordination of resources or as malinvestments which eventually would have to be liquidated.

Again Mr Rothbard,

If this were the effect of a genuine fall in time preferences and an increase in saving, all would be well and good, and the new lengthened structure of production could be indefinitely sustained. But this shift is the product of bank credit expansion. Soon the new money percolates downward from the business borrowers to the factors of production: in wages, rents, interest. Now, unless time preferences have changed, and there is no reason to think that they have, people will rush to spend the higher incomes in the old consumption-investment proportions. In short, people will rush to reestablish the old proportions, and demand will shift back from the higher to the lower orders. Capital goods industries will find that their investments have been in error: that what they thought profitable really fails for lack of demand by their entrepreneurial customers. Higher orders of production have turned out to be wasteful, and the malinvestment must be liquidated.

Today’s market environment has accounted for as the continuing saga of the 2008 liquidation phase which has been constantly delayed, deferred and partly absorbed by government through sundry interventions and systemic inflationism designed to save the fragile, broken and unsustainable system.

And the effects of the gamut of political interventionism has been manifesting into the actions of equity markets.

Everybody can wish for the old days, but prudent investors would need to face up with reality or take the consequences of ideological folly.


[1] See Japan's Minister Calls for More Inflationism to Stem Global Market Crash, August 19, 2011

[2] See Managing Risk and Uncertainty With Emotional Intelligence, March 20, 2011

[3] Bespoke Invest, A Rough Week For European Banks, August 19, 2011

[4] See War against Short Selling: France, Spain, Italy, Belgium Ban Short Sales August 12, 2011

[5] Bespoke Invest, 'All or Nothing' Days on the Rise, August 16, 2011

[6] Rothbard, Murray N. The Positive Theory of the Cycle, Chapter 1 America’s Great Depression

Saturday, August 06, 2011

Graphic: Tidal Flows Even in US Equity Markets

The financial markets have not been driven by inflation?

Great chart from Bespoke Invest

clip_image002

How does one explain the synchronous movement as measured by the % of stocks above 50-day moving averages representing the market breadth of the US S&P 500? Except for the remaining 4%, all issues in the S&P 500 basket are in the morass.

In short, the above is another representation of rising and sinking tides.

see more charts of specific sectors here

So what happened to earnings?

image

chart also from Bespoke Invest

Where is the connection which shows earnings drive equity prices?

Sunday, July 31, 2011

Phisix and the Inflationary Boom

A continual rise of stock prices cannot be explained by improved conditions of production or by increased voluntary savings, but only by an inflationary credit supply. Fritz Machlup

The Phisix has been creeping higher posting 5 consecutive weeks of incremental gains.

Year-to-date, the Phisix has accrued a nominal local currency based return of 7.2%. Since the Peso has been up by about 3.8% over the same period, a US dollar invested in the local equity market would see gains of over 10% gross and a real (inflation adjusted gain) of 5.4%, based on the latest inflation figure at 4.6%[1].

For local investors real Peso returns would translate to 2.5%.

While some signs for a possible profit taking correction may have surfaced due to the succession of winning streaks, in bullmarkets extended runs are a commonplace.

Yet momentum indicators suggest either a sectoral rotation as major issues consolidate or a continued upswing over the coming sessions.

Along with a briskly Phisix, the Philippine Peso has also shown persistent vigor to reflect on the strength of Asian currencies.

clip_image002[4]

A strong Peso (above window), which is a sign of relatively stronger demand for Peso assets, is hardly a harbinger of a looming major correction.

Again the Peso’s rise is being reflected on similarly buoyant basket of Asian currencies—the Bloomberg JP Morgan Dollar Index (ADXY-lower window).

Over the recent weeks, I have been saying that the Property[2] and Financial[3] sectors could take the market’s leadership from the overheated mining sector.

As I wrote[4] last week,

And part of this phenomenon could highlight a rotation away from the mining sector and into the other laggards, perhaps to the finance and the property sector as the next major beneficiaries of the percolating inflation driven boom as previously discussed.

Well lady luck appears to be smiling anew on us as this outlook appears to have been partially validated this week.

clip_image004[4]

Both the property and the financial sectors took 1st and 2nd spot ahead of this year’s uncontested market leader, the mining sector.

Except for the Industrial Sector, the gains of the Phisix has clearly been lifted by these two resurgent industries.

From the above, it would seem that we are on a roll, as the local markets have been unfolding exactly in accordance to our prognosis.

clip_image006[4]

Yet I am seeing additional evidence of a business cycle boom phase.

The chart above from ADB[5] shows that (except for China) property prices in the ASEAN region have been on an incremental rebound and appears to have been partly fueled by circulation or bank credit.

So the region does not only show similarities in movements in equity prices but likewise in the bank credit growth and correspondingly in housing prices. The general directions have been synchronized, except for the scale.

From this perspective, I expect that the gap filling phase or a “reversion to the mean” dynamic of the property-finance tandem to remain in play as a real property boom will be financed by mostly the banking sector, given the limited options of the underdeveloped domestic capital markets.

This is one major sign of an inflation driven boom.

Another sign can be seen over at the broad market in the Philippine Stock Exchange.

The bullish sentiment has rampantly been spreading as more issues have caught the market’s attention.

clip_image008[4]

While the average daily traded issues (computed on a weekly basis) has recently declined, the extraordinary breadth suggests that even third tier (non-liquid) issues are being revived with pizzazz.

clip_image010[4]

Two examples:

Holding company Zeus Holding Inc. [PSE: ZHI; upper window] skyrocketed by a breathtaking 400+% in just two weeks!

Also Basic Petroleum Corporation [PSE: BSC] zoomed by stupendous 69% over the week!

[disclosure: I don’t own any of the above]

Both issues has trailed the Phisix or has basically missed the two year upside.

To analogize, these issues signify as latecomers to the party but have come crashing into the shindig in a grand entrance. To wit, the lapse in time and scale has been compensated by the recent bouts of explosive upside actions.

Yet we have seen many similar issues go ballistic, mostly piggybacking on Merger and Acquisition rumors, or joint ventures, or other forms of rationalization.

As I pointed out in September 2010[6],

As the growing conviction phase of the bubble cycle deepens, as represented by the recent buyside calls of “Golden Era”, one should expect to see heightened volatility in market actions which means more frequent explosive moves.

Yet in defying conventional wisdom, many are flummoxed by these events. As I wrote at the start of the year[7]

while the mainstream will continue to blabber about economic growth, corporate valuations or chart technicals, what truly drives asset prices will be no less than the policies of inflationism here and abroad that leads to cyclical boom and bust in parts of the world including the Philippines.

Current market actions have only been vividly confirming this ongoing inflationary boom, where too much money has been chasing returns.

Again what mainstream hardly can comprehend or explain, paradoxically is a dynamic which I have been predicting ever since.

Understanding how the market process works is key. Living on a mythical self-imposed sense of reality won’t help[8]. In fact, it can be disastrous.

Bottom line:

Every time the Phisix attains new highs, we should expect high octane performances even from peripheral or formerly illiquid issues as money rotates from issues which has earlier outperformed to issues that have lagged and vice versa, a feedback mechanism that would result to broad market price increases. In short inflation boosted relative price actions eventually end up as general price increase.

In other words, a rising tide will lift most, if not ALL, boats.

This is my Machlup-Livermore paradigm[9].

The Phisix has simply been demonstrating how an inflationary boom works, which should also serve as an example of how inflated money works through the economy (but is more complex)


[1] Reuters.com Philippine annual inflation at 4.6 pct in June, July 4, 2011

[2] See Expect a Rebound from the Lagging Philippine Property Sector, July 17, 2011

[3] See A Bullish Financial Sector Equals A Bullish Phisix?, May 22, 2011

[4] See Confirmation of the Phisix Breakout!, July 24, 2011

[5] ADB.org, Asian Economic Monitor July 2011

[6] See Philippine Phisix In A Historic Breakaway Run! September 12, 2011

[7] See The Phisix And The Boom Bust Cycle, January 10, 2011

[8] See Quote of the Day: Living Out of a Myth, July 29, 2011

[9] See Are Stock Market Prices Driven By Earnings or Inflation? January 25, 2009

Thursday, July 07, 2011

US Equity Markets: Signs of the Rising Tide Phenomenon

I’ve long been saying that pricing of equities are being influenced more by the inflationism (boom bust cycles) rather than the deep-seated conventional notion of discounted cash flows or other traditional metrics.

Even in the US we seem to be observing the “rising tide phenomenon” affecting the price actions of their equity markets, similar to the Philippines.

The recent rally in the US has been broad based and manifested across all sectors.

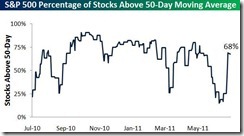
clip_image002

As Bespoke Invest notes, (chart theirs)

At the moment, 68% of stocks in the S&P 500 are trading above their 50-day moving averages. It's a strong breadth number, but it's still below the levels seen at prior short-term market highs over the past year.

Also Bespoke sees that the US rally has been supported by strong market internals

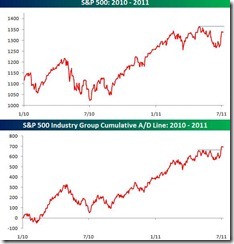
clip_image004

Bespoke observes, (bold emphasis mine, chart above theirs)

Last week's strength of group breadth was also notable given the fact that all 24 groups finished the day in positive territory on four different days. Looking back at data over the last ten years, we found that there has never been a period where all 24 groups were up on the day in four out of five trading days. In fact, prior to last week, there was never a period where all 24 groups were up on the day in even three out of five trading days.

This reminds me of Edwin Lefevre’s investment classic “The Reminiscences of a Stock Operator” where he quotes the legendary trader Jesse Livermore, (emphasis mine)

Nowhere does history indulge in repetitions so often or so uniformly as in Wall Street. When you read contemporary accounts of booms or panics the one thing that strikes you most forcibly is how little either stock speculation or stock speculators today differ from yesterday. The game does not change and neither does human nature.

Thursday, June 02, 2011

Chart of the Day: Earnings Don’t Drive Stock Prices

I’ve been arguing since that earnings have hardly been the principal drivers of stock prices.

Today’s Bloomberg’s chart of the day appears to bolster my case. And this time such dynamic applies to the S&P 500

clip_image002

Here’s a passage from the Bloomberg article,

Stocks with the most reliable earnings are underperforming those with the least predictable results by the most since at least 1997 and may soon start to outperform, Morgan Stanley Investment Management said.

The CHART OF THE DAY compares the performance of so-called high-quality companies on the Standard & Poor’s 500 Index with low-quality businesses. S&P awards all equities a quality rating based on the sustainability and robustness of both their earnings and their balance sheets.

“Despite all the uncertainty in the market, quality is very cheap at the moment,” said Bruno Paulson, the portfolio manager of MSIM’s global franchise strategy, which has $6.3 billion under management, in London. “It’s not unreasonable to expect some re-rating from here. I don’t know what will trigger it; it might be the end of liquidity.”

So the quoted expert partly attributes ‘liquidity’ to this phenomenon but sounds rather tentative. I would suggest that this represents the mainstream view (again I am applying representative bias here) where the mainstream don’t get it.

Inflationism has been the main culprit. Flooding the world with too much money leads to speculative excess. This amounts to the bidding up of prices of low quality stocks more than the high quality counterparts. When people chase prices, rumor based plays are rife and earnings become a side story.

I would like to reiterate Austrian economist Fritz Machlup’s dictum (bold highlights mine)

If it were not for the elasticity of bank credit, which has often been regarded as such a good thing, a boom in security values could not last for any length of time. In the absence of inflationary credit the funds available for lending to the public for security purchases would soon be exhausted, since even a large supply is ultimately limited. The supply of funds derived solely from current new savings and amortization current amortization allowances is fairly inelastic, and optimism about the development of security prices, inelastic would promptly lead to a "tightening" on the credit market, and the cessation of speculation "for the rise." There would thus be no chains of speculative transactions and the limited amount of credit available would pass into production without delay.

Each day that passes, evidences seem to emerge in favor our views.

Friday, April 29, 2011

Earnings Drive Stock Prices? Not From Thailand’s Experience

I have continually argued against the supposed causal relationship of “earnings drive stock prices”, which for me signifies as a popular myth with little relevance to market realties. [Read my Machlup-Livermore paradigm here here and here]

Thailand’s experience should be a noteworthy example.

clip_image002

This from World Bank data on Thailand’s Stock Exchange. (World Bank Thailand Economic Monitor)

The left window represents nominal profits of listed companies. The right window exhibits the % change of financial indicators in terms of Gross Profit, Return on Assets and Return on Equity.

clip_image004

The above is the 5- year chart of Thailand’s SET (courtesy of Bloomberg).

My observations:

Profits of SET listed companies suffered a decline for only ONE QUARTER, particularly, the fourth quarter of 2008. Yet the SET fell 55% for 16 months (green circle)!

The one quarter of decline in profits looks more like an anomaly (from an external shock) than from a structural perspective (see right window showing financial indicators where % change were all positive despite the profit drop).

If stock market prices function as a discounting mechanism predicated on earnings, then what justifies a 55% slump for an extended duration of 16 months (about 6 quarters) when profits declined for only 1 quarter?

Conversely, profits immediately recovered during the 1st quarter of 2009, yet it took the SET about 5 months into 2009 to consolidate and ascend (green arrow on SET chart), so what happened to the discounting mechanism role played by prices, if stock price are driven by earnings?

Said differently, if it took 16 months to factor in one month decline in profits, then why has not the same discounting factor apply during the recovery or that profits have been recovering yet stock prices remained depressed, so what gives?

By the earnings drive stock prices logic, any decline should have been muted and short. Apparently, there hardly has been any solid evidence to prove that such correlation exists or that the causation of earnings drive stock prices is valid.

In addition, one might point to the rate of change of Gross profits, ROA and ROE as a reason (red arrow on % change of financial indicators).

If this is true, then the SET should be on a decline since 2005, because financial indicators have been on a decline over the same period. But the opposite happened, the SET boomed from 2004 (2006 in chart) until May 2007 (red arrow on SET chart)!

As Canadian born American writer Saul Bellow said

A great deal of intelligence can be invested in ignorance when the need for illusion is deep.

It’s one thing to believe, it’s another to get real.