Showing posts with label Typhoon Yolanda. Show all posts

Saturday, May 31, 2014

Phisix: First Quarter GDP Drop to 5.7% has hardly been about Typhoon Yolanda

“The most disgraceful thing in the world, they think, is to tell a lie; the next worst, to owe a debt: because, among other reasons, the debtor is obliged to tell lies.”—Herodotus: On The Customs of the Persians

In this issue:

Phisix: First Quarter GDP Drop to 5.7% has hardly been about Typhoon Yolanda
-Differentiating Primary from Secondary Cause
-The Link between Typhoon Yolanda and Economic Growth? Coconuts!
-Fishing for Truth
-Construction Slump Amidst a Bank Lending Boom??? Yikes!

Phisix: First Quarter GDP Drop to 5.7% has hardly been about Typhoon Yolanda

Sorry but I have to play again the role of the unpopular spoiler.

I am not supposed to write this weekend but recent developments have been compelling enough for me to deliver a shorter than usual outlook.

Differentiating Primary from Secondary Cause

In the realization of what seems as widespread misinformation that has been unquestioningly accepted and imbued by the public as ‘fact’, such requires some counterbalancing.

Let me state my position clearly. I do NOT deny that Typhoon (Haiyan) Yolanda has contributed to the economic decline.

However my position is that the embedded imputation that the deadly and costly storm accounts for as the main source of the unexpected slowdown in the statistical economy or “The relatively slow growth is expected given the magnitude of destruction by typhoon “Yolanda” to agriculture as proposed by Philippine officials has been patently misguided.

Secondary causes or aggravating factors are not the same as the primary driver.

Of course, officials can be slippery enough to deny such association as shown by this newspaper narrative “while provinces directly affected by Yolanda accounted for a relatively small part of the economy, the damage in those areas disrupted supply chains nationwide, dragging down the entire country” 

clip_image002

The following table is from the National Statistical Coordination Board (NSCB) is a reconstruction of the 1st quarter GDP intended to reveal the relationship between two important factors: the share contribution and the growth rates of each sector, subsector and the GDP-GNI. Since my concern is of the risks from the supply side, I will focus on the statistical data based on the industrial origin of the GDP methodology. All data in this discussion will be based on 2000 constant prices.

The last column represents the growth data as shown in media: 5.7% GDP growth, .9% growth in Agriculture, 5.5% expansion in industry and the 6.8% outperformance of the service sector which lifted the statistical data.

The prior column shows the difference in the context of the distributional share of sectoral performance of the economic pie. The reason I’d like to exhibit the distribution is to examine whether alleged growth has been inclusive or exclusive. Put differently, to know whether growth has been broad based or concentrated.

The blue colored numbers represent the significant gainers, while the red numbers have been the decliners whereas the black numbers are industries that posted marginal changes.

Let me further clarify that a loss in the share means either that the sector suffered losses or other sectors have outweighed the growth performance of the given industry.

We will have to revert back to the table once in a while.

The faithful crowd will likely construe the following as needless caviling. But remember movements in the stock markets have been anchored in the entrenched conviction that the stock market performance equals economic growth. Even more important is the deeply held misperception that the Philippine economy has reached an immutable and irreversible new paradigm.

So a balanced perspective has to be presented to guide the mature audience why the boom should not only be questioned or doubted, but also to show that such has been founded on an unsustainable model that has been destined to crumble.

The Link between Typhoon Yolanda and Economic Growth? Coconuts!

Mainstream media associates the following figures as related to the claim of “disrupted supply chains nationwide”; “Slowdowns were noted in several key sectors. For instance, agricultural output growth slowed to 0.9 percent in the first quarter from 3.2 percent in the same period last year. The manufacturing industry also suffered, growing by just 6.8 percent from last year’s 9.5 percent. In construction, growth slowed to 0.9 percent from 31.1 percent in 2013, dragged down mainly by the private sector.”

Yet media and domestic officials hardly even exerted any effort to explain HOW this supposed association or supply chain links ever occurred. The connection had simply just been presumed or rationalized.

Let us take on Agriculture first.

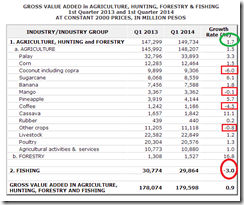
Agriculture has been reported to have slowed by .9%. Looking at the table, as a share to the overall economy the industry has declined from 11.15% to 10.64% for year on year even when this sector posted a positive growth. The implication is that growth in the other industries outshined agriculture that resulted to its loss of share.

Meanwhile, fishing represents the only subsector of the agricultural industry. Fishing accounts for 16.63% of the agricultural pie in the 1st quarter data down from 17.3% during the first quarter of 2013.

clip_image003

The reason for this quarter’s share reduction has been because y-o-y fishing economic activity has posted a substantial loss of 3% that virtually chipped away the 1.7% gain of the land based agriculture industry.

Aside from geothermal industries and the “two of the country’s top dollar earners: the Philippine Phosphate Fertilizer Corporation (PHILPHOS) and the Philippine Associated Smelting and Refinery Corporation (PASAR)” according to the NSCB Eastern Visayas Region branch, Region 8 “is rich in natural resources, including vast agricultural lands with fertile soil, abundant water and wet climate.  Among its major crops are palay, coconut, banana, camote, corn, abaca and sugarcane.  It is the country’s second largest producer of coconut and abaca among the 17 regions.  It is also rich in freshwater fish and other marine resources.” (bold mine)

Let us see how Typhoon Yolanda’s impact on Region 8’s major produce affected the national growth during 1st quarter by looking at the national performance.

Palay grew by 3.3%, coconut suffered a setback of a considerable 6%, banana gained 1.8%, camote and abaca (perhaps under other crops fell by .8%), corn advanced 1.5% and also sugarcane which jumped by 6.1%.

If there has been any major impact on agriculture, it has mainly been conspicuous in the coconut sector. This is understandable given that Region 8 has been “the country’s second largest producer of coconut”.

Yet with national agricultural data suggesting that losses from the Typhoon have been neutralized for MOST of the crops, then this leaves the fishing industry as the possible other link.

clip_image005

Now let us put into context whether the decline in the agricultural industry has been an aberration. If there is one then this would reveal the extent of the damage from the typhoon.

Typhoon Haiyan slammed the Philippines on November 3-11, 2013, that’s about halfway the fourth quarter period.

Yet agriculture ironically posted gains of 2.3% despite the steep decline in the fishing industry at -4.4% at the last quarter of 2013. So from day zero of the storm’s impact going into the end of the quarter from the impact, the last quarter 2013’s growth rate still posted a positive .9% (blue rectangle). Apparently, the 1st quarter performance seems like carryover of the last quarter performance. So this hardly looks like a deviation.

Notice too that agricultural-fishing industry has been very volatile

Even BEFORE to the storm, specifically during the second and third quarter of 2013, the main agricultural sector posted marginal loss (-.9%) and a very much slower (+.3%) than the 1st quarter 2014 gains (1.7%). This has also been reflected on the gross value added -.2 and .3, respectively as against +.9%. 

The crowd may blame it on Typhoon “Bopha” Pablo that struck in November 25-December 9, 2012, which Wikipedia.org considers as the most destructive. But this wouldn’t square with robust 3.2% annualized gains during the first quarter of 2013.

So the post Typhoon Yolanda performance has even been STRONGER than the two quarters of output preceding the advent of the calamity.

In short, except for the coconuts, most of the attributions to Typhoon Yolanda as the main source of slowdown in the agricultural sector looks more like a post hoc ergo propter hoc fallacy.

Fishing for Truth

Let us proceed to fishing.

clip_image007

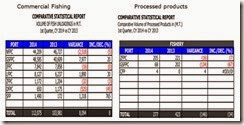
Based on the data from Philippine Fisheries Development Authority, commercial fishing volume of fish unloading in the first quarter on major fish ports* has shown an 8% growth in terms of metric tons (left pane). Note there has been no major port from Region 8.

Metro Manila’s Navotas Fish Port Complex (NFPC), which posted a decline of 5%, has been toe to toe with General Santos Fish Port Complex (GSFPC) whose growth offset the loss in Navotas, as the leader for the largest drop off point for commercial fishing.

This is in contrast to processed products which posted a sharp a decline. The reduction of output in Zamboanga can be traced to the three month fish ban on sardines and red herring.

*Navotas Fish Port Complex (NFPC), Sual Fish Port, Lucena Fish Port Complex (LFPC), Camaligan Fish Port, Iloilo Fish Port Complex (IFPC), Davao Fish Port Complex (DFPC), Zamboanga Fish Port Complex (ZFPC) and General Santos Fish Port Complex (GSFPC)

There are two other categories in fishing; this is the field of municipal fisheries and aquaculture. The latter seems the most likely candidate for Region 8’s potential given the description of “rich in freshwater fish”. Unfortunately I don’t have access to the other data to determine the depth of link between Region’s 8 contributions to the national economy in the context of these areas.

clip_image009

But such data would not be necessary. The region’s GDP would be enough.

If we look at Region’s GDP based on NSCB data, in 2011, the fishing sector contributed to only 4% of the region’s output. Region 8’s fishing output represented about 4.6% of the national fishing industry (see page 9 of the link) for the same period. So it would be difficult to explain how 4.6% will have a material spillover effect on the 95.4%.

If the far larger agricultural sector, where Region 8’s share of the national has been at 5.67% based on 2011 data, has been outweighed by the national performance, then the same dynamics should apply to the much smaller fishing industry. Therefore the decline in the fishing industry must have been less likely from Region 8 but from elsewhere.

Meanwhile, the manufacturing sector accounts for the largest share of the region’s economy at 26.8% in 2011. From the national level, the sector’s contribution has been a puny 3%! So I am also at a loss to see or comprehend how 3% would have “disrupted supply chains nationwide”.

The same holds true with construction industry where in 2011, the sector generated 5.3% of the region’s output. In the context of the national level, the region’s construction activity only accounted for 2.63% level in 2011. So to assume that 2.63% would have a significant supply chain drag on the national level would seem quite perplexing for me.

I hope officials can enlighten us on this supposed causal chain of flows. But I suspect that they won’t.

I am even more confused to see how construction has not taken off in the region despite the reported whopping 34 billion peso worth of donations which accounts for 22% of the 2011 regional GDP. 

What happened to all those contributions?

Construction Slump Amidst a Bank Lending Boom??? Yikes!

clip_image011

Both media and officials have sparsely treated the unforeseen plunge in the construction industry which obviously has been meant to downplay the message.

The construction activity on the national level has shriveled to a still positive but miniscule .9% growth. The public’s sector’s substantial 22.3% gains have barely lifted the industry from an evolving slump! This is because of the astonishing 6% dive by private sector spending which provided the heft of construction activities at 77% share in April. 

Yet with buzzing of the construction activities going on here in the metropolis, how can this be?

clip_image013

Has government construction spending been ‘crowding out’ private sector spending or has government been using resources at the expense of the private sector?

Viewed from annualized q-o-q changes from 2012, each time private sector grew, the public sector contracted and vice versa (left pane).

Such are signs of the tradeoff between the competing use of resources by the private and the public sector.

Nonetheless, what seems troubling is that the deterioration of private sector spending seems to have been mirrored in the in the decline in the gross value added in the construction industry, which apparently peaked in Q4 2012. This reveals an ongoing loss of productivity coming in the face of a supposed boom.

Even more baffling has been the still blistering pace of bank lending growth to the construction and real estate sectors.

clip_image015

The drop in construction activities has been rationalized as government tightening.

Media quotes Philippine officials as saying that “prudential measures implemented by the Bangko Sentral ng Pilipinas (BSP) aimed at keeping banks’ exposure to the sensitive real estate sector could have constrained lending to property companies”

Perhaps they are right.

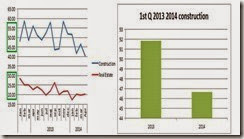
Bank lending to the construction industry fell from an average of 51.82% [FIFTY ONE PERCENT] in the 1st quarter of 2013 to an average of 46.64 [FORTY SIX PERCENT] in the first quarter of 2014 (right window)! Despite the 5% drop, FORTY SIX percent would still be about SEVEN times the economic growth rate of the 1st quarter! Some constrain huh?

And this juggernaut in bank credit expansion to both the real estate sector and construction industry has still been apparent based on the latest April BSP lending data.

Bank lending to the real estate industry still hovers at 20% (20.18% in April; see left pane) while construction loans have fallen to 40.53% (FORTY Percent).

This comes even AFTER the April 4th implementation of the first series of the twin One Percent increases in the banking system’s reserve requirements.

As a side note: I told you so (!), reserve requirements under the modern central banking system will barely constrain bank lending. General loans even climbed to 18.8% in April (y-o-y) from 18.07% last March. The BSP and the government will not tolerate the end of the subsidies to the government from financial repression policies. They have been incredibly HOOKED to it.

This validates my view of the bluff pulled by the BSP which has been embraced by the clueless and gullible public.

Well folks, that’s how the government defines “macro prudential” or “keeping banks’ exposure to the sensitive real estate sector” constrained.

But don’t worry, the public or the crowd so agrees with them.

Yet despite the FOURTY SIX percent bank issued loans to the construction industry and TWENTY percent loans to REAL ESTATE companies, PRIVATE sector construction output FELL SIX percent???

Huge loans producing negative growth, why? What’s been going on??!!

clip_image017


Not only has bank lending been roaring as output have been in a sharp decline in the construction industry, money supply as of April continues to stagnate(!), as shown by the chart above, thereby galvanizing my suspicions of a fast expanding use of debt in-debt out.

No systemic risk eh?

Let me tell you that the recent downturn in the construction industry may represent the initial signs of fissure from stagnating money supply growth. If these events persist, as stated last week, then this will mark the process reversing this illusory boom where the new paradigm will be faced with gravity from planet earth.

Going back to the GDP table, it has been notable that the drop in the share of the construction sector has more been covered by the gains of the real estate sector. Notice too that the share of the bubble sectors (excluding the hotel) have gained from 38.27% to 38.38% as the share of agriculture, electricity, and others have shrunk.

This again translates to a growing concentration of risks.

Watch it though, the trade (wholesale and retail) sector seem to be showing signs of fracture! While y-o-y growth posted 5.5%, the share of trade has contracted along with the construction industry.

Hmmmm…

At the end of the day, massaging of data would hardly bring about the relevance or connection between the partialities of Typhoon Yolanda—bank ending “macro prudential measures” rationalization against the slowing economic growth.

Oh, the Phisix fell 2.4% this week for its first official correction.

Eyes on money supply growth now!

Expect euphoria to segue into a deep acrimonious denial phase. This means that IF the statistical economic slowdown persists, then finger pointing will become the du jour talking point. There will clarion calls by the public for the government to do more and more interventions that will only deepen the predicament.

Let me end with a quote from English enlightenment writer François Marie Arouet or more popularly known by his nom de plume “Voltaire” (1694-1778)
"Prejudices are what fools use for reason."
Enjoy the weekend!

Monday, November 25, 2013

Phisix: Are ASEAN Markets Signalling Trouble?; More on Typhoon Yolanda

My concluding statement in the epilogue section of last week’s reports looks prophetic. I wrote[1],
If the Philippine market does experience a convulsion in response to a possible deterioration of regional conditions, expect Typhoon Yolanda to be a favorite scapegoat.
clip_image001

Equity benchmarks of the region had been mostly lower this week, with Thailand’s SET and the Philippine Phisix posting losses of over 4%.

The Typhoon Yolanda Bogeyman

Yet some examples[2] of Typhoon Yolanda as post hoc scapegoat “Investors were on profit-taking mode following the downgrade of the country's economic outlook because of the impact of Typhoon 'Yolanda'” ; “adding to those worries was the gradual stream of reports indicating the cost of damage due to Typhoon Yolanda” and “Typhoon has provided overseas investors a good excuse to continue taking profit.”

The other issue rationalized as contributing to the loss in the Phisix has supposedly been concerns over the Fed’s “tapering”.

As an update, estimated damages tallied by the National Disaster Risk Reduction and Management Council has now reached P22,659,851,383.76[3]. This would represent 53.7% of the Php 42.2 billion economic costs by the reigning “most destructive” storm to hit the Philippines, Typhoon Pablo. Typhoon Yolanda currently ranks third after Typhoon Pablo (December 2, 2012) and Typhoon Pepeng (October 2-10, 2009). My guess is that we will know whether Typhoon Yolanda will surpass the degree of devastation by Typhoon Pablo possibly by next week which I believe should spotlight the peak of the damage assessments.

Despite the “Typhoon equals lower stocks” meme, as I have pointed out last week and two weeks back, empirical evidences exhibits a smidgen or an iota of causal relationship between Typhoons and the stock market performance or even the economy[4].

But obviously, conducting meaningful investigations to establish realistic representations has hardly been a concern for “experts”, instead the same “experts” simply feed on the public’s desire for popular convenient excuses regardless if such relationship stands on tenuous grounds.

In the context of behavioral science, ‘experts’ employ availability bias[5]—ranking of importance of information based on easiest to be recalled—to satisfy the demand for confirmation bias of the gullible public.

Nevertheless Typhoon Yolanda has snared the lead from Typhoon Uring (November 4-7, 1991) as the “deadliest” of all Typhoons to have hit the Philippines. As of the latest count, Typhoon Yolanda has claimed 5,235 lives with 1,613 missing[6]. If we add missing to the death count this adds to 6,848.

As far as Typhoon classification goes, “deadliest” has not necessarily equated to “destructive”, so far only Typhoon Yolanda has been running consistent on both categories.

More Politicization of Typhoon Yolanda

Last week, I also pointed out how the popularity addicted Philippine President scoffed at projections of 10,000 casualties from the storm saying that such estimates have been ‘too much’. At an interview with a foreign media outfit, he publicly insisted on a range of 2,000-2,500 as maximum fatality count. He even sacked the Police officer who gave the initial estimates.

Within the week, the National Disaster Risk Reduction and Management Council (NDRRMC) reportedly stopped the death count due to changes in “the policy on accounting”[7] as the death estimates surpassed the 4,000 level, but immediately reversed this on public clamor. The NDRRMC chief denied “receiving orders to stop releasing the death toll” or the involvement of politics[8].

Has insisting on a statistical threshold and the sacking of the Police officer not been an act of politics?

With the death count careening farther away from the President’s estimates and fast approaching the 10,000 estimates, will the Philippine President reinstate the Police officer and or make a public apology? How about if the deaths reach 10,000, will the President resign?

By publicly announcing a threshold level, not only does this reveal of the administration’s PR Public Relations gaffe, this unfortunate and sordid event exposes on the administration’s obsession for approval ratings, where as noted above, reports showed of an attempt at the suppression of the official death count via censorship.

This essentially highlights the administrations use of Joseph Stalin’s “a single death is a tragedy a million death a statistic”. 

Where every death is a tragedy, even more tragic is the use of disasters to promote political self-interests.

And politicization hasn’t been exclusively the realm of the Presidency, this applies to other officials such as the Vice President as well as spouse of an incumbent official whom have reportedly used political “branding” in the distribution of relief goods[9].

ASEAN Currencies: Signs of Trouble Ahead?

Also in the closing segment of last week’s report I warned that instead of focusing Typhoon Yolanda we should rather be vigilant on the activities within the region
I would rather be watching two neighbors, Indonesia and China, who seem to be experiencing re-emergent signs of financial market ‘tremors’ which poses as potential risks for a shock…

The last time the rupiah hit a milestone this coincided with the turmoil in the ASEAN financial markets.
clip_image002
Figure 1: ASEAN-4 Currencies

ASEAN currencies have been enduring re-emergent signs financial pressures see figure 4.

Within the week, the USD-Indonesian rupiah (via one year chart, see Figure 1) breached the September highs to set fresh milestone. Last Friday, the USD rupiah closed at a 5-year high.

The Philippine peso has also manifested signs of renewed weakening against the US dollar. The Peso fell .4% this week and closed Friday at June highs. The peso has been in consolidation since the Fed’s UN-taper from September through the first week of November.

The Malaysian ringgit and the Thai baht has equally been losing ground against the US dollar.

Going back to the Peso, the Bangko Sentral ng Pilipinas reported net foreign portfolio inflows in October at US$969 million which has been “much higher than the US$683 million recorded in September and US$40 million a year ago.”[10] Foreign money flowed into PSE-listed securities (52.6 percent), Peso GS (44.0 percent) and Peso time deposits (3.4 percent).

clip_image003
Figure 2: Net Foreign Portfolio Flows (BSP)

The data I accumulate via daily PSE quotes reveals of net selling (Php 7.545 billion) which varies from the BSP October figures. Given the benefit of the doubt that my data may not be reliable, it’s seems unusual to see the Peso firming by a marginal .75% in October when in September a much smaller portfolio inflow resulted to a 2.4% gain in the Peso. The red circle shows of the net foreign portfolio flow last October (Figure 2) at US $969 million as against the $682.72 million last September.

Aside from statistical reporting difference or anomalies, could this underperformance by the peso have been due to the BSP’s selling of US dollar Gross International Reserves in October (which resulted to a lower US $.1 billion to $83.4 billion[11]) or could the private sector residents accumulated on US dollars to enough offset these alleged substantial foreign net inflows?

The recent bout of infirmities in the peso has already began to hamper “earnings growth” conditions of many publicly listed firms such as San Miguel Corporation[12], Aboitiz Power[13] and parent Aboitz Equity Ventures[14], PLDT[15], JG Summit[16], Philex Petroleum[17], Cebu Pacific[18], Energy Development Corp[19] and Atlas Corporation[20]

Though the extent of impact varies from company to company, earnings impairment from foreign currency losses—due to one quarter of currency volatility—exposes on the vulnerabilities of these companies to currency risks due to foreign currency debts. As I have been pointing out, zero bound rates have impelled many publicly listed companies to increase leverage exposure, many of them on foreign exchange debentures.

The 64 billion peso question is what if the peso continues to fall further? How will these impact the earnings of these companies? Will the recourse be more borrowing to offset the losses and hope for a peso recovery? What if foreign liabilities become substantial enough to put credit quality on the line?

The ASEAN 4’s currency frailties signify just one of the aspects.

Bond Vigilantes Harries ASEAN Bond Markets

clip_image004
Figure 3: ASEAN-4 10 Year Local Currency Bonds

The global bond vigilantes have been romping at the ASEAN 4 except the Philippines.

The 5 year high in the rupiah has been reflected on Indonesia’s sovereign 10 year bonds whose yield fast approaches (24 basis points away from) the September highs.

Malaysia’s 10 year bond yield has just been 5 basis points away from the July high at 4.14%.

Yields of Thailand’s 10 year bonds have likewise been soaring and now signify just 19 basis points away from the August highs.

Philippine 10 year bonds remain in a temporary tranquil state.

clip_image005
Figure 4: ASEAN Debt Outstanding

And with ASEAN debt inflation as the principal engine of economic growth, rising rates will increase the cost of servicing debt, prove to be an obstacle to present debt based growth dynamic (by slowing expansion and diminishing demand) while at the same time increasing credit risks.

Let me cite an example. The third quarter rampage by the bond vigilantes in Thailand has tellingly slowed the Thai statistical economy which grew 2.7% on an annualized basis.

From the Wall Street Journal Real Time Blog[21]
The NESDB — the government’s economic planning agency — blamed the weaker-than-expected results on falling household spending and consumption after the expiration of the government’s First Car tax rebate last December resulted in a significant drop in auto purchases. Declining farm income and weaker consumer confidence also hurt consumption.

Growth was also hurt by a slowdown in construction, a fall in machinery and equipment investment, a slow recovery in global demand for Thai goods and sluggish shrimp production owing to an unresolved spread of a disease among shrimp stocks.
Go look at the Thai bond yields during the 3rd quarter on figure 3. Rising yields and the falling Thai baht or the volatility spike in Thai’s financial market has apparently crimped on the Thai economy. The article omits mentioning this.

And ASEAN’s debt profile as shown in Figure 4[22] reveals that the region’s debt distribution has been asymmetric. 

While Thailand and Malaysia have been both vulnerable to household debt, the risks to the Philippines have been in the financial sector which has been the primary source of funding for the government and non-financial institutions while household debt represents a speck of the overall. 

As a side commentary, this is what the mainstream fails to see: How the banking and financial system in the Philippines have been ‘concentrated’ to a few, given the still low penetration levels of banking access and credit access in the household level, despite the so-called boom.

So when the Philippine government issues statistical growth, they tend to exaggerate economic activities in the formal sector as representative of the whole. These numbers hardly account for the huge part of the Philippine economy which remains informal.

Based on the definition of the informal sector by Wikipedia, “not taxed, monitored by any form of government, or included in any gross national product (GNP), unlike the formal economy”[23], this means that many segments of the Philippine economic data are subject to substantial statistical errors.

Meanwhile, Indonesia which presently has been the focal point of ASEAN’s weakness, oxymoronically has generally, the smallest exposure on debt. 

Two insights we can see from the recent developments.

One the level of debt tolerance has not been relatively based, as fallaciously argued by some officials and mainstream experts defending the current credit boom, but on creditor—per country relationship basis.

Two, while Indonesia may function as catalyst for a potential crisis, Thailand and Malaysia appear to be even more vulnerable to a sudden shift in the confidence levels of creditors.

clip_image006
Figure 5 ASEAN LCY Bond Foreign Ownership

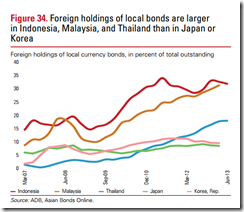
Figure 5 reveals how fragile or how ASEAN bonds are sensitive to foreign sentiment, given the substantial level of foreign ownership of local currency bonds. Foreign money accounts for nearly 30% of local currency bonds in Indonesia and Malaysia while Thailand has about 15%.

Given today’s global wild and rampant yield or momentum chasing activities, combined with massive cumulative build-up of economic distortions from central bank policies, sudden shifts in foreign sentiment may spur extensive dislocations in the marketplace again exposing all the amassed imbalances.

The Philippine contemporary, as previously discussed has been a relatively closed and illiquid market. As I wrote in September[24]
The investor profile of the domestic bond market reveals of a seeming proportional distribution of the outstanding bonds between the resident private sector institutions and various domestic government agencies. In other words, the Philippine government and their private sector allies have been able to ‘manage’ bond markets.
This doesn’t mean that closed and illiquid markets serve as free passes for bubbles. If ASEAN markets will undergo sustained turbulence, there will most likely be a spillover to Philippine bond and financial markets. Since the Philippine bond markets have been grotesquely mispriced, I expect the volatility in the bond markets to be magnified.

ASEAN’s financial turmoil will be evinced by extended episodes of liquidity shortages that will expose on accrued malinvestments concealed by the recent boom. Companies desperate for funding will frantically compete from the diminishing pool of supply amidst dramatically receding confidence and a shift to fear. Such dynamic will eventually force up domestic bond yields at a rate even faster than the more liquid counterparts.
clip_image007
Figure 6 Indonesia’s yield curve

Indonesia’s rapidly flattening yield curve seems like a good example see figure 6[25].

Above, I pointed on how Indonesia’s 10 year yield seems to be swiftly approaching September highs. But the flattening yield curve reveals that short term yields have been rising more hastily than the longer end. This is a sign of an advancing stage of a liquidity crunch. The liquidity crunch will be magnified when yield curve inverts. Inverted yield curves have usually been accurate indicators of recessions or crisis. 


clip_image008
Figure 7: ASEAN Default Probabilities

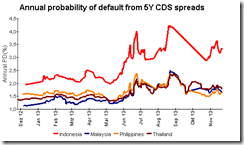
Indonesia’s rising bond yields and speedily falling rupiah have also been reflected on the default risks via 5 year Credit Default Swaps (CDS) Probability of Default (PD)[26].

While Indonesia’s annualized probability of default 3.3% (based on recovery rate of 40%) is far from Argentina (15.6%) or Venezuela (12.8%), we seem to be seeing a formative upside move. 

Meanwhile ASEAN’s bond vigilantes have yet to influence the CDS default probabilities of Thailand, Malaysia and the Philippines. Nonetheless ASEAN’s CDS probabilities remain elevated relative to the pre-Abenomics levels which demonstrate languishing concerns over financial stress.

ASEAN Stock Markets: Patterns and Pairs

This leads us to the stock markets.

clip_image009
Figure 8: Clustering Illusions? Phisix-SET and the Nikkei

I bring up again the peculiar similarities in figure 8 first between the Philippine Phisix (upper left window) and Thailand’s SETI (upper right window).  Since the start of the year the Phisix-SET has acted in an uncanny resemblance with each other. This can be identified through their recent inflection points (green arcs). Well this week’s near identical fall 4+% seems even creepier. 

A second bizarre pattern can be traced to the similitude of the Phisix-SET with Japan’s Nikkei 225 during the latter’s boom bust transition over a 10 year period (red rectangle). While the Nikkei’s pattern may not be as precise as the Phisix-SET, the Nikkei’s chart exudes of a full scale bear market that followed a manic boom.

The likeness of the Phisix-SET and the Nikkei can be seen via the major inflection points as highlighted by the green arcs.

While I hardly am a believer in chart patterns, my question is will a repetition of the Nikkei’s pattern be expressed via the Phisix-SET? Considering the similarities in the extensive build up of systemic debt (although distinctly distributed), I guess the answer will entirely depend on the bond vigilantes.

And compared to the earlier surges in ASEAN bond yields, where ASEAN stocks responded forcefully as seen via sharp volatilities, today’s stock market actions seem to be more subtle and partially different.

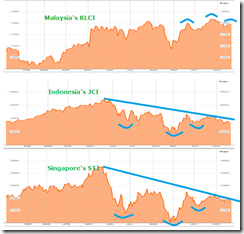
clip_image010
Figure 9 ASEAN stocks: Malaysia’s KLCI Indonesia’s JCI and Singapore STI

Aside from the seemingly steep deterioration in the nearly self-same Phisix-SETI, Indonesia’s JCI seems to be in a slow but steady decline see figure 9

ASEAN stocks go against Malaysia’s KLCI, ASEAN’s odd man out, which recently even etched record highs. Malaysia’s flagging bond markets and the falling ringgit have only dented the KLCE marginally.

Meanwhile the ASEAN developed economy equity market benchmark of Singapore, via the STI, uncharacteristically seems to approximate movements of Indonesia’s JCI. The inflection points of JCI-STI again reveals of the noteworthy similarities

So ASEAN equities appear to trade in pairs: Singapore’s STI-Indonesia’s JCI and Philippine Phisix-Thailand SETi

As a side note Singapore’s 10 year bond markets and currency, the Singapore Dollar, seem to also exhibit signs of relapse.

Will Malaysia’s KLCI lead the rest of ASEAN out of the woods? Or will the bond vigilantes spoil the KLCI’s party and bring her to tow the line along with the rest of her neighbors?

ASEAN’s Fed Taper Bugaboo

Aside from the Typhoon Yolanda bogeyman, I find comments by highly paid local “experts” attributing the relative underperformance of ASEAN equities on the Fed’s taper as signs of cluelessness.

When outgoing Fed chief Ben Bernanke surprised the markets heavily expecting a tapering with an UN-taper last mid-September[27], the rebound in ASEAN markets failed to keep pace with advances counterparts in the US, Europe and Japan and eventually faltered. Then tapering was off the table but ASEAN markets floundered and disappointed.

clip_image012
Figure 10: Yardeni.com Retail Investors Leads the Yield Chasing Momentum[28]

Recently incoming Fed Chairwoman Janet Yellen has signalled continuity of Bernanke’s dovish policies or the retention of easy money environment. This has been celebrated by stock market participants who pumped US stocks to a Wile E Coyote running off the cliff momentum[29]. Unfortunately ASEAN markets fumbled anew

Retail investors have been piling up on US stocks see figure 10

While there have recent been chatters over the Fed’s taper, “tapering” will hardly be a reality soon, particularly for a steroid asset bubble dependent economy. This also means the Fed’s taper has hardly been the current source of ASEAN’s sustained underperformance.

As far as June 2013[30], I have been saying that the Fed’s tapering signifies a “poker bluff”, as yields of US treasuries have been rising since July 2012. Even Mr. Bernanke’s QE 3.0 in September 2012 failed to stem the rising yields.

Here is what I wrote[31]
But treasury yields have been rising since July 2012. Treasury yields have been rising despite the monetary policies designed to suppress interest rates such as the US Federal Reserve’s unlimited QE in September 2012, Kuroda’s Abenomics in April 2013 and the ECB’s interest rate cut last May.

Rising treasury yields accelerated during the second quarter of this year, which has now been reflected on yields of major economies, not limited to G-4.
Mr. Bernanke’s tapering bluff was called last September.

Aside from tapering expectations, rising rates of US treasuries (USTs) have been partly reflecting on a combination of the following factors 

-inflationary boom gaining traction which has spurred accelerating demand for credit thus pushing up interest rates.

-erosion of real savings or the diminishment of wealth generators or growing scarcity of real resources due to the massive misallocation of resources prompted by central bank inflationist policies.

-diminishing returns of central bank policies where continued monetary pumping has led to higher rates.

-inflation premium, despite relatively low statistical CPI. Perhaps markets have been pricing inflation of asset bubbles

-growing credit risks of the US government

-Triffin Dilemma or Triffin Paradox[32] where improving US trade deficits have been reducing US dollar liquidity flows into the global economy.

As for the underperformance by ASEAN, such has been partly been in response to the above dynamics combined with the possible peaking of internally generated “homegrown” bubbles as manifested by the unsustainable convergence trade[33]

I even find signs of massive denials and intensifying desperation by experts to even seek a Manny Pacquiao victory in the hope that such would boost the domestic stock market[34].

Well the oversold markets will surely experience bounce. Mr Pacquiao’s victory or the coming announcement on Philippine GDP which I expect to be in line with the mainstream’s expectations given the late spurt of credit growth will have little do with it.

As shown above the actions of the Phisix appear to be anchored to the developments of her neighbors. This means that the region recovers and the Phisix will rise with the tide or a tsunami will sink all boats.

In my view risks seems very high and will continue to do so for sometime.


[4] See Typhoon Yolanda and the Phisix November 11, 2013


[10] Bangko Sentral ng Pilipinas Foreign Portfolio Investments Yield Net Inflows in October November 14, 2013

[11] Bangko sentral ng Pilipinas End-October 2013 GIR Stand at US$83.4 Billion November 7, 2013

[12] Businessworld Online Forex losses weigh on San Miguel November 11, 2013


[14] Inquirer.net Aboitiz reports 8% decline in net income October 30, 2013

[15] Businessworld Online PLDT profit growth sustained as of Sept. November 5, 2013

[16] Manila Bulletin Forex losses trim JGS’ net income November 11, 2013


[21] Wall Street Journal Real Times Economic Blog Thai Economy Disappoints and More Risk Ahead, November 19,2013

[23] Wikipedia.org Informal sector


[28] Yardeni.com US Flow of Funds: Equities November 22, 2013