Showing posts with label US banking system. Show all posts

Sunday, April 14, 2019

S&P 500 and Global Equities: Behind The Best 71-Day Returns Since 1987; China’s Credit Rockets! Continued Ascent of US Primary Dealer Holdings of T-Bills


A delirious stock-exchange speculation such as the one that went crash in 1929 is a pyramid of that character. Its stones are avarice, mass-delusion and mania; its tokens are bits of printed paper representing fragments and fictions of title to things both real and unreal, including title to profits that have not yet been earned and never will be. All imponderable. An ephemeral, whirling, upside-down pyramid, doomed in its own velocity. Yet it devours credit in an uncontrollable manner, more and more to the very end; credit feeds its velocity—Garet Garett

S&P 500 and Global Equities: Behind The Best 71-Day Returns Since 1987; China’s Credit Rockets! Continued Ascent of US Primary Dealer Holdings of T-Bills
Figure1
This first chart shows that the S&P 500 has registered the fourth-best return in 71 days and the best return since 1987. (chart courtesy of Charlie Bilello)

But here’s the rub. Beneath the surface, of the top four best returns in 71-days, namely, 1975, 1930, 1987 and 1943, yearend returns were either strikingly single digit or stunningly negative.

Said differently, by the close of the year, the gains of the top four were completely or mostly reversed.

The possible reasons:

-1975 signified the tail end of 1973-1975 recession.
-1930 represented the onset of the Great Depression
-1987 saw the horrific Black Monday crash and
-1943 may have been the prelude to the post World War 2 the short recession of 1945.

Will the SPX follow the same path?
Figure 2
The next chart (also from Charlie Bilello) shows the intensifying euphoria that has engulfed global equity markets.

Forty-six of the forty-eight national ETFs including the Philippines have posted positive returns! The average returns have been an astounding 12%, the best start since 1987! (returns in USD)

1987 again!

Will global equity markets share the same fate of the SPX?

The third chart comes from Ed Yardeni’s Country Briefing: China

It shows how the Chinese government has panicked to have incited the unleashing a tsunami of credit at a scale never seen before!
Figure 3
The perspicacious Doug Noland with the nitty gritty:

China’s Aggregate Financing (approximately system Credit growth less government borrowings) jumped 2.860 billion yuan, or $427 billion – during the 31 days of March ($13.8bn/day or $5.0 TN annualized). This was 55% above estimates and a full 80% ahead of March 2018. A big March placed Q1 growth of Aggregate Financing at $1.224 TN – surely the strongest three-month Credit expansion in history. First quarter growth in Aggregate Financing was 40% above that from Q1 2018. 

Over the past year, China's Aggregate Financing expanded $3.224 TN, the strongest y-o-y growth since December 2017. According to Bloomberg, the 10.7% growth rate (to $31.11 TN) for Aggregate Financing was the strongest since August 2018. The PBOC announced that Total Financial Institution (banks, brokers and insurance companies) assets ended 2018 at $43.8 TN.

March New (Financial Institution) Loans increased $254 billion, 35% above estimates. Growth for the month was 52% larger than the amount of loans extended in March 2018. For the first quarter, New Loans expanded a record $867 billion, about 20% ahead of Q1 2018, with six-month growth running 23% above the comparable year ago level. New Loans expanded 13.7% over the past year, the strongest y-o-y growth since June 2016. New Loans grew 28.2% over two years and 90% over five years. 

China’s consumer lending boom runs unabated. Consumer Loans expanded $133 billion during March, a 55% increase compared to March 2018 lending. This put six-month growth in Consumer Loans at $521 billion. Consumer Loans expanded 17.6% over the past year, 41% in two years, 76% in three years and 139% in five years. 

China’s M2 Money Supply expanded at an 8.6% pace during March, compared to estimates of 8.2% and up from February’s 8.0%. It was the strongest pace of M2 growth since February 2018’s 8.8%. 

South China Morning Post headline: “China Issues Record New Loans in the First Quarter of 2019 as Beijing Battles Slowing Economy Amid Trade War.” Faltering markets and slowing growth put China at a competitive disadvantage in last year’s U.S. trade negotiations. With the Shanghai Composite up 28% in early-2019 and economic growth seemingly stabilized, Chinese officials are in a stronger position to hammer out a deal. But at what cost to financial and economic stability?

Beijing has become the poster child for Stop and Go stimulus measures. China employed massive stimulus measures a decade ago to counteract the effects of the global crisis. Officials have employed various measures over the years to restrain Credit and speculative excess, while attempting to suppress inflating apartment and real estate Bubbles. Timid tightening measures were unsuccessful - and the Bubble rages on. When China’s currency and markets faltered in late-2015/early-2016, Beijing backed away from tightening measures and was again compelled to aggressively engage the accelerator. 

Credit boomed, “shadow banking” turned manic, China’s apartment Bubble gathered further momentum and the economy overheated. Aggregate Financing expanded $3.35 TN during 2017, followed by an at the time record month ($460bn) in January 2018. Beijing then finally moved decisively to rein in “shadow banking” and restrain Credit growth more generally. Credit growth slowed somewhat during 2018, as the clampdown on “shadow” lending hit small and medium-sized businesses. Bank lending accelerated later in the year, a boom notable for rapid growth in Consumer lending (largely financing apartment purchases). And, as noted above, Credit growth surged by a record amount during 2019’s first quarter. 

China now has the largest banking system in the world and by far the greatest Credit expansion. The Fed’s dovish U-turn – along with a more dovish global central bank community - get Credit for resuscitating global markets. Don’t, however, underestimate the impact of booming Chinese Credit on global financial markets. The emerging markets recovery, in particular, is an upshot of the Chinese Credit surge. Booming Credit is viewed as ensuring another year of at least 6.0% Chinese GDP expansion, growth that reverberates throughout EM and the global economy more generally.

So, has Beijing made the decision to embrace Credit and financial excess in the name of sustaining Chinese growth and global influence? No more Stop, only Go? Will they now look the other way from record lending, highly speculative markets and reenergized housing Bubbles? Has the priority shifted to a global financial and economic arms race against its increasingly antagonistic U.S. rival? 
Chinese officials surely recognize many of the risks associated with financial excess and asset Bubbles. I would not bet on the conclusion of Stop and Go. And don’t be surprised if Beijing begins the process of letting up on the accelerator, with perhaps more dramatic restraining efforts commencing after a trade deal is consummated. Has the PBOC already initiated the process?

April 12 – Bloomberg (Livia Yap): “The People’s Bank of China refrained from injecting cash into the financial system for a 17th consecutive day, the longest stretch this year. China’s overnight repurchase rate is on track for the biggest weekly advance in more than five years amid tight liquidity conditions.”
Figure 4
US primary dealer holdings of T-Bills and Floating Rate Notes have been spiraling upwards. Why? Have they been accumulating USTs for their account or on behalf of clients? Have these intensifying accumulation been about the growing scarcity of risk-free collateral?

Four different charts that are related (see Garet Garrett excerpt)

The year of the pig.

Tuesday, January 26, 2016

Infographic: The US Banking Oligopoly in One Chart; The Roots of Too Big to Fail

How "too big to fail" (technical vernacular: Systematically Important Financial Institutions/Banks) US banks emerged as summarized  by the following infographic

First, a few remarks from the provider of the image Visual Capitalist
The “Big Four” retail banks in the United States collectively hold 45% of all customer bank deposits for a total of $4.6 trillion.

The fifth biggest retail bank, U.S. Bancorp, is nothing to sneeze at, either. It’s got 3,151 banking offices and employs 65,000 people. However, it still pales in comparison with the Big Four, holding only a mere $271 billion in deposits.

Today’s visualization looks at consolidation in the banking industry over the course of two decades. Between 1990 and 2010, eventually 37 banks would become JP Morgan Chase, Bank of America, Wells Fargo, and Citigroup.

Of particular importance to note is the frequency of consolidation during the 2008 Financial Crisis, when the Big Four were able to gobble up weaker competitors that were overexposed to subprime mortgages. Washington Mutual, Bear Stearns, Countrywide Financial, Merrill Lynch, and Wachovia were all acquired during this time under great duress.

The Big Four is not likely to be challenged anytime soon. In fact, the Federal Reserve has noted in a 2014 paper that the number of new bank charters has basically dropped to zero.


From 2009 to 2013, only seven new banks were formed.

“This dramatic reduction in new bank charters could be a concern for policymakers, if as some suggest, the decline has been caused by increased regulatory burden imposed in response to the financial crisis,” the authors of the Federal Reserve paper write.

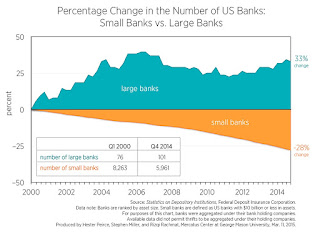
Competition from small banks has dried up as a result. A study by George Mason University found that over the last 15 years, the amount of small banks in the country has decreased by -28%.


Big banks, on the other hand, are doing relatively quite well. There are now 33% more big banks today than there were in 2000.
So zero bound rates helped shift the balance of the US banking landscape, viz the erosion of small banks in favor of "too big to fail" oligarchy 

Courtesy of: Visual Capitalist

Tuesday, October 21, 2014

Why US banks are Vulnerable

Explains Simon Black of the Sovereign Man (bold original)
What banks are stockpiling these days are US government bonds, and they’re not doing this casually, they’re going nuts for them.

In just the last month alone American banks increased their holdings of US treasuries by $54 billion, to a record $1.99 trillion.

Citigroup, for example, held $103.8 billion worth of bonds at the end of June, up 19% from the end of last year.

This is like preparing for an earthquake by running out and buying whole new sets of porcelain dishes and glass vases.

All it’s going to do is make things more dangerous, and even if you somehow make it through the disaster, you have a million more shards to clean up.

With government bonds you are guaranteed to lose both in the short-term and the long-term. Bonds keep you consistently behind inflation (even the deceptively named TIPS—Treasury Inflation Protected Securities), so the value of your savings is slowly being chipped away.

But that’s nothing compared to the long-term threats of the US government not being able to repay the loans.

Facing $127 trillion in unfunded liabilities – which is nearly double 2012’s total global output – and with no inclination to reduce those numbers at all, at this point disaster for the US is entirely unavoidable.

Never before in history has a government stretched itself so thin and accumulated anywhere close to this amount of debt.

So when the day comes, it won’t be a minor rumble. It will be completely off the Richter scale.

These facts about the US government are in no way secret. Every bank out there knows it, yet they keep piling in.

image
Chart from Zero Hedge

Monday, December 02, 2013

Bond Vigilantes: US Banks hoard Cash, shuns US Treasuries

Another very interesting development. US banks have reportedly shunned US Treasuries in favor of stashing cash.

From Bloomberg:
Never before have America’s banks been so wary of risking their cash deposits on U.S. government debt.

After holdings of U.S. debt surged to a record $1.89 trillion in 2012, lenders from Citigroup Inc. to Bank of America Corp. and Wells Fargo & Co. (WFC) are culling for the first time in six years and amassing dollars. Banks’ $1.8 trillion of the bonds now equal less than 70 percent of their cash, the least since the Federal Reserve began compiling the data in 1973.

With net interest margins falling to the lowest since 2006, banks are spurning Treasuries and hoarding unprecedented amounts of cash on prospects that loan demand will revive as a strengthening economy leads the Fed to reduce its own debt purchases. Five years of cheap-money policies also have depressed yields and made it less attractive for banks to buy Treasuries as a way to bolster income.
Lowest government bond holdings on record…
Banks’ stakes of Treasuries and federal agency bonds have declined more than $80 billion in 2013, data compiled by the Fed show. That would be the first annual decrease since 2007. At the same time, cash held by banks has surged by a record $882 billion this year to an all-time high of $2.59 trillion.

Government bonds now represent 69 percent of banks’ cash, which would be the lowest on record and the first time lenders ended a year with a smaller proportion of U.S. debt relative to cash since 1980, the data show. Banks’ holdings of assets consisting primarily of municipal bonds, asset-backed securities, company debt and equity investments have also risen.
Some observations

US Banks have now been lending to Wall Street at a record pace

Banks holdings have rotated from USTs into cash but also partly into equities.

image

Banks appear to be sensing trouble with the US treasury markets as indeed cash assets of all commercial banks have spiked to unprecedented levels.

image

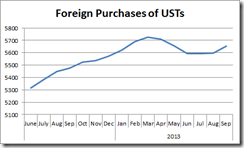
US treasuries (USTs) have mainly been supported by foreigners (mostly by the Chinese and the Japanese) which has staved off a bond market rout. (Data from the US Treasury TIC)

I argue that the behind the controversial Senkaku island dispute has been the politics of US Treasury holdings by China and Japan or the financing of the US government spending.

image

You see Japanese and Chinese record holding of USTs comes amidst a partial recovery from a near term decline in the overall purchases of USTs by foreigners. This means that in terms of foreign holdings, USTs has been essentially a Chinese-Japanese affair

Yet if the Chinese government makes good on her threat to trim holdings of USTs, along with a continuing decline of UST holdings by most of foreigners (ex-Japan), and if US banks persist to reduce exposure then this leaves the US Federal Reserve as the buyer of last resort.

image

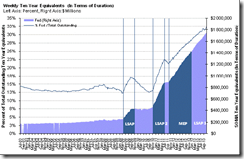
The Fed now owns a third or 32.47% of the 10 year UST equivalent according to the Zero Hedge

This tell us that there will hardly be any taper, because a taper means a dearth of buyer of USTs which also extrapolates to a bond market disaster.

Lastly the above report seems as partial vindication to what I wrote on USTs 2 weeks back
Mr. Bernanke’s tapering bluff was called last September.

Aside from tapering expectations, rising rates of US treasuries (USTs) have been partly reflecting on a combination of the following factors

-inflationary boom gaining traction which has spurred accelerating demand for credit thus pushing up interest rates.

-erosion of real savings or the diminishment of wealth generators or growing scarcity of real resources due to the massive misallocation of resources prompted by central bank inflationist policies.

-diminishing returns of central bank policies where continued monetary pumping has led to higher rates.

-inflation premium, despite relatively low statistical CPI. Perhaps markets have been pricing inflation of asset bubbles

-growing credit risks of the US government

-Triffin Dilemma or Triffin Paradox where improving US trade deficits have been reducing US dollar liquidity flows into the global economy.
Any astute observer will realize that a single policy mistake can bring--the entire house of cards standing on a credit bubble--crumbling down.

Tuesday, November 12, 2013

American’s Evolving Access to Credit

In the Philippines only about 2 in 10 persons have access to the formal banking system and a further smaller number from these few have access to banking credit, which has largely been inhibited by regulations
In the US, credit history serves as a major requirement for credit access.
At 24, Josh Waldron thought he was ready to buy a house. He paid off his college debt, only two years after graduating. He saved enough for a down payment. All in all, he and his wife were ready to leave a life of renting behind.

Then his plans ground to a sudden halt. Waldron’s credit score had disappeared.

“How did this happen? It just didn’t make sense to me that I’d have a nonexistent score,” says Waldron, who is now 28. He had applied for a mortgage loan a few months earlier and found his credit score to be a robust 718.

So what happened? How could a person who was financially responsible and paying his bills on time just wake up one day with no credit score?

The culprit turned out to be his debit card. Waldron, eager to avoid debt, used his debit card to pay his bills and buy what he needed. He had never used credit cards.

The catch: no credit cards meant no credit.
And the lack of access to credit card has been growing, from the same article
Waldron is not the only millennial who has hoped to make a go of it without a credit card. According to recent FICO study, in the last seven years the number of those 18-29-years-old living without a credit card increased by 9%, going from 7% in 2005 to 16% in 2012…

Having a FICO score – that key to financial maturity – requires having at least one account that reported to a credit bureau in the past six months. Yet a lot of millennials are walking around among the 50 million people with no credit score, and thus, no access to credit.
Seen from a different angle, the US banking system rewards chronic borrowers.

Yet the dearth of access to credit has not been limited to the millennial generation, a significant number of non-millennial have also been affected.
image

Here is a snippet of a recent survey conducted by Federal Reserve Bank of New York on the Unmet Credit Demand of US households.
Within each bar, the three kinds of groups—accepted applicants, rejected applicants, discouraged borrowers—are denoted with a different color. Here we can see substantial differences in the composition of the groups. Compare, for example, the lower-income group (those with annual household income below $50,000), and the high-income group (those with annual household income above $100,000). Both groups demanded credit at similar rates: 61 percent of lower-income households and 65 percent of high-income households demanded credit over the past twelve months. But 33 percent of lower-income households were approved (the light blue bar in the figure), while 57 percent of high-income households were approved. Likewise, while 13 percent of the lower-income households were discouraged borrowers (the maroon bar in the figure), only 0.3 percent of the high-income households fell in this category. A similar pattern plays out when comparing unemployed and employed individuals—a larger proportion of unemployed respondents do not apply because they believe they would be rejected, and those who do apply are rejected at a higher rate than the employed.
Since the world doesn’t operate on a vacuum, under served credit markets by the formal banking system has been matched by the  informal sector.  

The emergence of informal pawnshops has partly filled such demand.

From the Wall Street Journal: (bold mine)
Borro and other collateral lenders—essentially high-end pawnshops—are a small but fast-expanding part of the shadow-lending system. Since 2008, as commercial banks have cut lending to small businesses, such alternative lenders have helped fill the void.

In some states, collateral lenders can charge interest rates exceeding 200% annually because the business isn't bound by traditional banking laws. On the upside for borrowers, there isn't a credit check and little paperwork.

So some entrepreneurs are hauling treasured possessions—Baccarat chandeliers, Picassos, Maseratis, even Houdini's handcuffs—to Borro and others to bankroll businesses historically financed by conventional loans, credit cards or not at all.

In Ms. Robinson's case, Borro was familiar with her Elizabeth Catlett sculpture: She had pledged it before to fund charitable events.

Borro is the largest of this new breed of collateral lenders, having lent nearly $100 million since opening in England in 2009.

Competitors such as iPawn Inc. and Pawngo collectively have lent tens of millions of dollars.

"If it continues being this hard for consumers and businesses to access credit, we think this can be a multibillion-dollar industry," says Paul Lee, a partner at Lightbank, a venture-capital firm that has invested $3 million in Denver-based Pawngo.
Aside from specialty pawnshops, many Americans have dropped out of the formal banking system to rely instead on payday lenders or rent-to-own services as I earlier noted, aside from online P2P lending.

The notion that there have been less demand for credit from the banking system has hardly been an accurate representation of reality.

Instead credit scores, bank regulations and lending standards, the banking system’s financial conditions, the state of the economy and many other factors including even a change in people’s mindsets and confidence levels, as well as, technological advancements have combined to influence the changing patterns of American households’ access to credit.
Japan’s post bubble bust era produced the same shift out of the banking system.
Nonetheless, the markets always finds ways and means to meet such shift in demand.
And it is not just credit, even corporate financing has been evolving. Venture capital is being complimented by – Corporate VC, Competitions, Conscious Capital, and Crowdfunding, according to Lux Research