Showing posts with label technology bubble. Show all posts

Monday, October 21, 2013

Phisix: US Debt Ceiling Deal and UNTaper Spurs a Global Melt UP

Melt Up!

Melt UP!

Suddenly stock markets metastasize into a frenetic melt-up mode.

In the US, the S&P 500, the S&P 400 Mid-caps and the small cap Russell 2000 set new record highs. 

The German Dax and the French CAC also carved fresh landmark highs. 

In Asia, Australia’s S&P ASX, and India’s Sensex shared a similar feat. Ironically just a few months back the Indian economy seemed as staring into the abyss—to borrow from German Philosopher Friedrich Nietzsche[1]. How confidence changes overnight


Media explains the melt up as a function of the debt ceiling deal and extended US Federal Reserve ‘credit easing’ stimulus. From Bloomberg, “U.S. stocks rose, sending the Standard & Poor’s 500 Index to a record, as speculation grew that the Federal Reserve will maintain the pace of stimulus after Congress ended the budget standoff.”[2]

Thus the common denominator in explaining the melt-up has been the market’s worship of debt expressed via the orgy of the speculative hunt for yields in the asset markets, particularly the stock markets.

Will the global melt-up influence the Phisix, the likely answer is yes. But….

How the FED Alters the Priorities of US Corporations

Goldman Sach's chief US equity strategist, David Kostin has been quoted as attributing the current US stock market surge on P/E multiple expansion, “The S&P 500 has returned 22% YTD driven almost entirely by P/E multiple expansion rather than higher earnings.”[3]
 
This means record US stocks has hardly been about earnings growth but of the aggressive bidding up of the equities.

More signs of the yield chasing frenzy.
clip_image002


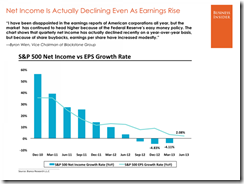
In addition, as pointed out above by Blackstone Group’s Byron Wien[4], S&P 500’s net income has been on a decline since 2010. This decline has been accompanied by a slowing of earning per share growth (y-o-y).

Yet, the modest gains in the growth rate of the S&P’s EPS have mainly been bolstered by share buybacks. 

And as previously pointed out[5], a substantial portion of corporate share buybacks has been financed by bonds which remains a present dynamic[6]

In other words, the FED’s easy money policies, including the “UNTaper” have been prompting many publicly listed companies to shore up or ‘squeeze’ earnings growth via debt-financed corporate buybacks meant to raise prices of their underlying stocks.

Share buybacks has essentially substituted the capital or investment based expansion or the organic earnings growth paradigm. Said differently, publicly listed corporations have joined the herd in the feverish speculation on stocks rather than investing in the real economy.

This also means that the yield chasing mentality has infected the corporate board rooms, where corporate models appear to have been reconfigured to focus on the immediate attainment of higher share prices. 

And a recent research paper has underscored such changes. Stern School of Business John Asker, Harvard’s Joan Farre-Mensa and Stern School of Business Alexander Ljungqvist finds[7], (bold mine)
Listed firms invest substantially less and are less responsive to changes in investment opportunities compared to matched private firms, even during the recent financial crisis. These differences do not reflect observable economic differences between public and private firms (such as lifecycle differences) and instead appear to be driven by a propensity for public firms to suffer greater agency costs. Evidence showing that investment behavior diverges most strongly in industries in which stock prices are particularly sensitive to current earnings suggests public firms may suffer from managerial myopia.
So short-termism, mainly brought about by the Fed’s policies, has afflicted many of the publicly listed firm’s priorities. Many executive officers and shareowners have presently elected to use the unsustainable speculative financing model of boosting earnings that yields temporal benefits for them.

This essentially defies Ben Graham’s 1st rule of margin of safety where companies should stick to what they know or ‘know your business’ and to avoid to making ““business profits” out of securities—that is, returns in excess of normal and dividend income” as I showed last week[8].

Yet all these will depend on the persistence of easy money regime, the suppression of the bond vigilantes and the sustainability of debt financed buyback model.

So while most publicly listed US companies have yet to immerse themselves into Ponzi financing, sustained easy money policies have been motivating them towards such direction.

A Dot.com Bubble Déjà vu? Google as Symptom?

The scrapping for yields has impelled many to jump on the IPO bandwagon despite poor track record of newly listed companies. 

According to the Wall Street Journal, 19 out of 28 or 68% of the technology issues which debuted this year has been unprofitable over the last fiscal year or during the past 12 months, which has been the highest percentage since 2007 and 2001. Yet punters wildly piled on them.

The same article notes of intensifying signs of mania “The excitement over companies’ potential rather than their present results is the latest sign in the stock markets of a rising tolerance for risk. The U.S. IPO market, often seen as a gauge of risk appetite because the stocks don’t have a track record, is on pace to produce the most deals since 2007, according to Dealogic”[9]

And Art Cashin UBS Financial Services director of floor operations at a recent CNBC interview expressed worries over a remake of the dotcom bubble, “The way people are treating technology companies, it's starting to feel a bit too much like 1999 and 2000”[10]

1999, 2000 and 2007 signifies as the zenith of the dotcom (1999-2000) bubble and the US housing bubble (2007)

Has Google been leading the way?
clip_image003

Google’s [GOOG] stock breached past the US$ 1,000 levels (particularly $1,011.41) with a breath-taking 13.8% gap up spike last Friday.

At market cap of over $335 billion, Google surpassed Microsoft [MSFT] and is now the third largest company after Apple [APPL] and Exxon Mobile [XOM][11].

Since Google is a member of the S&P 500[12], Friday’s quantum leap materially contributed to the new record of the major S&P bellwether (SPX). 

And as shown in the same chart, the S&P 400 mid cap and the small cap Russell 2000 flew to the firmament last week.

clip_image004

Three of the 5 largest S&P companies are from the information technology. In addition, technology comprises the largest sectoral weighting at 17.7% on the S&P, followed closely by financials 16.5%, and from a distance, Healthcare 13.2%, consumer discretionary 12.3% and the others. 

Should the technology mania persist, this will be reflected on the relative strength of sector, as well as, through a bigger share of the same sector in the S&P 500’s sectoral weighting.

Surprise 3rd quarter revenue growth of 23% from advertising part of which came from the mobile platform and Wall Street “emotion” has been attributed to Google’s spectacular price spike.

This Yahoo article[13] says that part of adrenaline rush on Google’s share prices has been to due low exposure on stocks by institutional investors (bold mine)
Google is higher today because it reported strong numbers, but it's not a 10% better company today than it was 24 hours ago. Wall Street is in a manic phase at the moment. For all the terrific things about Google's third-quarter, the best thing about the report was that it came on a day when institutional investors are feeling like they have far too little exposure to stocks. The average hedge fund was up less than 10% through September and there weren't many people expecting this race to new highs on the S&P500 (^GSPC) on the heels of debt ceiling debacle.
In short, more signs of frantic yield chasing.

Google’s reported 3rd quarter earnings of $10.74 per share[14], which came ahead of consensus estimates of $10.34.

While I am a fan of Google’s products, I hardly see value in Google’s stocks. 

Yahoo data[15] shows that Google has a trailing PE (ttm or trailing twelve months intraday) at 27.52, forward PE (fye or fiscal year end: December 2014) at 19.42, Price/book (mrq or most recent quarter) 3.75 and enterprise multiple of enterprise/ebitda (ttm or trailing twelve months) at 16.14.

The above multiples exhibit how richly priced GOOG has been

The same applies to the general stock market

Based on the prospects of continued declining earnings growth rate and based on the trailing PE[16], as of Friday’s close, the Dow Industrials has a ratio of 17.24, from last year’s 14.47, the S&P 500 at 18.32 from 17.03 a year ago and the Nasdaq 100 at 20.88 from last year’s 15.24. 

Most shockingly, the small cap Russell 2000 has a PE ratio of 86.58 from 32.69 a year ago! The Russell PE ratio more than doubled this year. Wow.

clip_image005

While I have not encountered GOOG resorting to share buybacks yet, GOOG’s increasing recourse to debt to finance[17] her operations has hardly been an attraction.

What perhaps may justify GOOG’s current prices is the prospect of success from its upcoming products such as the driverless cars, Google Glass and the cloud based planning applications called the “Genie” targeted at the construction industry[18].

But this would be audacious speculation.

And overconfidence has become a dominant feature.

Aside from stock market bulls brazenly hectoring and scoffing at the bears, market participants have been conditioned to see stock markets as a one way street.

For instance, record stocks which brought about the biggest single-day decline in U.S. equity volatility since 2011 rewarded the bullish option traders who aggressively doubled down on bets that the bull market in stocks would survive the default deadline[19].

The consensus has been hardwired to see any stock market decline as opportunity to “double down”.

For the bulls, risks have vanished. The stock market’s only designated direction seems up, up and away.

Yet the bullish consensus seems oblivious to the reality of the deepening dependence the stock market (and even housing) has been to the Fed’s credit easing measures. They are ignoring the fact that corporate business models have been evolving towards speculation, rather than to productive investments. Expanding price multiples, declining net income and EPS growth rate, increasing dependence on buybacks and debt financing for speculation are symptoms of such transition.

Aside from corporations, the convictions of bullish market participants are being reinforced by evidences of more aggressive actions.

While I don’t expect the FED to take the proverbial punch bowl away, everything depends on the actions of the bond vigilantes. For now, the bond vigilantes have been in a retreat. The hiatus by the bond vigilantes provides room for the bulls to magnify on their advances. Question is for how long?

If QE 3.0 in September of 2012 pushed backed the bond vigilantes for only 3 months, will the euphoric effects of the UNtaper, Yellen as Fed Chairwoman, debt ceiling deal last longer?

The French Disconnect

As I pointed out above, the UNtaper-debt ceiling deal has incited many markets to a melt-up mode which media rationalizes as “recovery”.

clip_image006

The French stock market, which is also at record highs, serves as an example.

The CAC 40 has been rising since the last quarter of 2011. Yet during 2012-2013, as the CAC rose, the French economy vacillated in and out of negative growth rates or recessions. While economic growth statistics reveal of a recent recovery, sustainability of the recovery is unclear.

French industrial production was down 1.6% in August[20], Unemployment rate is at the highest level since 1998 at 10.9% at the second quarter[21]. August loans to the private sector have been trending downwards since May[22]. Fitch downgraded France last July[23]. [note to the aficionados of credit rating agencies, French downgrade coincided with higher stocks]

Yet the CAC continues to trek to new highs. What gives?

Notes on the Debt Ceiling Deal

Furloughed Federal employees will receive a back pay[24]. This means government shutdown for furloughed employees extrapolates to a paid vacation.

The bi-partisan horse trading resulted to insertions of various goodies (Pork) for politicians. This includes $174,000 death benefit for Sen. Frank Lautenberg’s widow[25]

The US treasury will be authorized to suspend the debt ceiling as I earlier posted[26]. A limitless borrowing window will be extended until February 7, 2014[27].

This marks the second time when the debt ceiling has been unilaterally suspended. The first occurred this year from February 4, 2013 to May 18, 2013[28].

What seems as an increasing frequency of the suspension of the debt ceiling (twice this year) may presage a permanent one.

clip_image007

A day past the US debt ceiling deal, US debt soared by a record $328 billion. This has shattered the previous high of $238 billion set two years ago as the US government reportedly replenished its stock of “extraordinary measures” used to keep debt from going past he mandated level[29]. This brings US debt to $17.075 trillion Thursday.

Two days after, US debt further expanded by $7 billion to $17,082,571,268,248.24[30].

clip_image009

Debt levels growing at a rate far faster than the rate of economic growth is simply unsustainable.

Since 2008, US Federal has grown past $ 7 trillion whereas the economy grew by nearly $1 trillion[31].

There is always a consequence to every action, so will the above.

Yet this is what equity market praises.


[1] Friedrich Nietzsche CHAPTER IV: APOPHTHEGMS AND INTERLUDES Beyond Good and Evil, p 107 planetpdf.com


[4] Business Insider Net Income is Actually Declining even as Earnings Rise, Wall Street's Brightest Minds Reveal THE MOST IMPORTANT CHARTS IN THE WORLD, October 9, 2013


[6] Reuters.com Bond-backed stock buybacks remain in vogue September 6, 2013

[7] John Asker, Joan Farre-Mensa and Alexander Ljungqvist Corporate Investment and Stock Market Listing: A Puzzle? April 22, 2013 Social Science Research Network


[9] The Wall Street Journal Market Pulse In Latest IPOs, Profits Aren’t the Point October 11, 2013


[12] S&P Dow Jones McGraw Hill Financial S&P 500 Indices Fact Sheet

[13] Jeffe Macke Is Google Worth $1,000 a Share? Yahoo.com October 18, 2013


[15] Yahoo Finance, Google Inc. (GOOG) Key Statistics

[16] The Wall Street Journal Market Data Center US Stocks

[17] 4-traders.com Google Inc (GOOG)


[20] Tradingeconomics.com FRANCE INDUSTRIAL PRODUCTION

[21] Tradingeconomics.com FRANCE UNEMPLOYMENT RATE

[22] Tradingeconomics.com FRANCE LOANS TO PRIVATE SECTOR


[27] US Congress H.R.2775 - Continuing Appropriations Act, 2014
[28] The Foundry Debt Ceiling with $300 Billion in New Debt, Heritage Foundation, May 19, 2003


[31] Lance Roberts The Long Game Of Hiking The Debt Ceiling STA Wealth October 11, 2013

Monday, September 30, 2013

Video: Dot.com boom’s “New Economy” that never was

image
Reminiscent of American economist Irving Fisher’s infamous call, who thought that stock market boom during the “roaring twenties” hit a “permanently high plateau”, this 1999 CNN video during the glory days of the dot.com boom exhibits the same “this time is different” mania outlook we seem to be witnessing today.

As the Zero Hedge points out: (bold original)
In an effort to bring back some of that "memory" - and dispel the inevitable recency bias (and cognitive dissonance) as even the Fed is admitting markets are frothy, we bring you 1999's CNN Special "The New Economy - Boom Without End."

A brief clip from the archives full of internet dreams, globalization hopes, growth without inflation, and most importantly productivity gains. It seems we weren't that far off 14 years ago as Ed Yardeni notes, the internet is an inherently price-deflating animal (in its global competition exposing ways) which means - for firms to maintain profits (and stock prices), they must increase productivity... or in the modern parlance cut costs and lay off workers. "The economy has changed for good..." sums up the 'it's different this time' view of the 90s bubble.

Stephen Roach notes at the time - "if we are not in a new economy and the 'old rules' come into play from time to time, then much of what has happened in the 1990s will ultimately be challenged." Indeed Stephen...
___


Fait accompli
image

This is how Wikipedia describes the dot.com’s transition towards the bubble bust: (bold mine)
Over 1999 and early 2000, the U.S. Federal Reserve increased interest rates six times, and the economy began to lose speed. The dot-com bubble burst, numerically, on March 10, 2000, when the technology heavy NASDAQ Composite index, peaked at 5,048.62 (intra-day peak 5,408.60), more than double its value just a year before. The NASDAQ fell slightly after that, but this was attributed to correction by most market analysts; the actual reversal and subsequent bear market may have been triggered by the adverse findings of fact in the United States v. Microsoft case which was being heard in federal court. The conclusions of law, which declared Microsoft a monopoly, were widely expected in the weeks before their release on April 3. The following day, April 4, the NASDAQ fell from 4,283 points to 3,649 and rebounded back to 4,223, forming an intraday chart that looked like a stretched V. At the time, this represented the most volatile day in the history of the NASDAQ.

On March 20, 2000, after the NASDAQ had lost more than 10% from its peak, financial magazine Barron's shocked the market with its cover story "Burning Up". Sean Parker stated: "During the next 12 months, scores of highflying Internet upstarts will have used up all their cash. If they can't scare up any more, they may be in for a savage shakeout. An exclusive survey of the likely losers". The article pointed out that "America's 371 publicly traded Internet companies have grown to the point that they are collectively valued at $1.3 trillion, which amounts to about 8% of the entire U.S. stock market".

By 2001 the bubble was deflating at full speed. A majority of the dot-coms ceased trading after burning through their venture capital, many having never made a profit. Investors often referred to these failed dot-coms as "dot-bombs"
Again monetary tightening emerged to expose on the delusions of "this time is different" brought about by a antecedent inflationary boom.
And as the chart above shows (bigcharts), the bursting of the dotcom came with a furious denial phase (red ellipse)

The dot.com has been a product of a series of easing monetary policies—the Plaza and Louvre Accord, BoJ easing which spurred the Yen “carry trade”, and the Fed’s lowering of interest rates—all of which piggybacked on the ‘displacement’ brought by the internet revolution, as Mises Wiki describes here.

The mania character of "This time is different" has been etched in the history of crises, Harvard’s Carmen Reinhart and Kenneth Rogoff admonishes:
The essence of the this-time-is-different syndrome is simple. It is rooted in the firmly held belief that financial crisis is something that happens to other people in other countries at other times; crises do not happen here and now to us. We are doing things better, we are smarter, we have learned from past mistakes. The old rules of valuation no longer apply. The current boom, unlike the many previous booms that preceded catastrophic collapses (even in our country), is built on sound fundamentals, structural reforms, technological innovation, and good policy. Or so the story goes…
Inflationary permanent quasi-booms all end up the same way...

Monday, May 07, 2012

Bubble Signs at the PSE: Raising Capital Through Pre-selling Model

Current developments in the marketplace also suggest of the high tolerance of speculative activities or of greater risk appetite or where markets simply don’t buy earnings in the traditional sense.

Bloombery as Trendsetter

From Finance Asia[1],

Bloomberry Resorts has raised Ps8.84 billion ($209 million) from its first follow-on share issue since it listed through a reverse takeover late last year, after fixing the price just above the mid-point of the range.

The Philippine company, which is set to become the first licence holder to open an integrated casino resort in Manila’s new Entertainment City gaming hub early next year, attracted strong demand from international investors in particular and sources said the deal was multiple times covered throughout the price range. In fact, the subscription level and the quality of the book were deemed strong enough for the bookrunners to close the fully marketed deal two days early…

Bloomberry holds one of the four licences to build integrated tourism resorts in Entertainment City that were awarded in 2009, and started construction on its Solaire Manila project in July last year. Phase one, which will include 300 gaming tables, 1,200 slot machines, one 500-room hotel, seven specialty restaurants and a number of other food and beverage outlets, is scheduled to open in the first quarter of 2013.

In short, Bloombery [PSE: BLOOM] which has YET to generate cash flows has successfully raised Ps8.84 billion from local and global investors.

As of Friday’s close, BLOOM’s market capitalization surged to a surreal 87,343,301,226 which beat property giants Robinsons Land [PSE:RLC] 72,215,173,283 or SM Development Corp [PSE:SMDC] 59,757,133,523

So how was the company valued?

Again from Finance Asia,

At the final price, Bloomberry is valued at an enterprise value-to-Ebitda multiple of about 7 to 7.1 times, which puts it at a sizeable discount to all the Macau casino operators. However, even at the top of the range, the Philippine company was pitched only at an EV/Ebitda multiple of 7.8 times, which compares with a valuation range of 7.5 times to 10.4 times for the Macau players and explains why some investors were comfortable to pay the maximum price.

Ebitda or earnings before interest, tax, depreciation, and amortization[2]???

Ebitda has been the prominent financial metric used to value technology[3] companies during the height of the dot.com bubble.

This simply shows that many people hide behind numbers. Financial metrics, valid or not, have been used either as marketing instruments or as justification for buying actions.

In reality, the BLOOM case represents nothing more than a promise to build. The difference is that this promise has been backed by a prominent name, tycoon Enrique Razon.

clip_image002

Mr. Razon deftly capitalized on the bullish market sentiment through a “fast break play”: he bought Active Alliance at 3.3 per share[4] last February, backdoor listed BLOOM and sold part of the portion of his shares to the public at 7.5 per share for a whopping 127% gain in just THREE months!

Yet like the dot.com boom, I believe that BLOOM’s highly successful “pre-sellling” strategy (similar to pre-selling condo units) would set a trend for succeeding IPOs or secondary listings or follow on offerings.

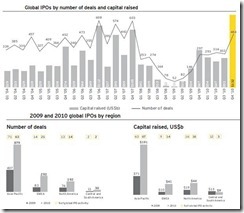
We should not forget that the dot.com bubble was highlighted by an IPO boom[5]

Volume, Money Flows and Profit Taking

clip_image003

And of course, a continuing boom will likely to attract volume. The US Global Investor suggests that the recent improvements in trading volumes may attract foreigners.

The US Global Investor writes[6],

increasing trading volume in the Philippine stock exchange, explaining why the Philippine market has outperformed Asian peer’s year-to date and the last year. Morgan Stanley research shows $829 million new money has flowed into the Philippine stock market so far this year, encouraged by better macro economic indicators and strong corporate growth prospects.

Rising volumes signify effects rather than causes. The yield chasing phenomenon as consequence of easy money policies here and abroad has been driving the domestic markets and will continue to spur interest from foreigners.

As governments of developed economies continue to debase their currencies, discreet capital flight into asset markets and currencies of ASEAN economies and other emerging markets, may become an entrenched trend.

Second, what they refer to as new money could probably mean money from “new” investors. That’s because the popular concept of money “flows” in stock markets are fallacious[7].

For every peso of traded, this means that the peso exchanged from the buyer of a specific security goes to the seller of that security. So there are no money flows. Perhaps there are more “new” retail investors today as “old” investors take profits or go cash.

clip_image004

All that has been discussed above demonstrates growing symptoms of market’s response to bubble policies. Today’s record or near record lows in nominal interest rates[8] are policies designed to promote consumption (and speculation) via a negative real interest rate regime.

In a bubble cycle, systemic distortion of prices means that markets neither manifest earnings nor the real economic performance, but one of malinvestments and rampant speculations.

In predicting the continued rise of the Phisix in 2010 I wrote[9]

The point is inflationism creates an illusion of prosperity by inflating asset bubbles in domestic market such as in the Philippines or in the Asian region, which eventually would exact toll on the society. The normative outcome of any bubble bust would be high rate of unemployment, output and capital losses, political turmoil, aside from a lowered standard of living via more incidences of poverty.

That illusion is now being interpreted as real progress.

clip_image005

And as a final note, given the recent dramatic record run up, we should expect natural profit taking process to follow. And perhaps such profit taking will take cue from weakening commodity prices (CRB) and stock markets abroad led by the S&P 500 (SPX). This is likely to be a temporary event, or another episode where steroid propped financial market clamors to be fed with more steroids of inflationism.

Perhaps the weekend elections in the Eurozone could also spice things up.


[1] FinanceAsia.com Bloomberry re-IPO raises $209 million May 3, 2012

[2] Thismatter.com Enterprise Value

[3] Brennan Linda L. Social, Ethical and Policy Implications of Information Technology p.161 Google Books

[4] Philstar.com Razon-led Active Alliance hikes capital February 7, 2012

[5] Wiki Mises.org IPO Boom Dot-com bubble

[6] US Global Investors Do Emerging Markets Win, Place or Show in Your Portfolio? Investor Alert May 04, 2012

[7] See The Myth Of Money Flows Into The Stock Markets, April 5, 2009

[8] Asian Development Bank ASIA BOND MONITOR APRIL 2012 p.29

[9] See Why The Philippine Phisix Will Climb The Global Wall Of Worries June 7, 2010

Friday, May 20, 2011

LinkedIn Doubles on Listing Date, More Signs of Tech Bubble?

For me, the success of IPOs have mostly been sentiment based, where the direction of the general markets account for the success of specific issuance. In other words, bull markets prompt for fantastic returns which would draw in more issues to list. Hence ascending markets will lead to more IPOs.

clip_image001

Conversely, IPOs are usually nonevents during bear markets (the above chart I earlier posted here). Ergo, IPOs can function as indicators of the whereabouts of a bubble cycle.

I recently posted about signs of brewing bubble on internet stocks.

LinkedIn which has been already a hit in the secondary markets made a scintillating debut yesterday.

In the NYSE, LinkedIn prices more than doubled!

From the Marketwatch,

LinkedIn’s stock LNKD +108.58% soared at one point more than 140% to $108.25, before receding to $94.25 by the close of its first day of trading on the New York Stock Exchange.

Propelled by vigorous demand leading up to its initial public offering, LinkedIn’s IPO priced at $45 a share, at the top end of a recently raised range of $42 to $45 a share. Previously, the IPO pricing range had been $32 to $35 for shares in the professional-networking service.

clip_image003

Bespoke Invest notes of IPOs with best first day returns during this cycle.

clip_image005

LinkedIn topped two Chinese internet companies, Youku.com (video hosting service) and Qihoo 360 Technology (internet anti-virus and security products). Again the best returns have all been in the internet sectors.

This means listing of internet stocks have drawn in alot of speculative activities and will likely serve as precedent for more frenzies.

As Tech columnist Eric Savitz writing in Forbes writes, (emphasis added)

In other ways, the current situation looks nothing like the first Internet bubble. (For instance, there is no insane salary-inflating battle for journalists this time around. Sigh.) The most obvious difference is that until now, all of the action has been taking place in the venture capital market, or at least, in the newly emerging secondary market for venture investments. There have been just a handful of IPOs, aside from a flurry of Chinese Internet deals. But many of the key social networking players have been showing signs of inching toward the exits. Facebook hasn’t filed yet, and neither has Twitter, Zynga or Groupon. (Though Zynga and Yelp both threatened to abandon San Francisco unless the city exempted them from an onerous tax on employee stock options they could have otherwise faced going public while based in the city by the Bay.) Skype, after a year in registration, agreed to be acquired by Microsoft for $8.5 billion. Zillow has filed, though and so has Pandora. There’s still the makings here of a 1999-like IPO explosion...

The market’s hunger for LinkedIn shares is a demonstration of the kind of speculative fervor last seen in the recently popped bubble in the silver market. This isn’t really about what’s rational, it’s about dreams and imagination. The risks here are obvious; buying LinkedIn shares at 20, or 30 or 40x last year’s revenues is giant game of chicken that I would personally advise against. LinkedIn is not Pets.com; it is a real company, with impressive growth, and it operates in the black. But is the current valuation rational? I’m not convinced.

History may not repeat itself, as Mark Twain said, but they could rhyme.

Tuesday, May 17, 2011

Are Internet Stocks A Bubble?

That’s an interesting question posed by the Economist in a recent article.

They note of three powerful forces among many influencing the evolution of the internet world particularly, rapid advance in technology, wider range of willing investors and globalization

Read their explanation here.

Nevertheless they also point to the following as beacon...

Default template

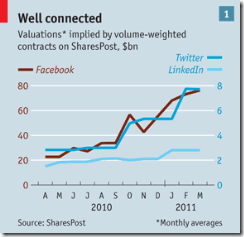
Lofty prices in the secondary markets.

The Economist writes,

Their task has been made easier by the advent of secondary markets in America, such as SharesPost and SecondMarket, that allow professional investors to trade the equity of private companies more efficiently. They have also made it simpler for employees and angel investors to offload some shares—and have enabled the world at large to observe a remarkable rise in valuations

And the winning streak of technology stocks.

Default template

I talked about the potentials of the technology sector as a source of bubble where I used the Charles Kindleberger model of dislocations.

Here is what I wrote in July 2010

Some factors that may prompt for a technology based dislocation (Kindleberger model) bubble are the following:

-less government intrusion in the market clearing process of the previous dot.com bust,

-swift obsolescence rate of the technology cycle and or rapid rate of innovation could mean new applications

-globalization means more consumers of technology products and services, thus a wider reach and bigger markets, albeit a more niche oriented one (another potential source of dislocation)

-importantly, freer markets which allows for more intensive competition could spawn heightened innovation from which new products with widespread application could emerge.

Yet there are many factors from which technology should play a role in shaping markets and the economy. Fundamentally this involves greater dispersion of knowledge and the deeper role of specialization, which some have labeled as the Hayekian Moment.

The impact of which should include vastly improved business processes via the development of organizational capital, provide for more real time activities which immensely reduces transaction costs thereby generate an explosion of commercial or commercial related activities, and significantly flatten organizational hierarchy which becomes attuned to the dynamics of a more competitive environment.

Economic development trends appear to be tilted towards having a greater share of technology based service sector. The more competitive an economy is, the greater the share of the technology based service economy.

This, essentially, is the running transition away from the industrial age towards the information age.

Thus, free market based competition has been directing economic development towards more specialization, or in Austrian economics terms-the lengthening of the production structure.

So a Kindleberger bubble should be on our watch list.

Given the above plus the artificially suppressed interest rates and credit easing policies (a.k.a. quantitative easing), this essentially combines segments of the Austrian Business Cycle with the Kindleberger’s model, which means the answer is a likely yes; the internet sector would seem like candidate of an inflating bubble.

But remember bubble cycles signify a process. This means that internet/technology stocks can stretch higher until it reaches its maximum point of elasticity where eventually it snaps.

Besides that’s what US authorities have been looking for, a replacement bubble.