
From Zero Hedge
More than three-quarters of Americans say the five-year bull market in U.S. stocks has had little or no effect on their financial well-being, according to a Bloomberg National Poll.Seventy-seven percent of respondents dismissed the 176 percent rise in the Standard & Poor’s 500 Index (SPX) since its March 9, 2009 financial crisis low, according to the poll, taken March 7-10. Barely one in five -- 21 percent -- said the market’s gains have made them “feel more financially” secure.
The poll’s findings reflect the concentration of financial assets among better-off Americans. About half of Americans own stock, either directly or through retirement accounts, according to the Fed’s 2010 Survey of Consumer Finances.Stock ownership that year fell to levels not seen “since the late-1990s,” the Fed said. Even those who participate in financial markets through 401(k) retirement plans often have only modest sums invested. Half of Fidelity Investments customers have less than $25,600 in their 401(k) accounts, according to Michael Shamrell, a spokesman…The wealthiest 10 percent of families earn 11 percent of their annual income from capital gains, interest and dividends, according to the Fed. The poorest three-quarters get less than 0.5 percent of their income from such sources.“Many moderate- and middle-income households have seen little benefit from recent stock market gains and are still grappling with the implications of home prices that, despite recent progress, remain well below their previous highs,” the White House economic team wrote in a March 10 blog post.
The poll also found continuing unhappiness with the direction of the country and ebbing optimism about the recovery’s staying power. By 62 percent to 30 percent, respondents say the nation is headed in the wrong direction.


The average bonus on Wall Street jumped 15 percent last year to the highest level since the 2008 financial crisis and was the third largest on record, New York State's budget watchdog said on Wednesday.The cash bonus pool swelled to $26.7 billion in 2013, pushing the average cash bonus to $164,530, a post-2008 high in a industry shrunk by the financial crisis, according to the New York state comptroller's annual estimate.


bank credit expansion under fractional-reserve banking (or "creation of counterfeit warehouse receipts") creates price inflation, loss of purchasing power of the currency unit, and redistribution of wealth and income. Euphoria caused by a pouring of new money into the economy is followed by grumbling as price inflation sets in, and some people benefit while others lose. But inflationary booms are not the only consequence of fractional-reserve counterfeiting. For at some point in the process, a reaction sets in. An actual bank run might set in, sweeping across the banking system; or banks, in fear of such a run, might suddenly contract their credit, call in and not renew their loans, and sell securities they own, in order to stay solvent. This sudden contraction will also swiftly contract the amount of warehouse receipts, or money, in circulation. In short, as the fractional-reserve system is either found out or in danger of being found out, swift credit contraction leads to a financial and business crisis and recession. There is no space here to go into a full analysis of business cycles, but it is clear that the credit-creation process by the banks habitually generates destructive boom-bust cycles
This marks a new era for advertisers. The days are over of Mad Men figuring out how to cajole or trick us into buying products through mushy psychological profiling of demographic groups. The new model is going to mean including buyers and sellers in more transparent conversations about a product's pros and cons.

Ms. Watkins said she plans to buy about 50 shares, which would add up to $1,250 plus any commissions if the stock prices at the top of its current price range, but could cost her more or less depending on what price she happens to get.She said she’s not worried about price increases; she just wants to stick to her purchasing plan and buy the shares immediately, though she hasn’t ruled out selling them quickly if there’s a sharp bump.Ms. Watkins said she’s interested in the hyped stock because of her economics-major nephew and because she knows what happened with Apple Inc. and Facebook Inc. prices and doesn’t want to miss out, even though the 140-character message service, often used on smartphones, is largely foreign to her.“I don’t even use it,” she said. “You know what kind of phone I’ve got? A pre-paid!”Ms. Watkins opened a TD Ameritrade account about four years ago, she said. She bought a few shares of stock in petroleum-related companies and was burned when the price fell through. She doesn’t trade now, relying on the mutual funds available through her employer to manage her nest egg.The avid Mother Jones reader doesn’t really trust the market and says it’s like gambling, but with the addition of lies and subterfuge.“I’m just buying because everybody’s talking about Twitter,” she said. “I’m just gonna take a chance.”
")
But the average man doesn't wish to be told that it is a bull or a bear market. What he desires is to be told specifically which particular stock to buy or sell. He wants to get something for nothing. He does not wish to work. He doesn't even wish to have to think. It is too much bother to have to count the money that he picks up from the ground.
Investors are buying up just about anything with a ticker symbol, and that frenzy certainly includes stocks that are brand new to the market.
The performance of IPOs is starting to hit the kind of feverish pitch not seen since the last market peak in 2007, and it even has hints of the IPO heyday of the 2000 dot-com boom. The signs:First-day pops. Container Store's first-day return is certainly one to remember, rising 101% from its $18 a share IPO price to $36.20 a share. Container Store was the fifth IPO to double in its first day of trading this year, the biggest year for 100% one-day jumps since 78 did it in 2000. Seeing stocks double on their first day has become rare. During 2012, just one IPO, a company named Splunk, doubled on its first day, said Jay Ritter, professor of finance at the University of Florida. No IPOs doubled on their first day in 2009, 2008 or 2007, Ritter said. IPOs on average have gained 16% on their first day this year, Renaissance said, the highest in at least a decade…Already this year, 182 companies have seen their shares start trading, up 50% from this point last year, said Renaissance. This coming week week of 11/4, 10 IPOs are expected to hit the market, including the much-anticipated online message service Twitter. At the current pace, there could be 220 IPOs in 2013, making it the busiest year for IPOs since 2000 by topping the 217 deals in 2004, Renaissance said.


If US stocks continue with its record breaking streak, then we should also expect IPO activities to follow.Nonetheless IPOs can also serve as beacon to important inflection points of stock markets.
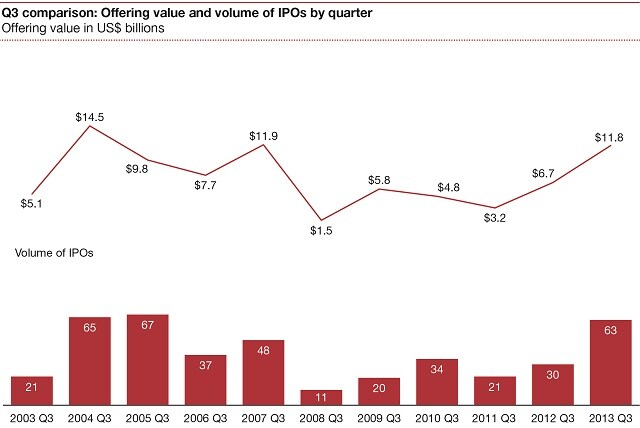
U.S. companies are on track to raise the most money through initial public offerings since before the financial crisis, driven by the same thirst for risk among investors that has pushed the stock market to new highs.Already this year, 64 U.S.-listed public offerings have raised $16.8 billion, according to Dealogic. In the same period in 2012, the biggest year in dollars since the financial crisis, 73 companies raised a total of $13.1 billion. Last week alone brought 11 U.S.-listed IPOs, making it the busiest week for such deals since December 2007.A more robust IPO market is seen as a potential boon for the economy because it allows companies to raise money that can be used to reduce debt or invest in their businesses. Sellers of stock such as private-equity or venture-capital firms can trim or shed their current holdings, return money to their investors, such as pension funds, and turn their attention to new investments.Behind this year’s pace is an ebbing of the wild price swings that had been a dominant feature of the stock market since the financial crisis, according to investors, companies and bankers. Instead, stocks have been on a steady grind higher. As markets reach new records, investors are taking chances on shares of new public companies.


At a current level of 5.24%, investors have never been paid less to own high yield debt. Yields are so low, in fact, that five years ago the yield on the 10-Year US Treasury was higher than the current yield on junk bonds. In the chart, the red dots on the blue line represent periods going back to 2000 where the yield on the 10-year US Treasury was higher than the current yield on the High Yield Master Index. With yields this low, high yield bonds are anything but high yielding.

![clip_image002[4]](https://blogger.googleusercontent.com/img/b/R29vZ2xl/AVvXsEh3SzgS1x9FfNlQP9tm21_KckQRToI_qRHFfMFLQop4DYSq8I8cYtUk7QAwbeUHdlFcsKhdhTWx9Mg_xqiirvnduVoXbHkqEWbI6r0P3Vhm4SnIoQhl-TGqjYMSmrb1rIjCS96N/s1600-h/clip_image002%25255B4%25255D%25255B2%25255D.png "clip_image002[4]")
![clip_image003[4]](https://blogger.googleusercontent.com/img/b/R29vZ2xl/AVvXsEivWYuZ25mr32uLF_rVVFARSO2AkunynLWnN4OOyDLXLdY0ptnZry15TLlKEso42JRx-TXw7E11LcYY-MRZBtgNIcWdC9ZdPh1suZO60ExOUt9I8vlhrNDrphd0hug_CPaoXDOB/s1600-h/clip_image003%25255B4%25255D%25255B2%25255D.png "clip_image003[4]")
Current developments in the marketplace also suggest of the high tolerance of speculative activities or of greater risk appetite or where markets simply don’t buy earnings in the traditional sense.
Bloombery as Trendsetter
From Finance Asia[1],
Bloomberry Resorts has raised Ps8.84 billion ($209 million) from its first follow-on share issue since it listed through a reverse takeover late last year, after fixing the price just above the mid-point of the range.
The Philippine company, which is set to become the first licence holder to open an integrated casino resort in Manila’s new Entertainment City gaming hub early next year, attracted strong demand from international investors in particular and sources said the deal was multiple times covered throughout the price range. In fact, the subscription level and the quality of the book were deemed strong enough for the bookrunners to close the fully marketed deal two days early…
Bloomberry holds one of the four licences to build integrated tourism resorts in Entertainment City that were awarded in 2009, and started construction on its Solaire Manila project in July last year. Phase one, which will include 300 gaming tables, 1,200 slot machines, one 500-room hotel, seven specialty restaurants and a number of other food and beverage outlets, is scheduled to open in the first quarter of 2013.
In short, Bloombery [PSE: BLOOM] which has YET to generate cash flows has successfully raised Ps8.84 billion from local and global investors.
As of Friday’s close, BLOOM’s market capitalization surged to a surreal 87,343,301,226 which beat property giants Robinsons Land [PSE:RLC] 72,215,173,283 or SM Development Corp [PSE:SMDC] 59,757,133,523
So how was the company valued?
Again from Finance Asia,
At the final price, Bloomberry is valued at an enterprise value-to-Ebitda multiple of about 7 to 7.1 times, which puts it at a sizeable discount to all the Macau casino operators. However, even at the top of the range, the Philippine company was pitched only at an EV/Ebitda multiple of 7.8 times, which compares with a valuation range of 7.5 times to 10.4 times for the Macau players and explains why some investors were comfortable to pay the maximum price.
Ebitda or earnings before interest, tax, depreciation, and amortization[2]???
Ebitda has been the prominent financial metric used to value technology[3] companies during the height of the dot.com bubble.
This simply shows that many people hide behind numbers. Financial metrics, valid or not, have been used either as marketing instruments or as justification for buying actions.
In reality, the BLOOM case represents nothing more than a promise to build. The difference is that this promise has been backed by a prominent name, tycoon Enrique Razon.
Mr. Razon deftly capitalized on the bullish market sentiment through a “fast break play”: he bought Active Alliance at 3.3 per share[4] last February, backdoor listed BLOOM and sold part of the portion of his shares to the public at 7.5 per share for a whopping 127% gain in just THREE months!
Yet like the dot.com boom, I believe that BLOOM’s highly successful “pre-sellling” strategy (similar to pre-selling condo units) would set a trend for succeeding IPOs or secondary listings or follow on offerings.
We should not forget that the dot.com bubble was highlighted by an IPO boom[5]
Volume, Money Flows and Profit Taking
And of course, a continuing boom will likely to attract volume. The US Global Investor suggests that the recent improvements in trading volumes may attract foreigners.
The US Global Investor writes[6],
increasing trading volume in the Philippine stock exchange, explaining why the Philippine market has outperformed Asian peer’s year-to date and the last year. Morgan Stanley research shows $829 million new money has flowed into the Philippine stock market so far this year, encouraged by better macro economic indicators and strong corporate growth prospects.
Rising volumes signify effects rather than causes. The yield chasing phenomenon as consequence of easy money policies here and abroad has been driving the domestic markets and will continue to spur interest from foreigners.
As governments of developed economies continue to debase their currencies, discreet capital flight into asset markets and currencies of ASEAN economies and other emerging markets, may become an entrenched trend.
Second, what they refer to as new money could probably mean money from “new” investors. That’s because the popular concept of money “flows” in stock markets are fallacious[7].
For every peso of traded, this means that the peso exchanged from the buyer of a specific security goes to the seller of that security. So there are no money flows. Perhaps there are more “new” retail investors today as “old” investors take profits or go cash.
All that has been discussed above demonstrates growing symptoms of market’s response to bubble policies. Today’s record or near record lows in nominal interest rates[8] are policies designed to promote consumption (and speculation) via a negative real interest rate regime.
In a bubble cycle, systemic distortion of prices means that markets neither manifest earnings nor the real economic performance, but one of malinvestments and rampant speculations.
In predicting the continued rise of the Phisix in 2010 I wrote[9]
The point is inflationism creates an illusion of prosperity by inflating asset bubbles in domestic market such as in the Philippines or in the Asian region, which eventually would exact toll on the society. The normative outcome of any bubble bust would be high rate of unemployment, output and capital losses, political turmoil, aside from a lowered standard of living via more incidences of poverty.
That illusion is now being interpreted as real progress.
And as a final note, given the recent dramatic record run up, we should expect natural profit taking process to follow. And perhaps such profit taking will take cue from weakening commodity prices (CRB) and stock markets abroad led by the S&P 500 (SPX). This is likely to be a temporary event, or another episode where steroid propped financial market clamors to be fed with more steroids of inflationism.
Perhaps the weekend elections in the Eurozone could also spice things up.
[1] FinanceAsia.com Bloomberry re-IPO raises $209 million May 3, 2012
[2] Thismatter.com Enterprise Value
[3] Brennan Linda L. Social, Ethical and Policy Implications of Information Technology p.161 Google Books
[4] Philstar.com Razon-led Active Alliance hikes capital February 7, 2012
[5] Wiki Mises.org IPO Boom Dot-com bubble
[6] US Global Investors Do Emerging Markets Win, Place or Show in Your Portfolio? Investor Alert May 04, 2012
[7] See The Myth Of Money Flows Into The Stock Markets, April 5, 2009
[8] Asian Development Bank ASIA BOND MONITOR APRIL 2012 p.29
[9] See Why The Philippine Phisix Will Climb The Global Wall Of Worries June 7, 2010
There has been an explosion of IPOs in emerging markets, particularly in Asia.
According to Globe and Mail (graph included)
Globally, July IPOs totalled $30.5-billion (U.S.), according to Thomson Reuters, the highest value since November, 2007. The Asia-Pacific region benefited most from the boom, buoyed by Agricultural Bank of China Ltd.’s $20.8-billion IPO. Not only did AgBank garner strong demand, the offering was ultimately upsized.
Since January, the Asia-Pacific region, excluding Japan, has raised almost $136-billion (U.S.) in IPOs and follow-on offerings, according to Thomson Reuters, while the United States has raised $67-billion. Investors can only wonder why North America has been so tepid while Asia is so hot.
Exploding IPOs, for me, are symptoms of brewing euphoria, which are mostly in response to policies. The rate of increases provides significant clues to the transitioning phases of a bubble cycle. See earlier discussion What Agricultural Bank of China’s IPO Should Imply For Asian Financial Markets
The issue of concern here isn’t a liquidity drain. For every buyer there will always be a seller. Thus, liquidity (money) is transferred from buyer to seller.
The issue is here is euphoria, artificially bolstered demand from policy impetus that forces the public to (decrease savings) increase risk appetite and chase yields, thereby distorting relative price levels of financial securities, the fostering malinvestments (in the real economy) and the attendant speculative orgies.
The primary reasons why Asia outperforms or has gained significant traction from such policies as earlier stated here has been because of huge savings, less systemic leverage, and a largely unimpaired banking system.
Of course, many real economic reasons provide for the other “rationalization”. Think regionalization, urbanization, wealth transfer etc... But they are secondary forces.
Importantly, in a world of globalization, global funds tend to seek out the best performers, which is emblematic of the ‘bandwagon effect’, as Templeton’s Mark Mobius writes,
In general, institutional pension funds’ exposure to the emerging markets asset class averages around 3% to 8% of their portfolios. From a pure market capitalization perspective I think that they are severely underweight in the asset class, as emerging markets stocks account for more than 30% of the world’s total market capitalization. We anticipate seeing some shift of institutional allocations to this asset class. Consequently, we believe institutional investors could fuel further demand for emerging markets equities.
...and that there would be numerous carry trade or arbitrage opportunities, from the fast emerging divergent monetary policies which could be channelled from currencies to bonds and could find its way to these IPOs and fuel more of this bubble like phenomenon.
I don’t think that Asia’s IPOs has reached a scale of bubble proportions to the point of implosion. Not yet anyway. Perhaps we could still be far off. But these constitute one of the many signs that we are headed in that direction.
P.S. As per the Philippines an IPO boom has yet to materialize.
The world’s largest IPO will reportedly be launched in China next week.
According to the Economist,
``THE initial public offering of Agricultural Bank of China, the country's third-largest bank, looks set to become the biggest IPO on record. On July 6th and 7th the bank raised a reported $19.2 billion in a dual listing on the Shanghai and Hong Kong stock exchanges. If the bank takes up a further 15% allotment of shares, that would value the deal at a total of $22 billion, slightly more than the offering in another Chinese bank, ICBC, in 2006. In the 1990s telecommunications was the investors' choice but in the last decade the biggest IPOs have been mostly in the financial sector, and mainly of Chinese banks”
Hong Kong, whom dominated world IPOs in 2009, will be eclipsed by China’s state-owned Agbank’s IPO.
According to USA Today,
``In 2009, Hong Kong was the world's largest IPO market, with companies raising a combined $32 billion in capital, according to Dealogic, a data-tracking firm. This year, China is on track to assume the mantle, with $31.7 billion raised by early July.
``The reason for these markets' strong performance amid a tepid global environment: "Investors are looking to put their funds in high-growth regions, and the financial tsunami" has affected growth in Europe and the U.S., says Edward Au, southern China regional leader in Deloitte's National Public Offering Group. (Deloitte is an auditor for AgBank's IPO.)
``AgBank's dual listing in Shanghai and Hong Kong could raise as much as $22.1 billion if an option is exercised to boost the number of shares for sale. This would break a $21.9 billion world record set in 2006 by Industrial & Commercial Bank of China.
``Monday, AgBank will also begin offering an undisclosed number of shares to Japanese investors, says Kenji Yamashita, a spokesman for Nomura, one of AgBank's lead offering coordinators in Japan.”
None the less, the changes in the global IPO market dynamic, as shown above from Renaissance capital, suggests that most of the capital raising activities have now been directed towards Asia.
In other words, Asia has seized the leadership and that global capital may accelerate inflows to Asia, despite doom and gloom predictions from mainstream experts.
The Agbank offering comes amidst the tinges of the unresolved transition from China’s bear market cycle.
The bear market seen in the China’s Shanghai index [upper window] (Bloomberg), emerged in the backdrop of an economic growth slowdown amidst the global financial crisis. China’s official growth figures fell by half 13% to 6.2% [lower window] but conspicuously escaped a recession (tradingeconomics.com).
Yet as I have been propounding; why should the Shanghai Index collapse by 71%, even more than the US markets, when she has eluded recession unlike the US?
From here we have explained that ‘fundamentals’, which has been the deeply entrenched mainstream wisdom, do not sufficiently ‘rationalize’ market activities, as the latter have been more influenced by liquidity flows (or my Machlup-Livermore paradigm).
Yet, from such premises, despite the heavy demand for Agbank share, the success of Agbank’s IPO listing isn’t clear, considering that China has been tightening in order to prevent an overheating or a bubble from running berserk.
Yes, the Shanghai index has bounced off strongly up (3.69%) from the dive (6.66%) during the previous week and could be work favorably to Agbank’s advantage.
Asian IPO’s have generally been well received this year (Reuters) and most likely the Agbank’s one day performance could also register a positive return.
But measuring IPOs for one day performance would appear equivalent to betting on a horse race-an inappropriate approach for serious or prudent investors.
Nevertheless IPO activities are one of the major indicators for bear markets.
And this has been accurately pointed out in July of 2007, see The Prudent Way To Profit From IPOs!, where in terms of Philippine based IPOS (upper window) surged.
And this appears to be same trend for global markets, as seen in the lower window (renaissance capital) as the boom climaxed.
Even as Asia today has commanded the biggest share of IPO activities (renaissance capital) it doesn’t automatically imply that Asian markets are in “bubble proportions”.
IPO activities in 2009 haven’t even surpassed the previous highs. And even if Asian IPOs do exceed the 2006 highs, other indicators will need to be scrutinized to ascertain the risk of bubbles.
All these suggest of the following:
-a deepening and growing sophistication of financial markets (of course, it could also mean a bubble)
-reduction of the excessive reliance of financial intermediation away from the banking system
-competition should bring about pricing efficiency, expanded accessibility and lower transaction costs which should enhance structural economic growth
-more emergent signs of decoupling
-relative higher equity returns are likely to put Asia on top of the heap and attract more capital flows
-as capital would likely to chase higher relative returns, IPOs activities in Asia are would likely to experience a feedback loop mechanism—high returns lead to more IPOs and vice versa--at the risks of fostering bubble conditions.
IPO activities represent as one critical indicator of capital market development and bubble activities.


