Truth does not become more true by virtue of the fact that the entire world agrees with it, nor less so even if the whole world disagrees with it—Moses Maimonides, philosopher
Inflation in the Eyes of Meralco’s Sales
Though publicly listed energy distribution firm Meralco [PSE: MER] covers a franchise of only 3% of the total land area of the Philippines (specifically, 38 cities and 73 municipalities), it is responsible for 55% of the country's electricity output. It is the only electricity provider in Metro Manila. Meralco is an example of a private-sector monopoly secured by a 25-year franchise from the government (Republic Act No. 9209).
This short article demonstrates the relationship between Meralco's power output and other economic indicators, specifically inflation.
Figure 1
Q1 2023 GDP slipped to 6.4%.
But this slowdown has not been apparent in the firm's energy sales, which grew by a brisk 22.9% YoY but was substantially lower than its recent peak of 40.9% in Q4 2021. Electricity sales in pesos have decreased in the last three quarters. (Figure 1, upper chart)
In the context of sales output, its GWh (Gigawatt hours or 1-billion-watt hours) growth slid to only 2% in Q1 2023, marking a third consecutive quarter of decline. GWh YoY growth spiked by 18.8% and climaxed in Q2 2021. (Figure 1, lower chart)
Since Q2 2021, sales in the peso have outpaced GWh in "nominal" and YoY change.
The difference between output and peso sales or its spread represents the "money illusion"—or what has been popularly labeled as "inflation."
Figure 2
The initial spike in global oil prices has pushed MER's spread higher, which should signify the "external" factor of influence. (Figure 2, upper window)
But the spread wouldn't have lasted had credit (money) remained stable. Instead, banks aggressively lent to the households. The fresh infusion of money pushed the "spread" higher, or sales in pesos grew faster than in GWh. (Figure 2, pane)
Figure 3
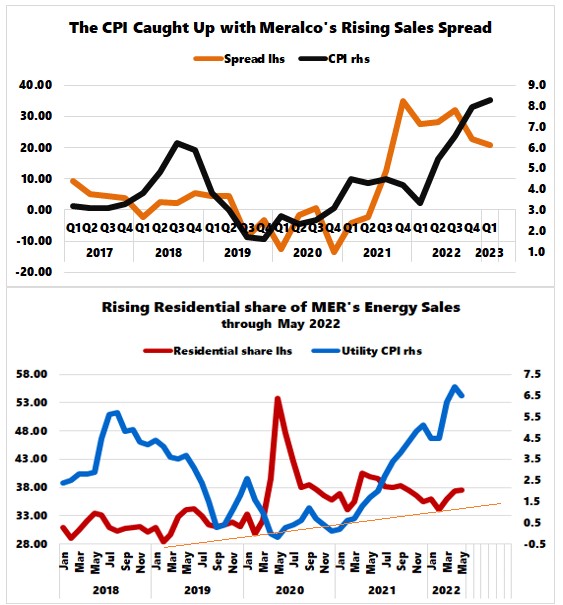
With a time lag, the rising spread caught up with the headline CPI. (Figure 3, upper chart)
Since 2018, the residential share of Meralco's energy sales (BSP data: in million Kwh-through May 2022) has been on an uptrend. The economic shutdown in March 2020 accelerated this transformation.
The combined factors of rising oil prices, strengthening bank credit, and pandemic "stay-at-home" policies also helped boost the sales spread, which the PSA's utility—housing, water, electricity gas & other fuels—CPI manifested. (Figure 3, lower chart)
Figure 4
The thing is, the trailing correlation between Meralco's spread and the headline GDP extrapolates to an economy powered by rising prices than output. (Figure 4, upper chart)
To wit, the economy recoiled furiously from the forced shutdown in response to the pandemic. Eventually, as the economy "reopened," credit-fueled inflation (via bank credit) and deficit spending functioned as their engines.
Also, households began to solidify their rising share of energy use.
But with oil prices and credit growth seemingly rolling over, the slowing sales spread should eventually filter into the headline CPI and the GDP.
Finally, seasonal factors should come into play in Q2.
Since 2016, Q2s have consistently bounced from a weak Q1.
But the Q1 2023 shrinkage in Q-o-Q signified the worst since Q1 2019.
Long story short, we should expect a rebound in GWh output in Q2.
Sure, the sweltering heat of summer may prompt a substantial increase in aircon usage.
However, unless supported by vigorous productivity or credit growth, the strength of sales recovery may not be similar to the previous episodes, and spending here may come at the expense of other factors in the GDP.


No comments:
Post a Comment