In individuals, insanity is rare; but in groups, parties, nations and epochs, it is the rule. - Friedrich Nietzsche
In this issue:
Phisix 20th Record Close: Facts and Fantasy
-Record Phisix 7,800: Rigging of the Index has now become a Daily Affair
-Record Phisix is as Symptom of Inequitable Transfers; Poverty Surges in 2014!
-Priced In USD, the Phisix Still Has to Beat 2013 Highs
-Contagion Risks; More on Why Basel Standards are Flawed
-The Different Hats of the BSP Chief
-Record Phisix 7,800: Benjamin Graham and David Dodd’s View of Overvalued PERs
-US Treasury’s OFR Warns on US Stocks! BOE Sounds Financial Instability Alarm as Four Central Banks Cut Rates!
Phisix 20th Record Close: Facts and Fantasy
20th record close. Amazing.
The Philippine Stock Exchange crows and rationalizes feat to[1]: The country's benchmark index closed ahead of its Asian counterparts as investors anticipate positive earnings results from more companies for the full year 2014. Investor confidence in our listed companies continues to sustain the upward trajectory of our market
There are many more things that meets the eye than what has been countenanced.
Record Phisix 7,800: Rigging of the Index has now become a Daily Affair
Every single session over the past week has been become handiwork of index managers!
In other words, rampant violation of the SEC regulation code has hallmarked the record Phisix. (charts courtesy of colfinancial)
Let me further add of the remarkable accounts of “marking the closes” of last Tuesday (March 24) and Thursday (March 26).
Last Tuesday (left), profit taking mode dominated the entire session. The Phisix traded at a range of about .4 to .5% lower than the previous day’s close. That’s of course until the last minute, where a three sector pump virtually erased two-third of the index’s loss of the day!
And following a sharp decline in the US markets Wednesday, most of Asia carried over the sentiment last Thursday.
Yet similar to the previous three accounts of global selloffs, particularly, January 6, 2015, December 15, and October 16, 2014, index managers went into operations early in the morning to engage in what I call as “panic buying”. The panic buying amidst the selloff pushed the Phisix into positive territory (right). The index managers ensured that the day ended with oomph: The Phisix posted a .44% gain even as the entire Asia was almost in the red!
The objective appears to have been designed to show the Phisix as becoming independent or decoupled from the world! Phisix as superman!
The peculiar thing is that Phisix has just 6.5% above 7,400 yet manipulations have become so increasingly flagrant.
You see corrections have become impermissible. Charts are being deliberately drawn. This has been more than just a sign of hysteria, the rigging of the Philippine stock markets have become shamelessly and notoriously regular or routine.
The Phisix can’t stand on market forces alone without being rigged? The record Phisix needs false legs from unseen faces as props? Why?
And this is what constitutes record Phisix? A record which PSE officials pat on their backs?
Record Phisix is as Symptom of Inequitable Transfers; Poverty Surges in 2014!
The PSE doesn’t say that how such improprieties have been brazenly operating under their noses. And neither have there been any seeming attempt to address these infractions.
Of course, given that record Phisix benefits the establishment, I would expect that the PSE to just look elsewhere or keep a blind eye on current developments, and instead, rationalize current events to other seemingly plausible factors so as camouflage such unscrupulous actions taking place. And this is what has been happening.
For one, record Phisix which is a product of financial repression paints a popular notion that this has been about G-R-O-W-T-H.
Doing so enables and facilitates the government’s easy access to credit—directly (lowers bond yields, high demand for local currency and foreign currency government bonds) and indirectly (foreign capital flows, perceived lesser risks, credit upgrades, increased taxes from bubble sectors and etc…).
And because financial repression generates a credit fueled boom for both the government and for the formal sector with access to credit, the boom not only spawns instant gratifications for these sectors, but such translates to high popularity ratings for the administration. Popularity ratings thus pave way for government actions or government pet projects in the name of public welfare via infrastructure (PPPs), welfare or defense projects.
Second, since financial repression embodies an invisible transfer of resources from the public to the government indirectly channeled through institutions owned by the politically connected financial elites, the latter institutions has become secondary major beneficiaries.
Such boom has allowed these politically privileged institutions to absorb resources and likewise transfer risks from their undertakings to the public.
For instance, 30 companies has corralled 89% of the Php 675.2 billion local currency corporate bond markets as of 4Q 2014 (4Q ADB Bond Monitor) where a vast majority of them, whether listed or not (most have been listed), are owned or controlled by the elites. Think of the numerous hapless and gullible depositors whom have extended financing to these companies with measly returns* at the cost of potential credit risks!
*Measly returns could even be exaggerated. That’s because many of the recent coupons issued hardly offers any real returns—I mean real inflation and NOT statistical inflation adjusted returns.
Yet a lot these bond financing has been coursed through financial intermediaries owned by the elites. Go to a bank and ask for long term deposits, you will most likely be offered with bonds from their clients or their affiliated institutions.
All these benefits that accrue the elites have been owed to negative real rates–zero bound –financial repression policies.
Yet the same elites have graced the flamboyant list of world’s wealthiest where most of their wealth has been derived from equity ownership.
And since the same sectors have been in control over media, the onslaught campaign in support of the credit financed mania
So here is simple anecdote of how the modus works. Project a boom (with the help of media and supply side). Let the public manically bid up on ridiculously overvalued assets (real estate and stocks, previously bonds) financed by credit due to negative real rates. Let asset managers create a sustained imagery of the boom through manipulation of the various indices and markets. Then companies of the elites absorb the public’s resources in exchange for rates that hardly covers real inflation rates while at the same time shifting the burden of risk to the public (via issuance of bonds and preferred shares, listing of secondary IPOs and etc. at free lunch rates or prices).
The elites then send their money overseas, perhaps to hedge their holdings, thus the seeming capital flight from local residents in 2014.
The elites then reward themselves with titles to the prestigious list of the global elite class.
Thus record Phisix has been a symptom of such inequitable transfers. Yet today, such symptoms are being conducted desperately through market manipulation.
And speaking of inequitable transfers, I have written in the past how inflationism has signified an economic drag to the underprivileged. This has been expressed via self-rated poverty sentiment which has ballooned as money supply growth zoomed to 30%+ in 2014[2].
The so-called “transformational boom” has been prompting for an UPWARD trending self-diagnosed poverty. The implication from the above chart is that a large segment of the Philippine society has been paying the price for the benefit of a few. It would be misguided to say these groups have been “excluded” from growth, because it is precisely their resources that have been funneled to subsidize industries from financial repression policies or facilitated through the “continuing process of inflation”.
Yet the much ballyhooed boom in 2014 has paradoxically led to a rise in poverty!
Writing at the Inquirer, pollster Mahar Mangahas of the Social Weather Station (SSS) confirmed what I suspected[3]. (bold mine)
The rise of poverty last year reminds us yet again that growth in the Gross National Product, of itself, does NOT improve the lot of the poor. The so-called “growth elasticity of poverty”—see “Naive projection of poverty (Opinion, 1/24/2015)—that the World Bank read into the 2013 fall of poverty failed to operate in 2014.Yes, there was growth in 2014S1 in the money incomes of the lower classes, said Dr. Balisacan, but it was overpowered by the inflation of prices of things the poor need. The inflation facing the poor is stronger than average inflation. In particular, the price of rice is needlessly high, because of the import monopoly of the National Food Authority. This monopoly should be abolished.
It’s nice to see Mr. Mangahas punctuate his message with an all caps “the Gross National Product, of itself, does NOT improve the lot of the poor”.
GNP and GDP are nothing but accounting identities or tautologies. They hardly represent the real economy. This especially has been amplified for the Philippines which has a large informal sector. The growth stories have been accounted for by the major beneficiaries of invisible redistribution.
Mr Mangahas even goes on to say that inadequacies of statistics and surveys extrapolates that “the new official poverty rates are understatements.” (italics mine)
Wow. And I thought I was alone.
Yet sustained manipulation of the Phisix will NOT expunge the evils of invisible political transfers.
Nevertheless regardless of its iniquities such dynamic isn’t sustainable. And manipulation of the index has simply been signs of desperation to perpetuate a flawed system.
Priced In USD, the Phisix Still Has to Beat 2013 Highs
There is another thing that the Philippine Stock Exchange didn’t say.
True, in peso terms the Phisix have been at a record.
But since about 15% of the domestic equity market has been held by foreigners, this means foreigners will look at the Phisix in US dollar terms.
In the context of the Phisix in US dollars, record highs have yet to be established.
The above chart represents a reconstruction of the closing prices of the Phisix, calculated based on the USD-peso exchange rate since mid 2012
Let us measure today’s record high with the 2013 high
The previous record by the Phisix in May 15, 2013 was at the closing prices of 7,392.2.
Then the equivalent USD-Php exchange rate was at Php 41.2. So dividing the Phisix with the exchange rate would give us a USD Phisix at 179.42.
Friday’s (May 27th) record close was at 7,877.96. The US Peso exchange rate of that day was at 44.76; hence, this gives us a US dollar calculated Phisix at 176.00.
If we juxtapose the records of May 2013 179.42 and Friday May 27 at 176 and compute for their variances, then we get a difference of 1.9%. This means that the US dollar Phisix has gap of 1.9% to fill—in order to equal the May 2013 highs.
And the only way for the 1.9% gap to get bridged is for the Phisix to rise faster than the falling peso or the peso stops fumbling.
Contagion Risks; More on Why Basel Standards are Flawed
Yet a stronger peso doesn’t seem to be a likely path.
In a recent speech[4], the Bangko Sentral ng Pilipinas Chief Amando Tetangco Jr. AGAIN reiterates the same 3 risk factors in his previous deflation spiel as risk to the current environment, particularly “1) the uneven global economic growth; (2) the uncertainty of the oil price path and the ambiguity of the underlying drivers of the oil price decline; and (3) the resulting divergence in monetary policy stance among major advanced economies”, and how these would influences the domestic markets and the economy
In the last year and a half, these factors have manifested themselves in the movement of global capital into US assets (away from core Europe and emerging markets), an appreciating trend in the US dollar and a decline in global long-term interest rates. The rebalancing in global portfolios, as funds search for better yields, has surfaced in our domestic financial markets as volatility in the peso/dollar exchange rate, and in the local bond and equity markets.Going forward, should the uneven global growth scenario persist, we may see this translate into more pronounced changes in trade patterns.
Contra the mainstream belief that the Philippines can decouple, it appears that the BSP chief understands that there will be transmission mechanisms that will likely lead to linkages in terms of financial asset and economic performance.
Let me cite an example the latest IMF report on Indonesia’s risk[5].(bold mine)
Corporate sector performance is showing signs of strain on the back of slowing economic growth and rising funding costs. Overall profitability and debt servicing capacity of listed companies in Indonesia have weakened. On the former, the return on assets fell slightly to 14.7 percent in the first three quarters of 2014, still high relative to international peers. On the latter, the share of companies with income insufficient to cover interest expenses increased to 21 percent in 2013, while the share of debt of these companies jumped to 30 percent—in excess of its peak in 2008. Stress appears more concentrated in the resources sector as a result of sluggish mining activities and falling commodity prices.Pockets of vulnerabilities exist owing to rising corporate indebtedness, increasing concentrated leverage and corporate insolvency, and unhedged foreign currency debt.· Corporate debt has increased rapidly in recent years, reaching 34 percent of GDP as of end September 2014 (latest figures available) compared to 23 percent at end 2010, in part spurred by easy financial conditions in the aftermath of the global financial crisis. About 45 percent of the increase in corporate debt was financed by borrowings from abroad. Corporate external debt was US$118 billion (around 15 percent of GDP) at end September 2014—up by US$66 billion since end 2010, although about 60 percent of this increase was either FDI-related (i.e., financed by parent or affiliated entities) or incurred by state-owned enterprises (SOEs). The greater reliance on external funding could also pose a refinancing risk, possibly exacerbated by major corporate distress, with about US$10 billion of bond and syndicated loans maturing in 2015.· Concentrated leverage at highly indebted companies has also increased, coupled with rising corporate insolvency. Companies that were already highly indebted became even more indebted over the past few years, despite only a marginal increase in system-wide average leverage ratios. This concentration is seen in the aggregate debt-to-assets ratio of listed companies (weighted by individual companies’ outstanding debt), which has increased substantially to a level near its peak in 2009. In addition, the share of listed companies with negative equity has risen sharply, indicating potential for more widespread corporate defaults.· Exposure to foreign exchange (FX) risk is not negligible. About half of corporate debt is denominated in foreign currency. Although around 70 percent of non-SOE foreign currency debt is estimated to have been incurred by companies with FDI-related funding and/or with FX cash flows, some companies are still subject to FX risk.1 A large rupiah depreciation could significantly undermine balance sheets of companies with inadequate hedging of their FX exposure, with market reports also suggesting that most hedging now in place will knock out at specific levels of the exchange rate
Yet despite the substantial buildup in Indonesia’s credit risk profile, ironically the IMF still expresses confidence that their banking sector will remain resilient “given strong capital buffers”.
I don’t share that confidence.
That’s the USD-Indonesian ringgit.
The ringgit has been taking it to the chin and now has crashed to record levels. Question now is: To what extent will the current ‘capital buffers’ hold in the prospect of a sustained US dollar juggernaut vis-à-vis the ringgit??? Where is the breaking point for the system to snap?
If Indonesia’s system wilts and eventually cracks how will this affect the entire region? Do the big bosses of the BSP and their hordes of economists know?
In the above speech by the BSP chief he notes that Basel 3 serves as the Philippine banking system’s regulatory “primary safety net” but this hasn’t been the only standard.
Curiously the BSP chief generalizes that “the quality of loans has been improving, with NPLs continuing to fall”.
Really?
Does the above exhibit the validity of the above claim where the banking system’s “quality of loans has been improving”?
Based on SMC’s full year 2014 Investor’s presentation, long term debt bulged by Php 32 billion to Php 483 billion while profits grew by only 28.1 billion!
SMC supposedly declares itself to be a profitable company, but debt continues to massively mount despite recent major asset sales (e.g. Meralco and PAL), why? Whatever happened to the proceeds of the asset sales? These have been spent on corporate expansions, rather than paying down debt? Why? Yet are these expansions guaranteed to deliver the much needed cash flows to eventually bring down these huuuuggggeeee debt levels?
Or has it been that profits have merely represented intracompany juggling of accounting numbers? Or has it been that stories have to be made to bewitch the public to sustain what has been SMC’s core method of financing: borrowing IN borrowing OUT or what the late Minsky calls the Ponzi finance?
In term of relative proportions, do you how big Php 483 billion is? It’s not just a number.
Well based on BSP data, as of December 2014, the Philippine banking system’s total resources has been calculated at Php 11.159 trillion. This means SMC’s 2014 debt has been equivalent to around 4.3% of the entire banking system!
As caveat, of course, not all of SMC debt has been from domestic banks (some are from bonds and some are foreign banks and financial institutions). Also the above data covers long term debt and hardly the short term ones which are also sizeable.
So what happens if Indonesia’s financial conditions shatters? Will capital flight be limited to Indonesia or will it spill over to the region and to the Philippines? If the latter, how will these affect the heavily levered domestic companies like San Miguel?
Again do the big bosses of the BSP and their hordes of economists know? Or is SMC the local equivalent of the US too big to fail or Systemically important financial institution where the BSP has already covert rescue plans for them?
Meanwhile NPLs as previously noted[6] hardly ever serve as leading indicators but at best are coincident indicators.
Non Performing Loans (NPLs) are coincident if not lagging indicators. NPLs are low because the current boom continues.NPLs become reliable indicators, when asset quality deteriorates or when the credit boom is in the process of reversing itself into a bust. Again they are coincident if not lagging indicators.
The mainstream would like to believe that there is some magical potion or formula on how to control credit with statistical variables even when the main policy itself PROMOTES credit.
This would be another version of cognitive dissonance applied to policy
In a recent interview[7], former Bank of Japan governor Masaaki Shirakawa questions the current reliance on bank capital standards in controlling of financial stability risk. (bold and italics mine)
The current assessment of financial stability risk that I often hear is that – because of the improved capitalization and increased liquidity buffers of financial institutions – there is no imminent threat. If I stress “imminent,” I do not disagree with this view.But, at the same time, we have to recognize that financial crises over the past 20 years or so have taken on a different form every time. We cannot grasp the system’s vulnerability just by looking at average data. What is important is the distribution of positions and the correlation of risk factors. In this regard, we have to be attentive to the fact that we have been through a very long period of low interest rates. And, while I cannot specify the exact form of positions that could threaten financial stability, it is natural to think that various forms of potentially risky positions that we do not see clearly could be accumulating. Also, we have to be attentive to the behavioral changes in the government that these financial conditions could bring about…
Shirakawa-san further advocates on the priority of controlling monetary policy that promotes debt than from implementing macroprudential policies…
Following the global financial crisis, there were many measures introduced in the area of regulation and supervision to make finance safer. Most of these measures are desirable. But, it is not enough to have a certain liquidity or capital buffer for a given amount of debt. What is more important is to avoid too much debt itself. And, we have to discuss this issue more seriously.In this regard, we need some rethinking of the conduct of monetary policy. We have to wonder whether the current regime of monetary policy has a bias toward the creation of too much debt. For instance, if monetary policy is overly focused on price stability in the short term without paying due attention to the stability of the financial system, it may lead to excess debt creation by giving the sense that accommodative policy will extend into the future. Also, if central banks have too strong a preference for low volatility, providing insurance against a fall in asset prices, then this may lead to excess debt creation. Of course, macroprudential policy is important, but I don’t think it will be effective without a corresponding monetary policy adjustment.
Again obsession to statistical metrics hardly serves as guarantee to the soundness of a financial system. Statistics is not economics.
Instead a system that depends on the politicized distribution of credit via central banking fiat standard will always be vulnerable to boom-bust cycles or to hyperinflation.
Finally, has the strong dollar begun to exert its adverse influence to the stock markets of our neighbors?
If so, to what extent will the Phisix be shielded? Will the Phisix be subjected to the BSP’s observation that “The rebalancing in global portfolios, as funds search for better yields, has surfaced in our domestic financial markets as volatility in the peso/dollar exchange rate, and in the local bond and equity markets”
Can the index managers prevent a potential contagion?
Interesting.
The Different Hats of the BSP Chief
While the BSP chief omitted the word 'deflation' in his most recent speech, he structures his arguments from the basis which he previously argued of deflation risks. This implies of his continued deflation mindset.
In addition, the BSP chief appears to be engaged in serious cognitive dissonance.
First, in his lecture to journalists on how they should write about economics, he emphasized on the authorities’ ‘knowledge problem’, in particular how authorities are faced with the variability and fluidity of events for them to react. This striking commentary is an example: “There are no absolutes in dealing with these issues. There are many ifs and buts. And, a number of factors and variables, including concerns related to technology and geopolitics, would need to be considered. Friends, there is no crystal ball for these things.”[8]
I have even been smitten by his quote: “Economic numbers rarely tell the complete story when taken at face value. Therefore, a responsible journalist who seeks to offer readers a fuller appreciation of the information will examine the figures within a broader context or against an array of other relevant indicators.”
Yet in the recent speech he attempts to show the opposite, how BSP actions have been “proactive, preemptive and prudent”. In short, he shifts from the knowledge problem to the pretense of knowledge.
So different audiences, different hats, anything that panders to the audience hence the clashing messages.
Second, the proclivity to see the world in the context of deflation risks has so far prompted the BSP’s monetary board to maintain policy rates last week. This aligns with the BSP’s lowering inflation forecasts to 2.2% in 2015 while ironically projecting growth rates of 7-8%.
Given that “rebalancing in global portfolios” has already “surfaced in our domestic financial markets” that may “translate into more pronounced changes in trade patterns” how the heck can one project 7-8% growth rates if the above external conditions will be realized and transplanted to domestic conditions? How will say a sustained firming of the US dollar influence domestic interest rates which translate to borrowing or credit conditions, capital flows, trade and production process? Does he or the entire BSP know? Or has the BSP just been picking numbers from the sky to enthrall the crowd?
Importantly, since credit growth has been instrumental in delivering statistical economic growth, how on earth will this square with low inflation? Is the BSP suggesting that productivity growth—centered on largely construction-property and property related boom—will explode???!!! And because of such productivity blast, credit will serve less in the financing of economic expansion? This implies that 7-8% will be financed by savings and retained earnings??? What has these guys been S-M-O-K-I-N’?!
Does the BSP ever give a thought on how current debt levels will affect future growth?
Well as I have said in the past[9],
Debt represents the intertemporal distribution of spending activities. Borrowing money to spend simply means the frontloading of spending. The cost of debt financed spending today is spending in the future. Debt will have to be repaid at the expense of future spending. Of course there are productive and non-productive debts. But policies of financial repression via zero bound rates tend to promote non-productive ‘speculative’ and consumption debts.
Has the BSP identified which among the loan portfolio extended by the banks and by the bond markets have speculative or productive? Do they know of their proportionality and depth of possible chain links of creditors? The problem with looking in the prism of aggregates is to see and dissect things as a one size fits all phenomena.
Yes the government can manipulate statistics to show whatever they want, but they can’t make statistics put food on the table.
Statistics is not economics.
Record Phisix 7,800: Benjamin Graham and David Dodd’s View of Overvalued PERs
There is another thing that the PSE officials didn’t give an effort to explain at all.
They claim that record stocks represent “investors anticipate positive earnings results”
They didn’t explain that if record Phisix had indeed been about anticipation of positive earnings results, then why the proliferation of outrageous valuations?
Outlandish valuations have NOT been about positive earnings results but about performance, yield or momentum chasing rationalized on whatever that would stimulate such frenzied behavior. G-R-O-W-T-H has served nothing more than a shibboleth or a conditioned stimulus that triggers irrational behavior.
Yet here is why such rationalizations could be hazardous and dicey to one’s portfolio.
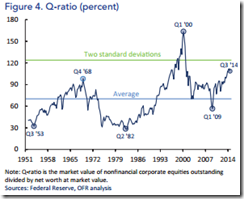
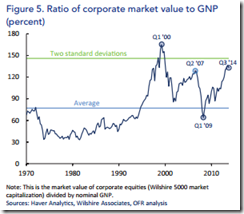
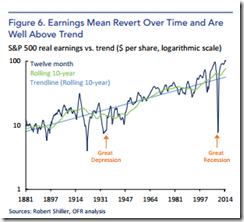
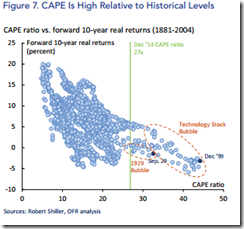
In a warning on US equities, the US treasury’s Office of Financial Research writes on why we shouldn’t rely on mainstream’s Forward Earnings
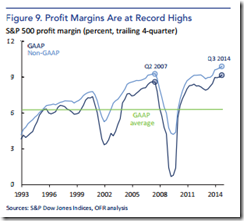
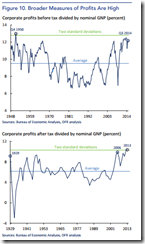
Forward PE ratios are potentially misleading for several reasons. First, forward one-year earnings are derived from equity analyst projections, which tend to have an upward bias. During boom periods, analysts often project high levels of earnings far into the future. As a result, forward PE ratios often appear cheap. Second, one-year earnings are highly volatile and may not necessarily reflect a company’s sustainable earnings capacity. Third, profit margins typically revert toward a longer-term average over a business cycle. The risk of mean reversion is particularly relevant today, because profit margins are at historic highs and analysts forecast this trend to continue.
Previously I have recently shown the LTM 3Q reported EPS by Phisix, its sectoral benchmarks and its member companies based on December reports from 2008-2014.
Let us see how the OFRs observations fare with developments in the Philippine setting.
The OFR says of upward bias in earnings projections during boom.
2014 mainstream projection was at 6%, LTM 3Q data shows growth at 1.8%. √
The OFR says one-year earnings are highly volatile.
Given that—of the 29 issues with 2 year track record or more—there have been only 6 issues that had sustained earnings growth for 3 years, and 5 of these has been above 10, then this would mean another √
The OFR says profit margins typically revert toward a longer-term average over a business cycle
As explained before, growth has natural limits and thus this should be expected. Warren Buffett’s flagship Berkshire Hathaway should serve as great example. Nonetheless mean reversion over a business cycle will have to yet to be tested here. And that test will likely come soon.
Finally do you know what Warren Buffett’s mentor Benjamin Graham and his partner David Dodd thinks of buying issues with overpriced PERs[10]? (bold mine)
The notion that the desirability of a common stock was entirely independent of its price seems incredibly absurd. Yet the new-era theory led directly to this thesis. If a public-utility stock was selling at 35 times its maximum recorded earnings, instead of 10 times its average earnings, which was the preboom standard, the conclusion to be drawn was not that the stock was now too high but merely that the standard of value had been raised. Instead of judging the market price by established standards of value, the new era based its standards of value upon the market price. Hence all upper limits disappeared, not only upon the price at which a stock could sell but even upon the price at which it would deserve to sell. This fantastic reasoning actually led to the purchase at $100 per share of common stocks earning $2.50 per share. The identical reasoning would support the purchase of these same shares at $200, at $1,000, or at any conceivable price.An alluring corollary of this principle was that making money in the stock market was now the easiest thing in the world. It was only necessary to buy “good” stocks, regardless of price, and then to let nature take her upward course. The results of such a doctrine could not fail to be tragic. Countless people asked themselves, “Why work for a living when a fortune can be made in Wall Street without working?” The ensuing migration from business into the financial district resembled the famous gold rush to the Klondike, except that gold was brought to Wall Street instead of taken from it
To repeat: The results of such a doctrine could not fail to be tragic.
I’d be blunt or more direct, the obverse side of every mania is a crash.
Crashes signify as tragic outcomes.
US Treasury’s OFR Warns on US Stocks! BOE Sounds Financial Instability Alarm as Four Central Banks Cut Rates!
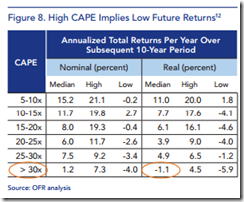
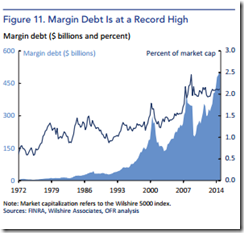
The reason I mentioned the US Treasury’s Office of Financial Research has been because of their lengthy and detailed admonition on US equities which they describe as having been severely overvalued and overleveraged.
The US government’s OFR conclusion[11]
Markets can change rapidly and unpredictably. When these changes occur they are sharpest and most damaging when asset valuations are at extreme highs. High valuations have important implications for expected investment returns and, potentially, for financial stability.Today’s market environment is different in many ways from the period preceding the Great Recession, because regulators and market participants have made adjustments to enhance financial stability since the financial crisis. In that time, stock returns have been exceptional and market volatility generally subdued. Today, many market strategists see the bull market extending throughout 2015.However, quicksilver markets can turn from tranquil to turbulent in short order. It is worth noting that in 2006 volatility was low and companies were generating record profit margins, until the business cycle came to an abrupt halt due to events that many people had not anticipated. Although investor appetite for equities may remain robust in the near term, because of positive equity fundamentals and low yields in other asset classes, history shows high valuations carry inherent risk.Based on the preliminary analysis presented here, the financial stability implications of a market correction could be moderate due to limited liquidity transformation in the equity market. However, potential financial stability risks arising from leverage, compressed pricing of risk, interconnectedness, and complexity deserve further attention and analysis.
Warnings from political authorities are back in the fad again.
This week, the Bank of England cautioned against financial stability risks[12] (bold mine)
Among officials’ top concerns is the risk that participants in financial markets are too sanguine about their ability to quickly sell assets if economic news sours, a fragility the BOE has been highlighting for some time.This drying-up of market liquidity risks heightening volatility in financial markets and could undermine financial-sector stability, the panel said.
Aside from the OFR and BoE’s negative guidance, four more central banks have slashed interest rates last week, particularly Sweden, Pakistan, Hungary and Sierra Leone. Last week’s combined actions adds to 10 central bank rate cuts for the month and 28th for the year. Aggressive rate cuts represent crisis resolution measures being undertaken by global central banks. This tally board excludes other easing measures, like QE.
In the past, rate cuts had been used when the economic downturns become apparent. Today rate cuts are being applied preemptively. In other words, like bear markets, economic downturns or recessions are prohibited. Central banks will use all available tools to ward them off. The problem is that if their magic wand fails, and when the slump becomes apparent, then central banks would have exhausted their tools.
28 rate cuts means many part of the world have been showing signs of emergent distress from which has prompted their respective central banks to act.
Nonetheless many stock markets have been at various record or milestone highs. Such euphoric mood runs in the opposite direction to the reactions of central banks with respect to their real economy. Record high stocks seem as in a state of intoxicated ignorant bliss.
Yet when they awake from their inebriation, a big hangover will befall on them.
[1] Philippine Stock Exchange PSE index posts 20th record close for 2015 March 26, 2015
[2] see Phisix: PNOY’s 5th SONA: Desperately Seeking The Return of Boom Time Conditions August 3, 2014
[3] Mahar Mangahas Self-rated poverty proves its reliability March 14, 2015 Inquirer.net
[4] Bangko Sentral ng Pilipinas Speech before the Euromoney Philippines Investment Forum, Sustaining the Economy's Growth Saga through The 3Ps of Policymaking: Proactive, Pre-emptive, and Prudent, bsp.gov.ph March 24, 2015
[5] IMF 2014 ARTICLE IV CONSULTATION—STAFF REPORT; PRESS RELEASE; AND STATEMENT BY THE EXECUTIVE DIRECTOR FOR INDONESIA March 2015
[6] See The Flaws of BSP’s Real Estate Monitoring and Banking Stress Tests May 20, 2013
[7] Money and Banking Interview with Masaaki Shirakawa March 25, 2015
[8] See Phisix 7,800: Record Phisix as the BSP Continues with Deflation Spiel! March 9, 2015
[9] See Rationalizing the Record Phisix 7,700 February 8, 2015
[10] Benjamin Graham and David Dodd, The New-Era Theory Chapter 27 THE THEORY OF COMMONSTOCK INVESTMENT Security Analysis Sixth Edition (p 359-360) Paulasset.com
[11] See Wow. US Treasury’s Office of Financial Research warns of US Stock Market’s Extreme Valuations, Overleverage and Rising Risks of Financial Instability March 27 2015
.png)
.png)
.png)
.png)
.bmp)
.png)
.bmp)
.png)
.bmp)


