The heart of the matter: an untenable mountain of debt is supported by a deeply maladjusted economic structure. The amount of perceived wealth tied up in speculative asset Bubbles becomes completely divorced from underlying wealth producing capacity within the real economy. The unavoidable bursting of speculative Bubbles unleashes forces that expose deep-seated system Credit, market and economic fragilities, along with policy impotency—Doug Noland
In this issue
Analyzing the 2023 Performance of the Philippine PSEi 30 Constituent Firms
I. Introduction
II. PSEi 30’s 2023 Financial Performance: Net Income and Revenues Climb as Debt Accumulation Slowed
III. A Dissection of the PSEi 30 Financial Performance in the Lens of the "Trickle-Down" Political Economy
IV. 2023 Financial Performance by Sector
V. 2023 Financial Performance by Company
VI. PSEi 30’s "Beguilingly " Cheap PER
Analyzing the 2023 Performance of the Philippine PSEi 30 Constituent Firms
We review and assess both the aggregate and detailed financial performance of the PSEi 30, including their economic contribution or impact.
I. Introduction
The 30 elite members of the PSEi 30 completed the submission and publication of the 17-A or annual reports only last week.
This outlook examines their financial performance for 2023.
Nota bene:
-Older data, representing PSEi members of the specified year-end, presents an apples-to-oranges scenario. The PSEi periodically updates its constituents, which we labeled as 1A data.
-The older data also excludes revisions.
-Current or 2022-2023 annual data provides a more accurate comparison as it reflects present members, labeled here as 1B data.
-The aggregates are overstated due to holding companies incorporating subsidiaries.
Nevertheless, our aim with this assessment is to provide an approximate overview of their 2023 performance.
II. PSEi 30’s 2023 Financial Performance: Net Income and Revenues Climb as Debt Accumulation Slowed
First, the good news.
For the first time since at least 2018, net income in pesos grew faster than debt.

Figure 1
Non-financial debt (1A) declined by 4.6%, from a record Php 5.570 trillion in 2022 to Php 5.316 trillion, marking a Php 254.3 billion decrease. (Figure 1, topmost image)
According to 1B data, debt increased by 1.96%, from Php 5.214 trillion to Php 5.316 trillion, or a Php 102.2 billion expansion, its slowest since 2018.
These figures are based on published debt.
Please note: Some companies may have reclassified or included debt in other accounting identities, such as lease liabilities, which were reflected in interest expenses. Debt from the PSEi 30 banks was not included in this analysis.
As a ratio of total financial resources, the debt of the PSEi 30’s non-financials marginally slipped to 17.2%, its lowest level in the last 5 years. (Figure 1, middle pane)
Apparently, the BSP’s rate hikes, coupled with the stratospheric levels of debt, may have diminished the appetite for aggressively acquiring debt. (Figure 1, lowest graph)
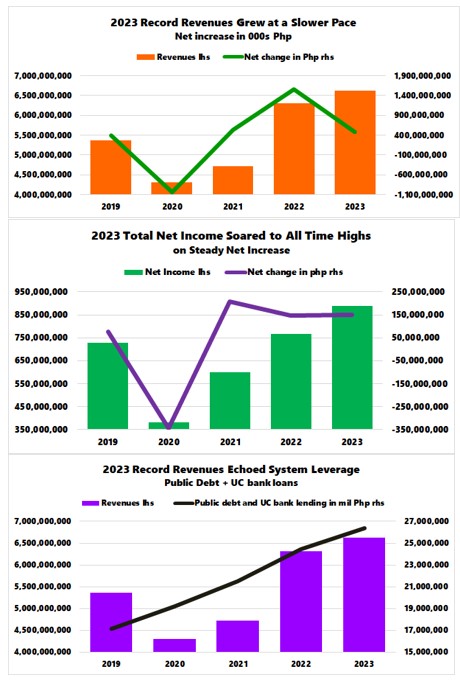
Figure 2
Although headline revenues (1A) surged from Php 6.307 trillion to a record high of Php 6.62 trillion, growth rates slowed to 4.95% in percentage terms and Php 312.3 billion in peso terms, respectively. (Figure 2, topmost chart)
Based on 1B, revenue growth of 7.8% or Php 477.96 billion accounted for the slowest pace since 2021.
Net income performance mirrored revenue trends.
Based on 1A, it posted a record Php 890.3 billion in 2023, up 16%—its slowest rate since 2021—or Php 150.8 billion. It was up by 28.4% or Php 146.14 billion in 2022. (Figure 2, middle graph)
Using current members (1B), it increased by only Php 122 billion, again its slowest growth in the last three years.
That said, using 1A, for every peso increase in debt, net income grew by Php 1.48.
The burning question is: given their dependence, how long can these companies afford to refrain from using borrowing as an engine of growth?
III. A Dissection of the PSEi 30 Financial Performance in the Lens of the "Trickle-Down" Political Economy
Next, to answer that, let's consider the macro-economic dimension:
- According to 1A data, all-time high revenues are indicative of the all-time high in overall system leverage, which includes (Universal-Commercial) bank lending and public debt. (Figure 2, lowest visual)

Figure 3
-Revenue growth in pesos also reflects the movements of the Consumer Price Index (CPI), as well as the GDP. (Figure 3, topmost graph)
-Record net income, as well as its trend, resonated with the milestone high in public spending and its trend. (Figure 3, middle window)
The thing is, revenue growth in 2023 outperformed NGDP for the past three years but underperformed in 2023. Could this be a sign that GDP was overstated, or did the government replace the private sector as its primary engine? (Figure 3, lowest diagram)
The historic debt resulting from combined deficit spending, consumer spending, and the "build and they will come " supply represents the demand and supply dynamics of the economy, as signified by the financial performance of the PSEi 30.
Essentially, debt drives the political economy more than vice versa.
Many PSEi 30 companies directly benefit from government projects, such as infrastructure, as well as various political, financial, and bureaucratic activities, while others benefit indirectly.
Similar to the consumption activities of political spending, the restructuring of the banking system’s loan portfolio targeting consumers, and the "race to build" supply industries like real estate, construction, finance and accommodation were also designed to boost GDP, albeit at the cost of slowing savings and increasing debt loads.

Figure 4
For instance, the net claims of depository corporations on the central government, which represent bank liquidity infusions through Treasury holdings, surged to historic levels in 2023, albeit at the cost of diminishing deposit liabilities and cash in circulation, as represented by M2. Deposit liabilities included in M2 are transferable, savings and time deposits. (Figure 4, topmost chart)
Additionally, the slowdown in aggregate liquidity to GDP measures, reflecting the deceleration of aggregate bank credit growth and BSP liquidity injections, was also reflected in the financial performance of the PSEi 30. (Figure 4, middle pane)
What’s more, aside from the CPI, revenue growth of 7.8% (1B) resonated with the Nominal GDP of 10.6%.
As a measure of the government’s "trickle-down” policies, PSEi 30 revenues accounted for 27.25% of the NGDP, representing the third-highest rate in the last five years. (Figure 4, lowest image)
This reveals the extent of economic concentration that has skewed "rent" benefits to the elites.
Moreover, since these firms represent the primary beneficiaries of debt-financed government spending and bank credit expansion, based on the Cantillon Effects, they are the first (direct) or the second-order (indirect) recipients and spenders of the newly issued money. As such, these firms arbitrage from the diffusive effects of the inflation process on the economy, which are manifested through widening profit margins that anchor their net income.
In short, BSP policies indirectly subsidize the profits of the PSEi 30 at the expense of SMEs and the average citizenry.
Despite the BSP and institutional reticence, risks have become systemic.
Needless to say, all these factors play a crucial role in shaping the PSEi 30's top and bottom-line performance, including their risk profile.
Fundamentally, given the political economy’s dependence on the Keynesian development model of consumption channeled through the savings-investment gap, how can these firms survive without debt as an engine of growth?
IV. 2023 Financial Performance by Sector
How did the sectors of the PSEi 30 perform in 2023?

Figure/Table 5
In the context of non-financial debt (1B), the holding sector grew by only 1.6%, yet it posted the largest peso gains of Php 56.7 billion.
The two-firm property sector came in second, with growth up by 6.2% or Php 36.5 billion. Industrials saw their debt decrease by 1.6% or Php 4.4 billion.
Overall, debt grew by 2% to Php 102.2 billion.
Nevertheless, the property and financial sectors took the limelight in terms of headline performance.
Financials registered the fastest revenue growth at 44%, while the property sector came in second at 19.2%.
However, as a share of the PSEi 30, financials and the property sector represented only 4.2% and 8.2%, respectively, with the holding firm sector commanding the majority share of 57.6%.
For the PSEi 30, revenues grew by 20.4%, amounting to Php 150.8 billion.
In terms of net income, the property sector also accounted for the speediest growth clip at 31.16%, while financials clocked in at 29.2%. Base effects led to such a substantial growth rate for these industries.
Nonetheless, Financials, with 18.9%, had the second-largest share after the 47.24% of holding firms. The property sector accounted for 7.9%.
Based on 1B data, PSEi 30 firms drew from cash reserves to pay down debt and for business operations. In terms of percentage, the property (-9.4%) and holding firm (-8.5%) sectors yanked the most cash, while industrials (+10.8%) and banks (+3.3%) increased theirs. The PSEi 30 saw a 2.88% drawdown in cash levels in 2023
V. 2023 Financial Performance by Company
Here is the 2023 financial performance breakdown by constituent members.

Figure/Table 6
To omit the growth perspective due to base effects, we shall focus on changes in peso levels.
Only thirteen of the non-financial PSEi 27 firms posted growth in peso debt levels in 2023.
The top three firms with the largest gains were San Miguel (Php 49.6 billion), Ayala Corp (Php 37.4 billion), and Aboitiz Equities (Php 23.71 billion). On the other hand, SM posted the largest debt reduction.
SMC’s new debt accounted for 51.5% of the aggregate increase.
Meanwhile, despite the 2.9% reduction, 16 of the PSEi 30 firms posted increases in cash reserves. The top two firms were Meralco (Php 26.5 billion) and LTG (Php 19.05 billion). On the other hand, the three biggest firms which drained reserves were SMC (Php 56.9 billion) and JGS (Php 41.2 billion).
SMC’s debt load steadied in Q4 2024 (compared to Q3 2024), which means that aside from net income, cash reserves, and non-debt instruments like preferred shares were used to fund existing operations and refinance maturing debt.

Figure 7
Nonetheless, SMC’s debt hit a staggering PHp 1.405 trillion in 2023, while interest expense surged to All-time highs too!
Regarding revenues, 27 of the 30 firms reported annual gains with BDO (Php 71.1 billion), SM Investments (Php 63.3 billion), and GT Capital (Php 61.4 billion) among the top three firms.
SMC reported the largest revenue loss with Php 59.9 billion from sales deficits of its subsidiaries, Petron (Php 56.611 billion), and Global Power (Php 51.8 billion).
Finally, 20 of the 30 firms posted net income growth in 2023. JGS (Php 26.1 billion), SM (Php 21.84 billion), SMC (Php 17.94 billion), BDO (Php 16.33 billion), and PLDT (Php 16.1 billion) constituted the top 5.
VI. PSEi 30’s "Beguilingly " Cheap PER

Figure/Table 8
On the surface, the aggregate PER ratio looks enticingly cheap. Negative EPS contributed mostly to the sharp decline in the 2023 PER, which stood at 2.35. Excluding SMC and MONDE, which posted negative EPS in 2022, the PER climbs to 13.8.
As of May 5th, the average PER of the top 5 largest market cap issues was 16.6, and the next 5, 14.9.
In any case, these aren't exactly 'cheap,' in the face of rising debt, elevated inflation, and 'higher for longer' interest rates as productivity and savings slow.
Statistics are history. It is also about transparency, which is questionable in the present setting. Yet, equity returns are about the future.
Or, in reference to a Wall Street maxim, "Past performance does not guarantee future returns.