Showing posts with label european economy. Show all posts

Wednesday, October 08, 2014

How Prostitution, Drug Dealing and Smuggling Bolsters Europe’s Economy

In Italy, sagging economic growth has impelled the government to include the illegal drug sales, smuggling and prostitution in the gross domestic product calculation in order to buoy the statistical economy in May 2014. How does one get to compute “illegal” into GDP? Beats me. The United Kingdom also followed to include the sex and drug industry also in their GDP late May 2014.
Sovereign Man’s Simon Black explains the new accounting methods used by some governments to compute for the “illegal” activities in the markets as part of G-R-O-W-T-H: (bold mine)
For example, to figure out how prostitution contributed to the country’s economy, Spain’s national statistics agency counted the number of “known prostitutes” working in the country and consulted sex clubs to calculate how much they earned.

Known prostitutes? Do they have a Facebook group?

And how about if these “known prostitutes” move around the borderless Schengen area? Their contribution to GDP is probably counted several times then.

So, using these scientific methods Spain’s statistics agency announced that illicit activities accounted for 0.87% of GDP.

(Perhaps this is one of the reasons why a whopping 547,890 people left Spain last year, most of them to Latin America, according to the national statistics agency.)

This compares similarly to the UK where Britons, according to its own statistics agency, spent 12.3 billion pounds on drugs and prostitutes in 2013, or 0.79% of GDP.

That’s more than they spent on beer and wine, which only amounted to 11 billion pounds.

And you probably thought Britons were heavy drinkers. Turns out they enjoy hookers and blow even more.

On the more uptight and conservative spectrum of Europeans, Slovenian households spent 200 million euros last year on prostitutes and drugs, or 0.33% of Slovenia’s GDP.

Curiously enough, Slovenia’s Finance Minister just announced today that the country’s budget deficit will be 200 million euros higher than previously thought. Coincidence? I don’t think so.

On the more libertine extreme, in Germany estimates suggest that prostitution and drugs amounted to as much as $91 billion in 2013—or an incredible 2.5% of the total economy.

This is the sign of the times. Governments are so desperate to maintain the illusion of growth that they’re turning to desperate, comical measures.

Across the entire continent, Eurostat estimates that gross EU GDP is larger by 2.4% if all illegal activities (not just prostitution and drugs) are accounted for.

Funny thing, they also report that total real GDP growth in 2013 (the year they started counting illegal activities) was just 0.1%.

In other words, illegal activities are now the difference between economic growth and economic recession in Europe.

As Mark Twain quoted 19th century British Prime Minister Benjamin Disraeli "There are three kinds of lies: lies, damned lies, and statistics."

Don’t worry be happy. For the statistics worshiping consensus, stocks backed by G-R-O-W-T-H have been predestined to rise forever!!!!

Wednesday, March 12, 2014

EM Contagion: Based on Exports, Global Economic Growth appears to be Downshifting Fast

I have pointed to the recent collapse of exports by China and by Japan as potential harbinger of a substantial downshift in the growth rate of the global economy. 

Signs are that the world will be faced with a dramatic decline in the rate of growth if measured in exports. 

First of all here is the list of the top 15 exporting countries as provided by wikipedia.org
image

These countries, whose estimated US dollar priced exports at $13.885 trillion for 2013, constitute a substantial share in the (non-fixed) pie of global exports.

I have no figures for total world exports in 2013. So while this would be apples to oranges, if I use the above to compare with 2011 global export data then the top 15 countries would account for about 78% of global export share. A WTO report says that the share of the top 5 exporters represents 36% in 2012 almost equal to the trading volume of regional trading blocs. The point is to show the importance of the share of the above exports relative to the total.

Now aside from China and Japan here are the export trends of the other top 15 exporters
image

Eurozone exports have been in a sharp decline over the past (3 months) quarter.

But Eurozone performance have been unequal. Seen in the context of some of the Eurozone members within the top 15 ranking, German exports (ranked 3rd in the world) remain buoyant although markedly down from September highs. French exports (ranked 5th) have stagnated through most of 2013 compared to 2012 level. Spanish exports have substantially declined over the past 3 months while Italian exports marginally slowed over the same period.
image

Meanwhile US exports have been slightly down
image

South Korean exports have also been in a substantial downtrend. February exports plummeted by 5.7%. February data signifies a decline of 8.5% from October highs

Netherland exports fell sharply down by 5.3% in December (no latest updates yet)
image

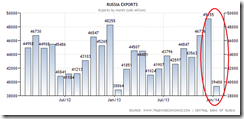
Russia’s exports, ranked 8th in the world, have collapsed last January! Russian exports cratered by 19.8% (m-o-m), and have essentially mirrored China. 

Meanwhile Hong Kong exports have been marginally down.

Ninth largest exporter, the United Kingdom broke the 5 month declining trend with a 2.1% (m-o-m) gain last January. Has this been a quirk or a recovery?

11 spot Canadian exports has also shown a marginal decline over the past 5 months. 

13th ranked Singapore exports posted a modest increase (2.86% m-o-m) in January but the gains have been far off from the highs of October. 

Saudi Arabian exports have been strong as of the third quarter of 2013
image

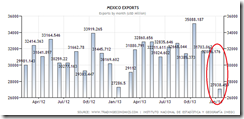
15th spot Mexican exports tanked by 15.73% (m-o-m) in January! 

To have a better view of emerging markets where we can see the extent of the recent damage, let us take a look at the export data of the other majors. 

Brazil’s exports have stagnated in February following a 23% crash in January.

India’s export trend has been in a moderate decline over the past 5 months.  

In Southeast Asia, Malaysia’s exports though posting a marginal decline in January, has remained robust relative to most of 2013.  

Meanwhile Thailand’s exports have fallen sizably over the past 5 months.  

And after a spike in December exports, Indonesia’s January data plunged by 14.63%. Indonesian exports collapsed in August 2013 but recovered until December.  

Following September and October highs Philippine exports have moderately declined over the past 3 months

In sum, for the top 15 only Saudi Arabia, Germany, UK and Singapore have shown recent export (marginal to modest) gains, whereas the export declines have been pronounced in emerging markets (e.g. Russia, Mexico, South Korea). And this has become even more evident with the inclusion of Brazil, Indonesia and Thailand.

The dramatic fall in Japan, the marked slowdown in the Eurozone and the recent downshift in US exports may be signs of the deepening emerging market contagion. 

Emerging market financial market disruptions seem to have now been manifesting real economic effects through the global economy.

Yet the current rate of decline in exports of emerging markets seems alarming. 

[As a side note, this is a treatment of aggregate exports without delving into their details]

And they seem to be reinforcing my fears and suspicions. As I wrote early February
If emerging markets has been attributed by some as having pulled out the global economy from the recession of 2008, now will likely be the opposite dynamic, the ongoing mayhem in emerging markets are likely to weigh on the global economy and equally expose on the illusions of strength brought upon by credit inflation stoked by inflationist policies.
All these comes as major stocks markets seem to be in various stages of a mania (either from record highs or for those bourses fighting off the bear markets with violent denial rallies).

It is interesting to see if there will be a collision course between global real economy and the steroid dependent stock markets hoping for a sustained economic recovery.

P.S. Thanks to the wonderful tradingeconomics.com for all the charts and the very helpful data they provide.

Wednesday, September 18, 2013

European Economic Recovery? Car Sales Plunges to Record Low

We have been told that the Eurozone will be one major force in alleviating the plight of Asia and emerging markets. Unfortunately, it seems that Eurozone will have to fix their problems first before assisting anyone.

Despite positive surveys and all that, what people say and people actually do have been different. In the Eurozone, cars sales fell to the “lowest on record” last August. 

This compounds on the significant decline in July’s Industrial output which has been oceans away from consensus expectations

From Bloomberg: (bold mine)
European car sales fell in August, bringing deliveries this year to the lowest since records began in 1990, as record joblessness in the euro region hurt deliveries at Volkswagen AG (VOW), PSA Peugeot Citroen (UG) and Fiat SpA. (F)

Registrations dropped 4.9 percent to 686,957 vehicles from 722,458 cars a year earlier, the Brussels-based European Automobile Manufacturers’ Association, or ACEA, said today in a statement. Eight-month sales declined 5.2 percent to 8.14 million autos.

The economy of the 17 countries using the euro emerged from a record six-quarter recession in the three months through June. Aftereffects such as a jobless rate in the area that held at 12.1 percent in July led industry leaders at the International Motor Show in Frankfurt a week ago, including Peugeot Chief Executive Officer Philippe Varin, to stick to predictions of a sixth consecutive annual car-market contraction in 2013.

image

"Record low" car sales appear to be undermining the supposed re-emergence from “a record six-quarter recession”.

And to think that “record recession” means soaring stock markets where the Stoxx 50 has been in the proximity of “record highs”. Economic growth drives the stock market? Duh.

Rising stocks provide mainstream media the delusion of a perpetual “recovery” that has gone amiss as signified by “record recession”. 

The reality has been that the Draghi Put (“do whatever it takes” OMT etc…) or guarantees on the markets, has been shifting resources from the main street to Europe’s Wall Street. So Europe's Wall Street feasts on the subsidies provided by the ECB. The real economy then goes only for the morsels.

Yet recent gains in car sales have been misinterpreted by the mainstream and the officialdom as sustainable. 
The European car market rose 4.9 percent in July to 1.02 million vehicles. The gain was the second this year, following a 1.7 percent increase in April that marked the first growth in European car sales in 19 months. The trade group releases July and August sales figures simultaneously each September.
One can call this a “head fake” or in chart lingo a “dead cat’s bounce”.

The car recession has not only been deep but has been widespread.
Four of Europe’s five biggest automotive markets shrank last month. Deliveries in top-ranked Germany dropped 5.5 percent to 214,044 vehicles. That compared with a 2.1 percent increase in July. The U.K. market, the region’s second biggest, expanded 11 percent to 65,937 cars in August.
Don’t worry be happy. The consensus will keep on piling onto the stock markets which it should drive to stratospheric highs, since all other alternatives (bonds, commodities and the real economy) have been down. 

As ex-Citigroup chief executive Charles O. Prince haughtily expressed during the 2007 mania:
When the music stops, in terms of liquidity, things will be complicated. But as long as the music is playing, you’ve got to get up and dance. We’re still dancing.
Despite signs of the music stopping as manifested by rising global bond yields, let’s keep dancing.

Monday, September 16, 2013

Phisix: Will the US, Europe, Japan and China Boost EM and Asian Equities?

Growth in the US, Europe, Japan and China has been the major spin broached by the consensus on the supposed sustainability of an emerging market rally

Over the past two weeks, such claims have been undergirded by a stream of “positive” news.

Europe: Survey says Growth, Actual Data says Contraction

clip_image001

The mainstream forecast for a major economic recovery for the Eurozone has been partly premised from positive European PMIs for July and August, aside from GDP which supposedly lifted the EU from negative growth since 2012.

The PMI survey said ‘growth’ (left window), while July’s actual industrial output says ‘contraction’ (right window) as Factory production plunged by 1.5% which signifies an ocean apart from consensus expectations of -.3%[1]. What people say and what people actually do can be different.

The chart of Industrial Production Index which includes total Industry (excluding construction)[2] shows that July’s sharp decline has brought the index to a three year low.

clip_image002

In addition, the Eurozone’s monetary aggregate M3[3] chart seems to rhyme with the plunge in factory production.

The declining trend in EU’s M3 appears to be hastening instead of bottoming or reversing.

Should the M3’s descent persist and deepen this would only mean that industrial production will likewise fall further, which equally extrapolates to re-submerging of the EU to a period of negative growth or recession.

Rising interest rates will hardly be a plus factor for debt laden economies.

Will The US Pick Up The Slack?

clip_image003

US retail sales grew slower than expected in August, where much of the growth has been imputed to auto sales. Excluding auto sales growth has been at a lacklustre .1%[4]

Confidence whether consumer or from the markets have always been fickle. Today’s cheery sentiment may instantaneously turn gloomy and vice versa. The question is what drives such changes.

clip_image004

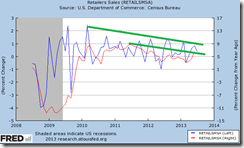
From a different perspective, sales of retailers exhibits a declining momentum as measured by both percentage change (blue) and percentage change from a year ago (red) since 2010.

Contra the wealth effect, rising stocks has hardly been a boost to retail sales.

Yet if the growth in the American consumers has been dismal, where could the other growth come from? Could business spending provide the catalyst?

clip_image005

If we are to measure business spending via commercial and industrial loans acquired from the banking commercial banking system, then the rate of changes has hardly been positive.

There has been declining trend in both percentage change (blue) and percentage change from a year ago (red) which appears to have peaked in early 2012.

clip_image006

Slowing bank loans have likewise been reflected on US monetary aggregate M2 which appears to have peaked almost simultaneously with the commercial and industrial loans. Slowing M2 hardly suggests of a pick up on a credit reliant economy.

Since banking represents only one of the other means to finance business spending perhaps the better measure for business spending is net (domestic) private spending which represents a measure of the state of capital stock.

As Austrian economist and professor Robert Higgs explains[5]
Economists largely agree that net private investment is a key variable. Such investment adds to the private capital stock (with its embodied technologies), which makes inputs of labor increasingly productive over time—that is, net private investment (with the technological improvements it embodies) drives economic growth in the long run. And because private investment spending varies much more than consumption outlays (either private or governmental) in the short and medium terms, such investment also drives aggregate fluctuations in output and employment. When investment collapses, recessions ensue; when investment expands, so do output and employment. Economists do not agree, however, about why private investment varies disproportionately in the short and medium runs. Keynesians and Austrians, for example, disagree completely about the explanation of this disproportion and about its consequences.
Unfortunately the St Louis Fed doesn’t have an updated net (domestic) private spending data.

Nonetheless the current trend of rising interest rates will have an impact on savings, investment and consumption or spending patterns.

clip_image008

This means that aside from debt servicing, operating and financing costs, access to financing and sales, rising rates will affect profitability.

The Wikipedia[6] notes that interest payments on debt by US households, businesses, governments, and nonprofits totaled $3.29 trillion in 2008. The financial sector paid an additional $178.6 billion in interest on deposits. The chart above shows that in 2008 interest debt payment constitutes about 23% of the GDP.

And given the explosive growth in the total systemic debt mostly in nonfinancial debt, particularly via US treasuries PLUS rising rates, the interest payments as a share of GDP are likely much larger than in 2008.

clip_image009
And more on the point of the relationship between economic growth, debt and interest rates, the rate of credit growth by G7 nations has reached a staggering 440% of GDP as of 2012 even as economic performance barely registered meaningful growth rates.

In other words, the credit binge has resulted to diminishing returns in terms of economic growth while simultaneously magnifying interest rate and credit risks.

As the Zero Hedge aptly points out[7]: (bold and italics original)
In a nutshell: the G7 have added around $18tn of consolidated debt to a record $140 trillion, relative to only $1tn of nominal GDP activity and nearly $5tn of G7 central bank balance sheet expansion (Fed+BoJ+BoE+ECB). In other words, over the past five years in the developed world, it took $18 dollars of debt (of which 28% was provided by central banks) to generate $1 of growth. For all talk of "deleveraging" G7 consolidated debt has been at a record high 440% for the past four years. So in the G7, which is a good proxy for the developed world, debt continues to increase whilst nominal growth remains extremely low thus ensuring that the deleveraging process has yet to start.
So if the G7 has been burdened by too much debt, and with the recent surge in interest rates, how will growth in developed economies be enough to pull emerging markets out of the current rut when interest payments in itself will become a huge burden?

Moreover, the ongoing rampage by the bond vigilantes has been prompting for an unexpected contagion effects to the broader fixed income markets.

clip_image010

As PIMCO’s CEO Mohamed El-Erian observed[8], (bold mine)
The impact of higher interest rates overwhelmed the diversifying characteristics of virtually all other fixed income securities.

In many prior episodes of rising U.S. Treasury yields (and especially those associated with materially improving economic fundamentals), credit-sensitive sectors of fixed income were supported by the tightening of credit risk spreads. In the most recent sell-off, however, even spread sectors came under pressure. Displaying higher correlation with Treasuries, credit spreads widened, thus selling off more than Treasury securities (see Figure 3, which includes market proxies for U.S. Treasuries, investment grade corporates, emerging markets sovereigns, municipals and non-agency mortgages).

clip_image011
And the real impact from rising rates can be seen in the US real estate sector where rising mortgage rates have led to a decline in mortgage refinancing and mortgage applications even as existing home sales zoomed[9]

Such unsustainable divergent price actions will soon be settled. Guess in what in direction?

Will Japan’s “Outperforming” Debt Driven Growth Pull Up Emerging Markets?

Most of mainstream media has been raving over Japan’s statistical growth stating that improvements have been “another sign Prime Minister Shinzo Abe's reflationary policies are boosting growth”[10].

Journalists like the above, hardly go about the details of their adulation except to parrot on whatever experts say or what politicians tell them

clip_image012

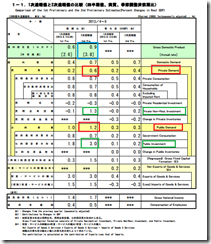
Looking at Japan’s GDP, the large chunk of statistical growth for the second quarter[11] has been from Public spending (+3%) which boosted public demand (+1.2%).

Residents posted NEGATIVE (-.3%) investments as foreigners (+1.3%) took on the bulk of private demand (+.6%).

Meanwhile household consumption and wage levels posted miniscule gains. Growth rate of household consumption declined from .8% in the first quarter to .7% in the second quarter. Employee compensation grew to .5% in the 2nd quarter from .4% in the first quarter. Such fractional growth rates seem hardly statistically significant.

For Japan’s economy to sustain these growth rates means increasing dependence on more boondoggles from Shinzo Abe’s administration. Yet such government spending growth model will entail a massive build up of government debt. Japan’s quadrillion yen debt levels[12] are already unsustainable. Japan’s interest rate burden of 22.214 trillion yen represents 51.61% of the 43.096 trillion yen expected tax revenues for 2013[13] are all based on pre Abenomics rates. The Ministry of Finance have recently requested for a fourteen 14% increase of debt service payment to 25.3 trillion yen[14] if approved such would now account for 58.7% of Japan’s tax revenues!

By the end of the year, expect the MoF to push for more debt service which should bring debt service levels to 65% more or less. This means Japan will be issuing more and more debt to finance existing debt and at the same time increasing deficit financing which adds to the already strained debt loads. A variation of the Ponzi finance from the Minsky model.

Raising sales tax or whatever taxes will only accelerate the downside spiral of Japan’s economy. Japanese investors have already been reluctant to invest, how would higher taxes encourage investments and more economic output?

So in a very short span of time debt servicing will eat up more and more share of tax revenues with economic growth becoming more reliant on government rather than the private sector. Up to what extent before Japan’s (Japanese government bond) JGB creditors decide to call it quits?

The BoJ will increasingly also play a bigger role in the financing of the Ponzi dynamics behind Japanese government bonds.

But what matters is when investors decide to pull the plug. Either this means the yen collapses (if the BoJ continues to monetize) or a debt default (if the BoJ desist from financing JGBs). When I can’t say, but at the rate by which political actions have been driving Japan’s fiscal balance, a credit event is likely to occur in Japan anytime within 3 years. At 14% increase for every 6 months, government liabilities will eat up current tax revenues in 2 years, ceteris paribus

So how will Japanese investors become bullish on real world investments when Abenomics has been destroying profitability?

clip_image014

In vetting the the Bank of Japan’s Corporate goods price index[15], one would note how price inflation has been affecting different levels of corporate activities.

On a year on year basis, raw materials and intermediate materials have risen 15.9% and 5.2% respectively, whereas final goods only rose by 3.2%. This means while cost of production has been rising, the ability of Japanese companies to raise prices of their products (final goods) to pass on to the consumers has been limited. The net effect has been vastly reduced profitability. Add more taxes, Japanese companies will get maimed.

You might wonder why Japan’s stock markets appear to be rising, it’s hardly because of earnings or economic optimism as one can see from the BoJ data above, but rather Japan’s stocks appear to cast a seminal shadow on the actions of hyperinflating Venezuela.

Will Japan boost emerging markets? From the above account, to the contrary Japan may add to the troubles of emerging markets.

Will China Spur the Emerging Market Rebound?

One of the supposed bright spots during last week has been the several positive economic sensitive data from China. China’s industrial output supposedly grew at the fastest pace in 17 months last August by 10.4%. Retail sales expanded by 13.4% while fixed asset investment excluding rural areas jumped 20.3% during the first quarter[16].

The Chinese government’s stealth stimulus channelled through state owned banks has led to an increase in aggregate financing 1.57 trillion yuan from 1.25 trillion last year via new loans (711.3 billion yuan versus 703.9 billion in August 2012) and money supply M2 jumped 14.7% from last year[17]

First of all I am not comfortable with statistics from the Chinese government in the recognition of the hiding, censoring and editing of data which has not fitted with the government’s agenda[18].

Second credit growth only validates my suspicion that the incumbent Chinese government will sacrifice reforms for statistical growth[19]. Chinese leaders have shown preference for political convenience and privilege over economic weal. The Public choice theory at work

clip_image015

Third sluggish commodity prices have hardly been supportive of the supposed growth in fixed asset investments, unless we are talking of a lagged effect as copper imports have reportedly risen[20]. But Chinese copper imports y-o-y have been rising since 2012, this hardly has been consonant with the price action in the copper markets as with the Australian Dollar-US Dollar currency pair

Fourth some major Chinese banks have been bruised from the recent losses in the bond markets. With $175 billion of maturing debt in 2014 amidst rising interest rates the S&P warns of an escalation of bad loans[21]. So rising rates have begun to bite on China’s real economy. As to how credit will continue to expand in a system inundated with debt as rates continue climb is like water flowing uphill.

Fifth there have been signs of cracks in China’s property bubbles as home sales transaction fell for the second month even as Home prices continue to soar (August posted the biggest monthly gains since December)[22]. Rising prices on diminishing volume means lesser scalability or upside room for the bulls

Sixth the Chinese central bank, the PBOC, reportedly recognizes of the growing credit risks from what seems as Ponzi operation by local government financing vehicles where these state owned firms depend on rising land prices and land sales to finance existing debt[23]. Local government debt in 2011 has been tallied at 10.7 trillion yuan (US $1.75 trillion)

If it is true that the Chinese government has been circumspect of the growing credit risks by local government then the stealth stimulus may be limited and may not be enough to patch up the hissing bubbles.

Bottom line: Risks Remains High

Current meltup in US equity markets have increasingly been signs of a mania as evidenced by overconfidence, the crowded trade psychology manifested by the magazine cover indicator and by a surge in household buying of the stock market as Smart money exits.

Fuel subsidies in Indonesia and India, which are real structural problems, may become the proverbial pin that may pop regional bubbles. Rising markets will hardly wish away the potential negative repercussions from such real imbalances wrought by politically imposed price distortions and wealth transfer.

Losses in the bond market and commodity markets have been impelling the global financial sphere, who has been desperately seeking yields, to frantically bid up on equity markets, thus conjuring up all specious excuses to justify their actions.

Europe will hardly provide any boost to emerging markets as the region’s economy is likely to undergo a recessionary relapse.

The US economy appear to be slowing considerably, these will hardly be a boost for emerging markets especially if the FED does taper.

Media and Japan has been putting lipstick on the statistical growth pig. Japan deficit financing model will add to the unsustainable debt levels. Taxes will short cut Japan’s credit event.

The bond vigilantes have made their presence felt on the Chinese economy, this will limit the ability of the Chinese government to further engage in stealth stimulus.

Expect market volatility to remain mercurial in both directions.

Risk remains high.


[4] Wall Street Journal Retail Sales Rose 0.2% in August September 13, 2013


[6] Wikipedia.org Debt Financial position of the United States


[8] Mohamed A El Erian What’s Happening to Bonds and Why? Pimco.com September 2013


[15] Bank of Japan Monthly Report on the Corporate Goods Price Index Preliminary Figures for August 2013

[16] Bloomberg.com China August Industrial Output Rises 10.4% September 10, 2013


[20] Business Insider, Chinese Commodity Demand Is Exploding Again September 12, 2013

[21] Bloomberg.com Record $175 Billion Due Makes Banks Worst Losers September 14, 2013


Thursday, September 12, 2013

European Economic Recovery? July Industrial Output Sinks Far from Consensus Expectations

The resumption of the RISK ON environment has been mainly premised on a supposed recovery by the economies of the US, Europe, China and Japan. The belief is that these countries will do the weightlifting for emerging markets-Asia and relieve the latter from the pressures of the Fed’s “tapering”.

Europe has reportedly been lifted out of recession in the 2nd quarter from improved consumption and production.
image
chart from economic design

European PMI surveys (Purchasing Managers Index—an indicator of the health of the manufacturing sector through 5 variables; specifically new orders, inventory levels, production, supplier deliveries and the employment environment) supposedly posted significant gains in July and in August.

Well it turns out that expectations and actual performance have once again severely diverged as European industrial output miss by an ocean: the parallel universe.

From Bloomberg: (bold mine)
Euro-area industrial output contracted more than economists forecast in July as manufacturers struggled to shake off the legacy of a record-long recession.

Factory production in the 17-nation euro area fell 1.5 percent from June, when it gained 0.6 percent, the European Union’s statistics office in Luxembourg said today. That’s more than the 0.3 percent contraction forecast by economists, according to the median of 33 estimates in a Bloomberg News survey. (EUITEMUM) In the year, output fell 2.1 percent.

The euro-area economy’s return to growth in the second quarter from its longest-ever recession has been restrained by record unemployment and inflation has remained below the European Central Bank’s 2 percent ceiling for seven months. That may help to explain why economists in a Bloomberg News survey see growth slowing to 0.1 percent in the third quarter after a 0.3 percent expansion in the three months through June.

The industrial-output “data call into question the region’s recovery,” said Chris Williamson, chief economist at Markit Economics in London. “There is clearly a risk that GDP could contract again in the third quarter, as some of this second-quarter growth proves to have been only temporary.”…

Production in Germany, Europe’s largest economy, declined 2.3 percent in July after a 2.2 percent gain in June, today’s report showed. Output in France fell 0.6 percent, while Italian industrial production unexpectedly declined 1.1 percent, signaling that the euro area’s third-biggest economy may still be stuck in its longest recession since World War II.
Some recovery.
image

Not to worry, European stocks represented by the STOX50 have been rising since the last quarter of 2011 and have presently been drifting at 2 year highs… 
image
image

…even as the Eurozone has been mired by a continuum of negative growths (based on annual and quarter growth) for the entire 2012 until the 1st quarter 2013.

Who says stock markets reflect on the state of the economy?

Friday, November 16, 2012

Chart of the Day: Europe’s Double Dip Recession

image

Political solutions in the Eurozone, meant to preserve the status quo for the political establishment, has been worsening economic conditions as industrial production has rolled over even in major nations as Germany and France.

Writes Dr. Ed Yardeni (chart also from Dr. Yardeni’s Blog)
The Euro Mess remains as messy as ever. However, investors have been less concerned about a financial meltdown in Europe ever since ECB President Mario Draghi volunteered at the end of July to do whatever it takes to avert a euro cliff. Furthermore, the Europeans continue to kick Greece down the road rather than force it out of the euro zone. Nevertheless, Europe is sinking deeper into a recession. That’s becoming a more significant concern to investors I’ve talked with recently, especially if the US economy falls off the fiscal cliff.

Particularly unsettling yesterday were massive and widespread anti-austerity protests across Europe. The strikes and demonstrations, some involving hundreds of thousands of people, hit more than 20 countries in the EU, disrupting airports and ports, closing roads and public transportation, and shutting some essential services. The biggest protests were in Portugal, Spain, Greece, and Italy. The union-led protests--called "European Day of Action and Solidarity"--were mostly peaceful, but turned violent in Lisbon, Madrid, and Rome.
Yet political solutions (bank and sovereign bailouts, ECB’s interventions, surging regulations, higher taxes and etc…) will not only hamper economic recovery, they will lead to more social frictions which increases the risks of the EU’s disunion—as evidenced by the snowballing secession movements—and of the escalation of violence.

Saturday, September 01, 2012

Eurozone’s Nascent Signs of Stagflation

Stagflation according to Wikipedia.org is a situation in which the inflation rate is high, the economic growth rate slows down, and unemployment remains steadily high

This Bloomberg article entitled Euro-Area Unemployment At Record, Inflation Quickens: Economy suggests that the Eurozone is now suffering from stagflation.

Euro-area unemployment rose to a record and inflation quickened more than economists forecast as rising energy costs threaten to deepen the economic slump.

The jobless rate in the economy of the 17 nations using the euro was 11.3 percent in July, the same as in June after that month’s figure was revised higher, the European Union’s statistics office in Luxembourg said today. That’s the highest since the data series started in 1995. Inflation accelerated to 2.6 percent in August from 2.4 percent in the prior month, an initial estimate showed in a separate report. That’s faster than the 2.5 percent median forecast of 31 economists in a Bloomberg survey.

A 12.4 percent surge in crude-oil prices over the past two months is leaving consumers and companies with less money to spend just as governments seek ways to contain the debt crisis. European economic confidence dropped more than economists forecast to a three-year low in August and German unemployment increased for a fifth month, adding to signs the euro-area economy continued to shrink in the third quarter.

“The whole euro zone is undergoing negative growth developments,” Don Smith, a London-based economist at ICAP Plc, told Ken Prewitt on Bloomberg Radio yesterday. “The sense is that increasingly the euro-zone crisis is bearing down on countries in northern Europe and Germany in particular and this is really forcing officials’ hands toward coming up with a firm solution.”

Europe’s nascent stagflation in pictures,

image

All three elements of stagflation, namely, elevated CPI or price inflation, contracting economic growth and high unemployment rates appear to be intact. (chart from trading economics)

And the so-called “firm solution” for policymakers translates to even more inflationism by the European Central Bank (ECB).

From the same article…

The ECB, which in July cut its benchmark interest rate to a record low of 0.75 percent, is working out details of a plan to purchase government bonds of distressed nations along with Europe’s rescue fund. So far, neither Italy nor Spain has asked for help from the bailout facility, the European Stability Mechanism.

The central bank, led by Mario Draghi, will hold its next meeting on Sept. 6 in Frankfurt.

“There may be a little bit of disappointment,” Piero Ghezzi, head of global economics at Barclays Plc, told Mark Barton on Bloomberg Television’s “On the Move” on Aug. 29. “A solution in Europe could be coming from the ECB if they were willing to do unlimited and unconditional purchases.”

Policymakers are fighting the last war. Incipient signs of stagflation will likely turn into intractable inflation or a deepening phase of stagflation once the next round of “unlimited and unconditional purchases” becomes a reality.

The ECB’s actions will then be likely complimented by the US Federal Reserve this September, and perhaps by other central banks such as BoJ, SNB and the BoE or even possibly China's PBoC soon.

These concerted inflationism by global central bankers could bring about the "worst of both worlds" for the global economy.