Monday, January 04, 2016

Chinese Stocks Greets 2016 with a Bang: 7% Crash that Triggered Trading Halts! Japan's Nikkei Dives 3%!

Baptism of fire it has been for the opening sessions of several key stock markets in 2016.

Unfortunately, instead of fireworks to celebrate 2016, Chinese stock markets greeted the New Year with a shocking 7% crash that prompted for a trading halt!

China halted trading in stocks, futures and options after a selloff triggered circuit breakers designed to limit swings in one of the world’s most volatile equity markets.

Trading was halted at about 1:34 p.m. local time on Monday after the CSI 300 Index dropped 7 percent, according to data compiled by Bloomberg. An earlier 15-minute halt at the 5 percent level failed to stop the retreat, with shares extending losses as soon as the market re-opened. The selloff, the worst-ever start to a year for Chinese shares, came on the first day the circuit breakers took effect.


The $7.1 trillion stock market is starting the year on a down note after data showed manufacturing contracted for a fifth straight month and investors anticipated the end of a ban on share sales by major stakeholders. Chinese policy makers, who went to unprecedented lengths to prop up stock prices during a summer rout, are trying to prevent financial-market volatility from weighing on economy set to grow at its weakest annual pace since 1990.
Perhaps policymakers were still in vacation. So when the cat is away the mouse will play.

More...
Under the circuit breaker rules finalized last month, a move of 5 percent in the CSI 300 triggers a 15-minute halt for stocks, options and index futures, while a move of 7 percent closes the market for the rest of the day. The CSI 300, comprised of large-capitalization companies listed in Shanghai and Shenzhen, fell as much as 7.02 percent before trading was suspended.

Chinese shares listed in Hong Kong, where there is no circuit breaker, extended losses after the halt on mainland exchanges. The Hang Seng China Enterprises Index retreated 4.1 percent at 2:12 p.m. local time.


The above table exhibits the broad based bloodbath in Chinese equities that was halted today due to new circuit breaker.

Absent in the above report has been the developments in today's offshore yuan (USD-CNH).  The CNH which has apparently fallen by a substantial amount...(or the USD has risen significantly)


This in contrast to the more tightly government controlled onshore Yuan (USD CNY) which likewise surged at the pm session


With the CNH falling more than the CNY, this has brought about a wider gap between the two. It really signs of strains being ventilated on the currency markets, which partly emanates from outflows (capital flight) and mostly from deflationary pressures within China. And strains in the currency market seem to have spilled over to stocks.

This also shows that no matter how the Chinese government tries to facelift its financial markets, pressures from imbalances will emerge elsewhere


Woes in China's stocks appears to have spread to Japan's Nikkei 225 which tanked by 3% today. 

And as of this writing US futures based on CNN data have likewise been significantly down.

Have these been writing on the wall for 2016 (not limited to financial markets but to real economies as well)?


2016: A Year of Sovereign Debt Defaults?

Ms. Carmen Reinhart, Harvard professor and co-author of the book that chronicled financial crises during the last eight centuries entitled "This Time is Different", sees 2016 with a grim outlook. She has sounded the sirens on the increased likelihood of government debt defaults this year. And such string of  government debt defaults may start with, or be triggered by emerging markets.

An excerpt extracted from Project Syndicate (bold added)
As 2016 begins, there are clear signs of serious debt/default squalls on the horizon. We can already see the first white-capped waves.

For some sovereigns, the main problem stems from internal debt dynamics. Ukraine’s situation is certainly precarious, though, given its unique drivers, it is probably best not to draw broader conclusions from its trajectory.

Greece’s situation, by contrast, is all too familiar. The government continued to accumulate debt until the burden was no longer sustainable. When the evidence of these excesses became overwhelming, new credit stopped flowing, making it impossible to service existing debts. Last July, in highly charged negotiations with its official creditors – the European Commission, the European Central Bank, and the International Monetary Fund – Greece defaulted on its obligations to the IMF. That makes Greece the first – and, so far, the only – advanced economy ever to do so.

But, as is so often the case, what happened was not a complete default so much as a step toward a new deal. Greece’s European partners eventually agreed to provide additional financial support, in exchange for a pledge from Greek Prime Minister Alexis Tsipras’s government to implement difficult structural reforms and deep budget cuts. Unfortunately, it seems that these measures did not so much resolve the Greek debt crisis as delay it.

Another economy in serious danger is the Commonwealth of Puerto Rico, which urgently needs a comprehensive restructuring of its $73 billion in sovereign debt. Recent agreements to restructure some debt are just the beginning; in fact, they are not even adequate to rule out an outright default.

It should be noted, however, that while such a “credit event” would obviously be a big problem, creditors may be overstating its potential external impacts. They like to warn that although Puerto Rico is a commonwealth, not a state, its failure to service its debts would set a bad precedent for US states and municipalities.

But that precedent was set a long time ago. In the 1840s, nine US states stopped servicing their debts. Some eventually settled at full value; others did so at a discount; and several more repudiated a portion of their debt altogether. In the 1870s, another round of defaults engulfed 11 states. West Virginia’s bout of default and restructuring lasted until 1919.

Some of the biggest risks lie in the emerging economies, which are suffering primarily from a sea change in the global economic environment. During China’s infrastructure boom, it was importing huge volumes of commodities, pushing up their prices and, in turn, growth in the world’s commodity exporters, including large emerging economies like Brazil. Add to that increased lending from China and huge capital inflows propelled by low US interest rates, and the emerging economies were thriving. The global economic crisis of 2008-2009 disrupted, but did not derail, this rapid growth, and emerging economies enjoyed an unusually crisis-free decade until early 2013.

But the US Federal Reserve’s move to increase interest rates, together with slowing growth (and, in turn, investment) in China and collapsing oil and commodity prices, has brought the capital inflow bonanza to a halt. Lately, many emerging-market currencies have slid sharply, increasing the cost of servicing external dollar debts. Export and public-sector revenues have declined, giving way to widening current-account and fiscal deficits. Growth and investment have slowed almost across the board.

From a historical perspective, the emerging economies seem to be headed toward a major crisis. Of course, they may prove more resilient than their predecessors. But we shouldn’t count on it.

Saturday, January 02, 2016

Parallel Universe: Philippine Online Job Openings Collapse as Government Declares Record High Employment Rates!


The Philippine government tell us that for 2015, employment rate has surged to 93.7% or that unemployment rate has dropped to 6.3%.


The government tell us too that in 4Q 2015 employment rate was at 94.4% an all-time high! Unemployment rate as of October 2015 dropped to 5.7% which also represents a record low milestone!

These survey numbers contradict real events.

Why?  


Because online job postings have been crashing in 2015 relative to 2014!


According to online job agency, Monster.com, "The Monster Employment Index Philippines registered a -46% year-on-year decline in online recruitment activities between November 2014 and November 2015." (bold added)

It’s not just November though, with the exception of December which has yet to be posted, the entire 2015 have shown jobs growth numbers and levels significantly well below the 2014!

And it is NOT just Monster, two other employment indices which I monitor have been exhibiting Monster’s dilemma.


Firm A, one of the top online job sites, which used to owned by one of the largest publicly listed holding company, has exhibited a 35% collapse in online job postings from a week ago since May, when I began tabulating their numbers!

Firm A’s September bounce, echoes with Monster’s data. And so with the November thud!


Firm B hasn’t been as lucky as Firm A. 

Firm B’s job opening numbers has virtually evaporated! Since April, Firm B’s online jobs have crumbled by a shocking 80% as of a week ago! Competition and the overall low job postings, perhaps led to the erosion of its market share.

While employment data is nuanced than job openings, job openings give us an insight on the conditions of job markets. Job openings provide a clue of the hiring process and employment conditions.


Perhaps employers have resorted to the traditional medium of newspaper based advertisement, which should be more costly, and more inefficient in drawing audiences or candidate employees.

Or perhaps employers have resorted to direct hiring via viral networking, without media advertisements.

Or perhaps job openings have really been dwindling.

Nonetheless based on online job openings the government’s statistical numbers have been unsubstantiated.
This simply tells us that the government’s numbers may be about statistical Sadakos. Or that their numbers that just popped out of the computer screens to generate a showbiz statistical talisman impact.


Yet Monster’s November job opening collapse was broad based! The decline included the top growth industries…yes, mainstream's favorite BPOs too (down by double digit)!


As in June’s data where Monster.com tries to spin the bad developments, as noted here:


Online jobs continue to nosedive. Monster.com’s June data reveals that online hiring plunged 32% year on year. Yet they call this “a significant improvement in growth from -43% in May 2015”. Huh? 


Officers from monster.com must have been scathingly pilloried by the throng of believers who think that the Philippines have reached a developed economy status to force the latter to utter such balderdash.


Monster officials say that current job collapse has “Partly due to the halting investments ahead of the elections and the dry spells of the El Nino, hiring has also begin to slow down”.


But they remain optimistic. They noted that job openings “will likely see a rebound in 2016, given the country’s strong private consumption as well as higher government spending in order to drive growth in the country”


If there has indeed been “strong private consumption” then why would election or political uncertainty serve as a roadblock for investments?


Have the business community become so fearful of the change in administration for them not to take advantage of opportunities from the meme of “strong private consumption”? Or why has the business community become (in aggregate) suddenly blind or dense to profit opportunities?


Yet the BSP tells us of a starkly different story: the business community have supposedly been more upbeat in Q3 and Q4. If so, why the lack of investments? Who has been telling the truth or who has been lying?


Second, how has the dry spells of the El Nino affected investments or job openings? Agriculture accounted for just 8.57% share of 3Q constant based GDP, whereas the Service sector had the largest share at 59.01%. Has there not been a consumer boom to offset dislocations from the weather? 

And if Monster’s numbers accurately reflect on economic activities, then why the slump in ALL sectors?


As for government spending, hasn’t there been a boom in government spending? 

Growth in government spending numbers has reportedly accelerated 19.3% in 3Q relative to 12.4% in 2Q and 4.5% in 1H. Yet where are the jobs? Why has the surge in government spending coincided with a collapse in the job opening markets? Even if we see things in terms of a time lag, the 2Q government spending activities should have at least buoyed job opening numbers. So why the vacuum? 

Could it be because job growth has emerged only in firms of crony enterprises benefiting from government spending projects in the exclusion of the rest?


Yes the government's record low unemployment and all time high employment rates paradoxically comes in the face of slowing statistical GDP, manufacturing and export recession, “halting of investments” and collapsing online job postings. That's government's economic logic for you: Low is high, down is up, few is many.


And you see, where (the phony) boom has been seen by the public or impressed upon the public as a politically correct theme, any negatives has to be denied, censored or rationalized by the mainstream's spin doctors.


At the end of the day, panics are created by reality overwhelming embedded or entrenched misimpressions, misperceptions and deceptions.


Wednesday, December 30, 2015

Philippine Bonds: Yearend Window Dressing Rally Temporarily Relieves Negative Yield Curve But Zero Bound Spreads Remain The Dominant Theme


Like last year, bond manipulators apparently cut short their holiday vacation in order to conduct a year end (three day) window dressing session.

Of course, the goal of the window dressing operations have not only been to bid up prices of domestic bonds (and therefore lower yields), but more importantly to manage the yield curve which has reached alarming conditions.

Curiously last Friday, in what seems as an attempt to widen the spreads, 10 year yields spiked to 4.6%! And perhaps in realization that while a selloff in the 10 year bonds may indeed widen the spreads, higher yields means HIGHER interest rates! So bond managers went into a turnaround to focus instead on the bidding activities on the front end.


So the window dressing operations as seen from week on week (top) and from two weeks (mainly from three trading days—two from this week’s holiday truncated session and from last Friday). 

Again the focus of the bids were on the short end (green rectangle at lower window)


Seen from a year to date basis, the massive three day bidding sessions only eased part of the upside pressures on the overall Philippine treasury spectrum. Yields have generally risen with the exception of 1 and 10 year treasuries. 

Since 10 year have been the benchmark for interest rates, apparently bond manipulators have kept its yields from rising in 2015.


Seen from the yield variance of 10 year relative to T-Bill counterparts, the 3 day window dressing operations managed to lift the spreads marginally away from negative. 

That’s with the exception of 10yr 3 months which spread has crashed anew!

It’s important to point out that the flattening inversion process has been a trend.

The above shows of the one year and one month trend. A trend, which has only accelerated in 2014-15 (see long term trend below). 

And bond volatility has lately emerged out of the intermittent interventions from faceless bond manipulators.


The flattening to inversion process as seen from the yield variances of the 10 year bonds relative 1 and 2 year notes. 

Bond managers have elevated the 10 year 1 year spread, but not the 10-2 year.


The same character can be seen with the front bonds (3-5 year relative to the 10 year). The difference has been that yields of all three has recently inverted with the 10 year contemporary (see blue rectangles). 

Said differently, coupon yields have been higher for these short end bonds relative to the 10 year. This means profit windows from yield arbitrage have closed to virtually nil.

Last week’s window dressing operations buoyed the spread out of negative. Nonetheless the variance of all three remains at zero bound or spreads are at the borderline with negative. The jury is out in 2016 as to the lasting effects of this week's window dressing operations. My bet is that we should see a return of inversion.

The above developments only reveals that contra mainstream and establishment announcements, pressures on financial liquidity as expressed through credit activities has been simmering or mounting. 

This alternatively means that considering the heavy dependence on credit to spike GDP for instance Php 3 of credit to generate Php 1 of GDP in the 3Q, the steep flattening or signs of invesion translates to various risks (credit, interest rate, market and economic) that are being amplified.


The flattening inversion process as seen via the spreads of the 10 year relative shorter counterparts on an annual basis since 2009.


The flattening inversion process as seen via the spreads of the 20 year relative shorter counterparts on an annual basis since 2009.

Again in contrast to the mainstream whom largely remains intentionally blind or oblivious or unconsciously ignorant of the influence of bond yield spreads on credit activities, the tightening of spreads have begun to impact bank credit activities. 

You see, the consensus 'experts' are only concerned with prices involving stocks and property or asset bubbles. The same experts seem as programmed to see other prices as existing in a vacuum!

Yet the narrowing of spreads or emergence of negative spreads even comes in the face of DISINFLATION.

10 straight months of 30%+++ money supply growth 2H 2013-1H 2014 spiked CPI inflation, since then, M3 has crashed which was reflected on government CPI. November's CPI bounce has yet to establish itself as a bottom. Chart updated to include BSP's November liquidity and bank credit data.

While credit growth has ebbed from the 2014 peak, it remains on a double digit clip. Yet no one dares ask, given all the streak of double digit credit growth, where has all the money been flowing to? Why the disinflation?

Other emerging market nations like Vietnam experienced negative yield curve due mostly to a burst inflation pressures. Not here.

The takeaway: There is NO SUCH thing as a Free Lunch FOREVER. The unforeseen cost from borrowing from the future to spike statistical GDP has not only begun to surface, it has been spreading and escalating. 

And shouting statistical talismans or manipulating markets will not do away with the eventual revelation of unintended consequences from the accrued sins derived from redistributionist 'trickle down' capital consumption policies.

Phony Boom has now been morphing or transitioning into a Bust.

Tuesday, December 29, 2015

Phisix Ends 2015 with Marking the Close Pump!


All actions have consequences. 

Price fixing actions or the ongoing blatant market manipulations at the Philippine Stock Exchange will have ramifications too.

While the consensus and or the establishment continue to deliberately ignore or overlook on the brazen misdeeds (largely because of the benefits from political-economic rent) transpiring at the PSE, eventually history will put into context the (untoward) effects of such price distorting actions. And current developments appear to already been indicative of such direction.

So my continued posting on these have been intended to expose on how manipulations will not only aggravate market distortions or exacerbate on the imbalances, but most importantly it will fail to attain the objectives and worsen the outcomes.

Today December 29 marks the end of the trading activities at the PSE for the year 2015.

After all the ‘this time is different’ boom scenario sold by the establishment from the year’s nascency, the PSE ended the year DOWN 3.85%. 

Virtually NO one in the consensus saw this coming as every ‘experts’ predicted the linearity of price momentum. Importantly the public was been blinded by media’s propaganda and statistical manipulation employed by the political order.

Of course, what makes 2015 remarkable has been the massive or intensive use of market manipulations. "Marking the close" has been the most frequently used index management tool. Yet there were other instruments used to massage the index, like afternoon delight pumps and panic buying during global selloffs. 

All these brought about a series of record highs which peaked in April 10 2015 at 8,127.48. Unfortunately, a short lived glory.

And even then, market manipulations were basically concentrated to a few issues or a rotational pump in 10 out of 15 biggest market cap issues even as HALF of the PSE universe had fallen to the domain of bear markets.

Eventually it turned out that despite the PSE’s censorship, corporate fundamentals had shown signs of deterioration as manifested by the negative NGDP growth and deficit in earnings of listed companies in 2Q.

Manipulations didn’t save the Phisix from the August 6.7% collapse, as with the negative annual returns for 2015.

Well anyway, what a way close 2015.

Marking the close again had been featured during the last two trading days of year (perhaps as part of window dressing)!


51% or 19.91 points of losses had been shaved at the pre-runoff to end Monday December 28’s trading session down by .27%.  

At Php 3 billion, Monday’s session highlighted the LOWEST volume since January 2014!


It’s no different today where 46% or 27.01 points of the intraday losses were pared down from marking the close.

What’s incredible has been that while the pump had been ostensible in all 5 major sectoral indices, it appears that only a few issues delivered the gist.

The major issues that buoyed the index from big losses were…


JG Summit which was pumped 2.8%! Negative suddenly became positive!

Robinsons Land was likewise pushed 1.3%! Again negative transformed into unchanged!


BDO was spiked by 1%! Same story negative morphed into positive!

From the peak of 8,127.48, the Phisix closed 2015 down 14.46%.

This shows that at the end of the day, manipulations will fail.

(charts above from colfinancial, PSE and technistock)

Monday, December 28, 2015

Quote of the Day: The Government Can Not Only Evoke Fear But Also Superstitious Reverence

The government can not only evoke fear in its victims; it can also evoke a sort of superstitious reverence. It is thus both an army and a church, and with sharp weapons in both hands it is virtually irresistible. Its personnel, true enough, may be changed, and so may the external forms of the fraud it practises, but its inner nature is immutable.
This quote is from page 182 of H.L. Mencken’s essay “On Government,” as reprinted in the 1996 Johns Hopkins University Press collection of some of Mencken’s essays, Prejudices: A Selection

tip of the hat to Cafe Hayek

Thursday, December 24, 2015

Tuesday, December 22, 2015

Phisix 6,950: Another Remarkable Price Fixing Day!


Today marks another remarkable price fixing day!

First, price fixers deployed a late afternoon delight pump on the holding (right) and the industrial sectors (left). 

Massaging the index started with the holding sector where pumping actions came at mid afternoon. 

On the other hand, the industrial sector’s panic buying appeared near the runoff period. But both sectors hardly exhibited any significant 'marking the close' actions.


The end minute price fixing was instead applied to other two sectors.

To ensure that the Phisix closed up significantly higher, index managers cemented this with a twin 'marking the close' pump on the Financial and their present favorite or darling,  the property sector.

Marking the close constituted a whopping 85% of the Financial sector’s .81% gains, as well as, a mind blowing 82% of the property sector’s .87% advance. [charts above from colfinancial]

Part of the property sector's windfall emerged from ALI’s .56% advance today.


Yet ALI's gains emerged from a last minute astounding 1.13% pump which suddenly converted losses (red digits) into gains! 

Meanwhile, SMPH's last minute push was much less than that of ALI.


As for the financial sector, a staggering 80% of BPI’s 2.69% advance emerged from the same dynamics! 


And so with 61% of BDO’s 1.26% gains!

Just awesome!


The PSEi's index pump as seen from different providers (Bloomberg, technistock and colfinancials)


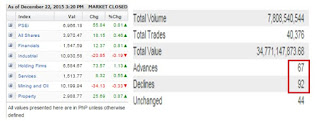
Today’s staggering index manipulation came as decliners beat advancers 92-67!


For the second day, broad markets were sold but index were pushed up. The difference between yesterday and today has been the flagrant use of late afternoon delight pump coupled with marking the close! (tables from PSE)

Notice too that the index pumps came with very slim volumes: Php 3.999 billion (yesterday) and Php 4.59 billion (today). 

However today’s end of the day volume was recorded at Php 34.771 billion. And that’s because Php 30.185 billion or 86% of volume arose from block sales of Star Mall.

The PSE lately warned the public about investment scams. Curiously what do you call price fixing or marking the close?

My post has been intended to document the ongoing rampant and brazen stock market manipulations for posterity or for history. Years from now, perhaps some people may come to see how things came about or how today's distortions shaped future price conditions.

Quote of the Day: Monetary Policy Cannot Solve All Economic Problems That May Ail Our Economies; What happens When The Fed Stops Distorting Prices?

The authority of monetary policymakers to intervene in financial markets has come to be accepted and expected. Whether the purpose is to change the relative price of various assets, such as long vs. short dated Treasuries, or to alter the allocation of credit, such as Treasuries vs. mortgage-backed securities, the result has been a much more interventionist central bank. The belief is, of course, that central bankers know enough to control relative asset prices with sufficient precision and that the transmission mechanisms and consequences are sufficiently predictable that policymakers can better control real economic growth and employment, and now, financial stability.

I find this a dubious proposition at best. For central banks to act as if these conditions exist suggests to the public that monetary policy has great ability to fine tune economic outcomes. That means monetary policy makers may well be accepting more responsibility for managing economic outcomes than they, in fact, can deliver. This is a recipe for failure and can undermine the public’s trust and confidence in the central bank. So maybe a little more humility on the part of central bankers and the public regarding what they monetary policy can accomplish is in order and a little less intervening just because it can, or has the power or authority, may be prudent. Monetary policy simply cannot solve all economic problems that may ail our economies.
(bold added)

This quote is from Charles Plosser former President, Federal Reserve Bank of Philadelphia and former Dean, Graduate School of Business Administration, University of Rochester as interviewed by the Money and Banking blog

More juicy quotes (bold mine)
As I mentioned, no regulatory authority anywhere in the world, no central bank no financial supervisory agency, saw the crisis coming. What makes us think we will spot the next one? Whenever it arises it will surely come from somewhere the authorities were not looking.

We face a number of challenges. First we have the problem of defining financial stability. I know of no good definition. Without a definition how do we know if we have succeeded? How do we know if we have over compensated and reduced risks too much without some metric that tells us of the trade-offs? Implicit in the Dodd-Frank legislation is the view that if only we could write enough rules and prohibitions on the financial sector we could solve the problem. I believe this is a bit like the dog chasing its tail, and equally futile.

Second we should acknowledge that stability risks can move around. Where regulators look, those risks are unlikely to be found. The challenge is figuring out where they will show up next. Financial markets are adept at packaging and repackaging risks in forms that the market will buy. There is nothing inherently wrong with this except regulators will always be behind the market developments.

Finally, the central bank should be particularly vigilant in not artificially encouraging financial imbalances or stability risks through its monetary policy actions. Unfortunately, this may bring financial stability and the goals of monetary policy into stark conflict. There is an ongoing and important debate on this issue. That is, should monetary policy be used to address financial stability risks or not; what if it’s a source of the risks?

Today the stated goal of the interventions undertaken by the Fed such as the asset purchases or the maturity extension program have been intended to encourage risking-taking and alter the portfolio balances of economic agents. If successful, these actions distort market prices. One stability risk worth considering is: What happens when the Fed stops distorting prices?
Wow! Ambiguity in the definition of financial stability, stability risk in a state of perpetual flux (or also policy or political response as 'fighting the last war' or dealing with past rather then present evolving problems) and most importantly, treating symptoms while encouraging the disease (financial imbalances) seem as an implied rebuke on central banking's "macroprudential policies" and the Basel Standard!

Infographics: 33 Indicators that Bitcoin is Alive and Well and Will Grow in 2016

The Bargain Fox explains why bitcoins, in spite of present ordeals, hasn't been slowing down and will continue to grow in 2016.
When Satoshi Nakamoto launched Bitcoin in January 2009 it was the beginning of a revolution. The original block in the blockchain was encoded with a bleak snapshot of the failing financial system, a small quote from the UK Times newspaper:  "Chancellor on brink of second bailout for banks." 

It was banks, central control and corrupt government policy, that the fledgling cryptocurrency was hoping to replace. While it has not yet overthrown the financial institutions of old, nearly 7 years on it's still closer to doing so than many people had imagined.

Like all groundbreaking technologies there were technical teething problems, naysayers and outright battles. Some governments tried to outlaw its use (and some have succeeded). The negative PR stemming from the currency's ties to the illegal dark net markets may have scared some people off. And the early adopters were well and truly screwed over when they stored their digital funds in the Mt. Gox exchange, because hundreds of millions of dollars worth went missing.

Yet here were are, closing in on 2016 and bitcoin is alive and well. In fact it's doing better than ever and our new infographic demonstrates that the only way is up, in terms of value and usage.

Indeed the dollar price of BTC has been steadily rising since the start of the year, regaining ground after its first major crash. In just the past 3 months it has doubled its value by a $200 increase and there's no sign of that slowing down as 2016 emerges.

As for the actual trading volume at the exchanges and the overall growth of the exchanges themselves - well both are skyrocketing. From October 2014 to October 2015, OK Coin from Singapore has grown 847%, and even the more western-centric BitStamp has doubled within the year. The market is managing to move $289 million worth of BTC on a daily basis, more than Western Union ($216m) and closing in on PayPal ($397m).

Meanwhile online and offline merchants are increasingly adding bitcoin as a payment method, supported by bitcoin payment service providers such as Coinify, Europe's leader in processing wide range of digital currency payments. Not just to keep customers happy but because it actually costs them less to process. A negligible 1% is charged for BitPay premium members compared to the major credit card networks, which range between 2% and 6%. This has contributed to the jump from 65,000 merchants accepting BTC to 100,000 plus. While we can imagine some scenarios where it isn't beneficial to the customer, retailers like TigerDirect are proud to reveal that bitcoin prevents fraudulent chargebacks which are very common with customers using credit cards.

In short all you really need to know is that giants like Microsoft, Expedia and Time Inc. have embraced BTC and many others are following suit. August 2015 saw BitPay's most successful month, recording 70,000 transactions. 

In turn, as this demand has increased so has the venture capital funding the user-friendly apps, bitcoin ATMs, exchanges, and other technology. In 2012 only $2 million was pumped in to the industry. So far in 2015 this has reached $469 million! 

Perhaps the last remaining concern for the bitcoin revolution is overcoming volatility, the freak fluctuations in value. Thankfully the facts don't lie. As the market has grown the impact of panic and large volume trading has lessened. From 2011 to 2015 the line is quite simply going down. For regular traders who exploit volatility this might not be good, but for those who want a simple electronic currency that is out of the reach of the old monetary guard, then we're on the revolutionary track that Satoshi Nakamoto laid down. 

For 33 indicators that prove the only way is up for Bitcoin, check out our new infographic.
Disclosure: Presently I do not own bitcoins. But sometime in the future, I may test the waters. 

As noted above, bitcoin or cryptocurrencies are in the process of evolving. And bitcoin or cryptocurrencies have been challenged mainly by authorities who see the emergence of online decentralized payment and settlement platform as threat to their monopoly control of central banking fiat money. Nonetheless, cryptocurrencies  will likely play a much bigger role in the coming years.
Made by: BargainFox