Showing posts with label Philippine real estate. Show all posts

Sunday, April 21, 2024

The Philippines’ Top 5 Property Developers: 2023 and Q4 Performance: The Seen and Unseen


Like all bubbles, it ends when the money runs outAndy Kessler


In this issue:


The Philippines’ Top 5 Property Developers: 2023 and Q4 Performance: The Seen and Unseen

I. Top 5 Property Developers: Remarkable Headline Performance in 2023

II. 2023 Top 5 Property Developers:  Beneath the Headlines, Soaring Debt, Interest Expense and Decaying Liquidity

III. Big Boys’ Club: Q4 2023’s Incredible Spike in Real Estate Sales!

IV. The Real Estate Sector’s Predicament: More Signs of Escalating Concentration and Other Risks

V. Slowing Consumers, Rising Risks of a Material Slowdown in Rental Revenues

VI. Rising Imbalances from Credit-Funded Real Estate Demand Amidst Rising Debt-Financed Supply

VII. How Inflation Benefited the Top 5 Developers and Why this is Unsustainable

VIII. The BSP’s Path Dependence: The Rescuing of Banks and the Property Sector


The Philippines’ Top 5 Property Developers: 2023 and Q4 Performance: The Seen and Unseen


The Philippines' top 5 real estate developers showed an impressive headline performance in 2023 and Q4. Beyond that, there are rising risks from multiple fronts.


I. Top 5 Property Developers: Remarkable Headline Performance in 2023


Here's a summary of the aggregate financial performance of the top 5 PSE-listed property developers—or the 'Big Boys Club' (BBC)—in 2023. The firms included are SM Prime Holdings [PSE: SMPH], Ayala Land [PSE: ALI], Megaworld [PSE: MEG], Robinsons Land [PSE: RLC] and Vista Land & Lifescape [PSE: VLL].


The headlines looked great!

Figure 1


First. Despite a 15.4% increase to Php 422.7 billion, revenues remained lower than the 2019 record of Php 431.2 billion. (Figure 1 topmost pane)


Moreover, the pace of growth moderated from 19.9% in 2022 to 15.4% last year. SM Prime led the pack with a 21.09% growth rate, while RLC's 7.7% contraction pulled revenues lower.


Second.  Real estate (RE) sales surged from 7.8% to 11.03% in 2023, driven by ALI and VLL's growth of 20.44% and 19.07%, respectively. It's important to note that ALI's RE sales included rental revenues. However, RE sales in pesos remained 12.8% below the 2019 peak. (Figure 1, second to the highest image)


But here’s the thing: since peaking in 2021, the share of RE revenues to the total plummeted to its lowest level in 2023, indicating that the bulk of the BBC’s revenues emanate from rent. (Figure 1, second to the lowest graph)


Third. While rental revenues represented the core, growth slowed from 51.5% to 20.7%.   In pesos, rental revenues in 2023 reached an all-time high of Php 157.6 billion, surpassing the previous milestone of Php 133.43 billion set in 2019. (Figure 1, lowest chart)

Figure 2


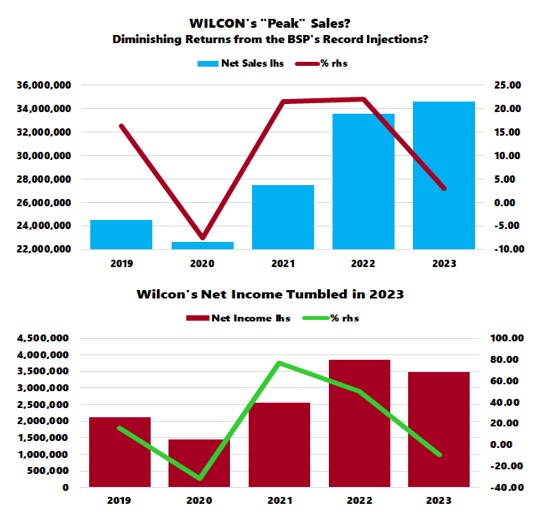
Fourth. Net income reached a record of Php 112.9 billion, marking a brisk increase of 29.6% or a net gain of Php 25.8 billion. This marks the second consecutive year of 29% growth in 2023. VLL and SMPH posted the fastest growth, with increases of 39.2% and 32.92%, respectively. (Figure 2, topmost visual)


II. 2023 Top 5 Property Developers:  Beneath the Headlines, Soaring Debt, Interest Expense and Decaying Liquidity


Fifth.  The cumulative debt level surged to a record Php 950.5 billion, marking a 5.8% increase and reaching back-to-back record highs in pesos. (Figure 2, second to the highest window)


While the pace of increase was slower than income or revenue growth, it still grew by Php 52.31 billion, more than DOUBLE the income growth.


Ayala Land and SMPH, the two largest developers, saw the most significant peso gains of Php 22.215 billion and Php 14.3 billion, respectively.


Sixth. High-debt loans and elevated interest rates pushed financing costs higher. Interest expenses surged by 14.6%—the second-highest growth rate since 2018—to a historic Php 5.121 billion in 2023, representing the highest-level share of revenues at 1.21%. (Figure 2, second to the lowest graph)


Seventh and last.


The cash reserves of the Big Boys Club fell for a second consecutive year to their lowest level since 2018, dwindling to Php 90.4 billion. This represents the lowest level in the context of cash-to-debt and cash-to-interest payments since 2018. (Figure 2, lowest image)


With record net income and debt increases, why the plunge in the BBC’s liquidity conditions?


Are these companies overstating the headlines or understating the delinquencies?


That's the unseen segment behind the good news.


III. Big Boys’ Club: Q4 2023’s Incredible Spike in Real Estate Sales!


More to the point.


Another perspective is the performance on a quarterly basis. After all, the annual report signifies an accumulation of the four quarters. From here, we observe changes that led to the annual outcome.


Surprisingly, after slightly picking up in Q2 and Q3 compared to last year and Q1's slack, real estate sales spiked in Q4, both in peso (Php 78.8 billion) and in percentage (25.8% YoY).


However, it's important to note that ALI includes rent in its real estate revenues.

Figure 3


The record surge in RE sales (in pesos) powered total revenue growth (20.3% YoY) to a fresh record of Php 126.4 billion. (Figure 3, topmost chart)


Stunningly, the Q4 spike elevated the sales level of the Big Boys' Club, resulting in its higher share of Q4 (nominal) NGDP. (Figure 3, second to the highest image)


IV. The Real Estate Sector’s Predicament: More Signs of Escalating Concentration and Other Risks


Alternatively, if the Real Estate GDP estimates are accurate, the BBC accounted for 35.35%, which means that even with numerous competitors, the group continues to corner a larger share of the industry!  Talk about the Big Boys getting Bigger! (Figure 3, second to the lowest diagram)


The Real Estate NGDP and Real Estate revenues seem to have parted in direction in Q4.  (Figure 3, second to the lowest window)


With the spike in RE revenue growth and a 35% share, it's curious that the industry reported only an 8.7% growth rate (NGDP)—which likely indicates that the rest of the playing field experienced significantly below-average growth in Q4!


Or, has the BBCs cannibalized the markets of their lesser competitors, including the SMEs?


Importantly, it reveals the industry’s mounting concentration risks.

Figure 4


After all, the sector's declining contribution to real GDP, coupled with its increasing share of the bank lending portfolio, is symptomatic of credit-fueled overspending or malinvestments. (Figure 4, topmost chart)


Rising vacancies are just another sign of imbalances or supply-demand disorder.


Furthermore, given that the growth of the BSP’s real estate index materially slowed in Q4, this likely indicates a slowdown in speculative activities in the secondary markets, with the same activities shifting towards sales via the primary markets (property acquisition via developers). (Figure 4, middle picture)


It is important to point out too that the property sector and banks are closely intertwined or "joined at the hip." The property sector accounted for a significant share of Universal Commercial Bank loans: 23.8% of production loans, 21.1% of net RRPs loans, and 20.4% of gross RRPs loans. (Figure 4, lowest diagram)


That is to say, the industry’s decaying liquidity conditions and overreliance on leveraging to generate revenue and income growth are also manifestations of accruing imbalances.


V. Slowing Consumers, Rising Risks of a Material Slowdown in Rental Revenues


There’s more.


Risks are rising even in the industry’s core revenues: rental operations.

Figure 5


The decelerating cumulative revenue growth of listed non-construction retailers (SM Retail, Puregold, Robinsons Retail, SSI Group, Philippine Seven, and Metro Retail) mirrors the moderating growth of the BBC's rental revenues. (Figure 5, topmost window)


Since reaching its peak of 28.6% in Q2 2022—attributed to the BSP’s unprecedented injections and the ‘reopening’—year-over-year growth has steadily declined. The aggregate sales growth of the retail titans slowed further from 8.27% to 8.23% in Q4. (Figure 5, middle image)


Following the money trail, the slowing universal commercial bank credit growth rate has aligned with the BBC’s rent revenue growth. Credit growth has been indicative of the demand for rents.


By inference, rising rates would eventually exert pressure on rental revenues as vacancies increase due to retailers' faltering viability.


In short, misled by false monetary signals, retail entrepreneurs rush in to capitalize on the highly anticipated boom in consumer spending, even as the latter’s spending capacity is being eroded by inflation, the crowding-out effects of deficit spending, and malinvestments.


Such increasing divergence should amplify the exposure of malinvestments as unviable ventures.


VI. Rising Imbalances from Credit-Funded Real Estate Demand Amidst Rising Debt-Financed Supply


It's not just rent, but also the demand for real estate that has been anchored by bank credit expansion.


Therefore, it's unsurprising to see real estate (RE) revenues boosted by an upswing in the bank's consumer real estate credit growth.


The banking system’s real estate consumer loans grew by 7% in Q4 2024. However, its 38.4% share of consumer loans signifies the lowest since March 2020, as credit cards and salary loans have outperformed. (Figure 5, lowest diagram)


By the same token, unless productivity defines the character of the economy's development, the increasing credit-funded bets on the property sector would prove unsustainable.


Rising supply in the face of leveraged demand further magnifies its various financial and economic risks.


VII. How Inflation Benefited the Top 5 Developers and Why this is Unsustainable


That's not all.

Figure 6


The era of inflation has benefited property firms. Profit margins rose alongside the core CPI. Expanded profit margins have contributed immensely to the so-called 'bottom line,' supported by bank credit growth. (Figure 6, topmost and middle charts)


The fact of the matter is that the industry breathes in leverage, which drives the industry’s survival and expansion while providing less and less economic value added. (Figure 6, lowest graph)


The fiat money-based financial system requires ascending property prices to increase collateral values that buttress credit expansion. Therefore, policies have always been geared towards this process.


Unfortunately, diminishing returns plague the artificial boom from inflationism—where rising rates in response to inflation, malinvestments, and falling savings offset easy money policies.


VIII. The BSP’s Path Dependence: The Rescuing of Banks and the Property Sector


Ultimately, despite elevated inflation, the BSP will likely resort to its 'path dependence' of implementing an easy money regime when confronted with economic and financial risks.


It will likely deliver the 2020 bailout template, incorporating a mix of monetary policy rate cuts, direct and indirect liquidity injections (via financials), and revive, extend, and expand capital, regulatory, and operational relief measures.


On the other hand, political authorities will ramp up their fiscal tools, 'stabilizers,' where the political justification to increase defense spending will likely play a critical role in the coming series of 'stimulus.'


Deficit spending to GDP will hit new milestones.


The vent for all the series of political rescues of the elites will be vented on the exchange rate: the USD Peso.


Figure 7


Lastly, the recent market rout stock market rout has been led by the shares of the BBC.  


If anything, the recent downshift in their share prices reinforces a massive "rounding top." (Figure 7)


Have share prices of the Big Boys' Club been showing the way?


Sunday, April 07, 2024

Wilcon Depot’s Dismal 2023 Performance Exposes the Fragile State of the Philippine Consumers and the Real Estate Industry


What can be predicted with absolute accuracy is that fiat money, fractional-reserve banking, central banks, Keynesian monetary policies, and self-serving politicians will combine to ensure that there will be many more booms and speculative bubbles for future economists and historians to chronicle—Doug French


In this issue


Wilcon Depot’s Dismal 2023 Performance Exposes the Fragile State of the Philippine Consumers and the Real Estate Industry

I. Wilcon’s Sluggish 2023 Performance: A Manifestation of the Real Estate’s Lethargic Conditions

II. Poor Demand from High Vacancy Rates

III. Economic Imbalance: Brisk Inflation of Home Prices Unsupported by Construction Permits

IV. Wilcon’s Stagnant Topline Reflected the Sector’s "Disinflation"

V. Diminishing Returns from Credit-Driven Demand

VI. The Downtrend in Construction and Real Estate GDP

VII. WLCON’s "Build and They Will Come" Strategy


Wilcon Depot’s Dismal 2023 Performance Exposes the Fragile State of the Philippine Consumers and the Real Estate Industry


Wilcon Depot's lethargic 2023 performance manifested the increasing fragility of the Philippines' consumers and the real estate sector.


I. Wilcon’s Sluggish 2023 Performance: A Manifestation of the Real Estate’s Lethargic Conditions


Manila Bulletin, March 22, 2024: Wilcon Depot Inc., the Philippines’ leading home improvement and finishing construction supplies retailer, posted a 9.5 percent drop in net income to P3.48 billion last year as expansion-related expenses resulted in rising operating costs. In a disclosure to the Philippine Stock Exchange (PSE), the firm said net sales improved 3.1 percent to P34.604 billion in 2023 due mainly to the sales generated from the new stores. Gross profit also expanded 4.3 percent to P13.69 billion…“The softness of the market persisted through the fourth quarter, which led to a modest growth in our topline for the year, 100% of which was contributed by the new stores,” said Wilcon Depot President and CEO Lorraine Belo-Cincochan. She noted that “comparable sales dipped by 3.4 percent, impacting directly our net income as operating expenses conversely continued to grow...” “In 2023, on the other hand, there was an apparent slowdown in home improvement spending not only here but globally as well. Despite this slowdown, we continue to pursue our 100-store goal by 2024, a year earlier than initially planned. We believe that we have to be in the best position to serve our market once home improvement spending rekindles,” Belo-Cincochan said. Wilcon opened nine stores in 2023 and ended the year with 90 stores as it also closed one Home Essentials branch and replaced another one with a new depot. (bold mine)


Wilcon Depot [PSE: WLCON], a leading retail chain focusing on home improvement and construction supplies, represents the downstream segment of the real estate industry. Its primary clientele consists of end-users in the industry: individuals, households, commercial enterprises, and public establishments.


Fundamentally, the primary drivers of topline performance are people's time preferences and subjective values, which are expressed through economic and financial conditions. These conditions are influenced by the political climate and are typically measured by occupancy or vacancy rates (aside from affordabiity).


For instance, there should be strong demand for its product line during a productivity-driven boom, characterized by nearly 'full' occupancy rates. However, demand dominated by credit-fueled cycles is fleeting and subject to boom-bust cycles.


Repairing the household/corporate balance sheet is also another example that illustrates the priority of building up savings rather than committing to expenditures—a shift from short-term to long-term preferences.


And the transmission effect, as predicted last July,


…a cutback in new edifices translates to reduced demand for interior furnishing, decorations, and other post-construction activities.  


Since the deceleration involved the upstream, the lagged transmission has yet to diffuse into the downstream—WLCON's market. (Prudent Investor, 2023)


Figure 1


The media reported that despite store expansions, WLCON’s sales growth stagnated at +3.1%, while net income declined by 9.5% in 2023.


This slowdown has been admitted by WLCON's CEO:


-The softness of the market persisted through the fourth quarter

-In 2023, on the other hand, there was an apparent slowdown in home improvement spending


There you have it. The soft spot in the real estate sector spilled over to the downstream—Wilcon’s market.


Why so?


II. Poor Demand from High Vacancy Rates


Firstly, real estate vacancy rates remain elevated, spreading from offices to commercial and residential properties.


Although the BSP is aware of this situation, they are left in a quandary:


At present, there seems to be some surprising trends in the residential sector, with prices rising in tandem with vacanciesWith the loan portfolio of banks significantly invested in real estate activities, prudence requires a second look. Are housing prices rising because of the rising cost of construction and development? Is this, instead, an indication of generational wealth planning getting ahead of the supply that has been delayed by COVID-19? Or is this a more ominous sign? (BSP-FSCC, 2023) [bold mine]


Figure 2


Nationwide property price growth, based on the BSP's Real Estate Index, nearly halved from 12.9% in Q3 to 6.5% in Q4. (Figure 2, topmost chart) There was little coverage in the media on this.


Paradoxically, this decline in growth emerged amidst robust bank credit expansion to both the supply and demand sides of the sector. (Figure 2, middle window)


III. Economic Imbalance: Brisk Inflation of Home Prices Unsupported by Construction Permits


Secondly, the demand and supply dynamics of the sector appear to diverge.


While property prices surged in early 2023, construction permits have decreased throughout 2023. (Figure 2, lowest image)


Why this critical aberration? Why haven't higher prices prompted substantial participation in a supply buildup to achieve equilibrium?


Could it be that prices were heavily distorted and unsupported by occupancy rates?


IV. Wilcon’s Stagnant Topline Reflected the Sector’s "Disinflation"


Figure 3


Thirdly, as anticipated, the industry and WLCON's demand were reflected in inflation rates. The PSA's Consumer Price Index for furnishing, household equipment, and maintenance resonated with WLCON's sales. (Figure 3, topmost and middle windows)


The takeaway; if price inflation had been instrumental in bolstering WLCON's topline, disinflation, likely through falling use of credit cards, could most upend this dynamic. (Prudent Investor, 2023)


The law of demand went into action: higher prices resulted in lower quantity demanded. Consequently, the industry reduced prices.


This "disinflation" predicament has been shared by WLCON's competitors.


For instance, last March, IKEA Philippines announced up to 50% price discounts on 430 of their most popular products.


V. Diminishing Returns from Credit-Driven Demand


Fourthly, it appears that credit growth, rather than productivity-driven economic conditions, has propelled WLCON's topline.


Diminishing returns from the explosive growth of Universal Commercial Bank credit cards seem to have weighed on WLCON's revenues. Bank credit card growth seems to have plateaued at the 26-30% range. (Figure 3, lowest graph)


The record employment rate last December 2023 hardly helped WLCON’s cause.

Figure 4


Additionally, while bank lending to the construction industry has surged from Q4 2023 to the present, this increase has not yet diffused into the inflation metrics for the construction industry—NCR wholesale (government projects) and retail prices—which have remained depressed. (Figure 4, topmost image)


VI. The Downtrend in Construction and Real Estate GDP


Fifthly, growth in the construction and real estate sectors has been on a downtrend, as evidenced by their respective GDPs. (Figure 4, middle pane)


Similar to the telecom industry, WLCON initially benefited from the shift to work from home and remote work platforms, which significantly increased demand for renovations and home upgrades.


The historic liquidity injections by the BSP also fueled a speculative leverage boom in the real estate industry, which further stimulated spending on household improvements.


The post-lockdown credit-financed "revenge travel" also fueled a spike in demand for the accommodation and food services sector, contributing to its initial growth.


However, beyond competition, the downtrend in the sectoral GDPs could be ominous.


VII. WLCON’s "Build and They Will Come" Strategy


In essence, WLCON's business model appears to be anchored on the popular "build and they will come" strategy—a distortion of Say’s Law.


Besides, with WLCON's slowing net income increasingly dependent on a sustained increase in profit margins, volatile inflation rates, and exchange rates pose increased risks of a profit margin squeeze. (Figure 4, lowest chart)


Figure 5


Yet despite declaring zero debt, the growth of WLCON's lease liabilities (+10.3% Q4) and interest expenses (+11.7 Q4) continues to outpace revenue (-2.11% Q4) and income growth (-14.7% Q4). (Figure 5, topmost and middle visuals)


Interest expenses grew by 17.7% in 2023. (Figure 5, lowest chart)


As noted last July,


The crux, instead of helping boost the bottom line, new stores weighed on WLCON's operations.  Additionally, rising interest-bearing lease liabilities continue to gnaw on earnings. 


That is to say, slowing financial performance amplifies credit risks—and later, vice versa.


The consensus believes in the eternity of free lunches from the BSP’s easy money regime.


Despite data provided by the government, such as GDP figures, little headway has been made by the consensus in comprehending the adverse impacts of easy money through malinvestments and over-leveraging.


Moreover, everyone seems to think that public spending can only drive consumer growth without considering at whose expense this comes.


Lastly, the consensus has been influenced by the rear-view mirror syndrome or anchoring fallacy—buying into the political flimflam of policy-induced free lunches.


Instead, this cluster of entrepreneurial errant actions from interest rate distortions results in boom-bust cycles. Since actions have consequences, guess what will be the consequence of cumulative errors?


In the end, Wilcon joins the list of consumer companies from different industries, such as JollibeeRobinsons Retail, and Robinsons Land, reflecting the increasingly fragile state of the Philippine economy.


Based on the April 5th close, Wilcon’s PER was at 18.8—a level that reveals an elevated valuation in the face of a material risk of an income slowdown.

___

References


Douglas French, Early Speculative Bubbles and Increases in the Supply of Money, p.117 August 19,1992 Mises.org


Prudent Investor, Wilcon Depot’s Q2 2023 Sales and Income Growth Slump from Corroding Macroeconomic Forces New Stores, and Disinflation, July 30, 2023


FINANCIAL STABILITY COORDINATION COUNCIL FINANCIAL STABILITY REPORT 2023 Bangko Sentral ng Pilipinas p.38