Bulls of 1929 like their 1990s counterparts had their eyes glued on improving profits and stock valuations. Not a thought was given to the fact that the rising tide of money deluging the stock market came from financial leverage and not from savings-Dr. Kurt Richebacher
In this issue:
Q1 2025 PSEi 30 Performance:
Deepening Debt-Driven Gains Amid Slowing Economic Momentum
I. An Extension of 2024's
Fiscal-Monetary Interplay
II. Debt-Led Growth:
Fragile Foundations
III. Revenue Growth:
Record Highs, Diminishing Returns
IV. Consumer Sector
Strains: Retail and Real Estate Under Pressure
V. Net Income Surge: A
Paradox of Profitability
VI. Sectoral Performance:
Diverging Trends
VII. Top Movers:
Individual Firm Highlights
VIII. A Fragile
Foundation: The Risks of Fiscal and Financial Leverage
IX. Transparency and Accuracy Concerns
Q1 2025 PSEi 30 Performance: Deepening Debt-Driven Gains Amid Slowing Economic Momentum
Debt-fueled profits mask deeper signs of strain across retail, real estate, and consumer sectors—even as policy easing and fiscal expansion continue.
I. An Extension of 2024's Fiscal-Monetary Interplay
The PSEi 30’s Q1 2025 performance is largely a continuation of the trends established throughout 2024 and the past decade.
Fundamentally, it reflects the model of "trickle-down" economic development, underpinned by Keynesian debt-financed spending. This model is anchored primarily on the BSP’s policy of "financial repression"—or sustained easy money—combined with fiscal stabilizers. It has manifested through the persistent "twin deficits," driven by a record-high "savings-investment gap," and rests on the “build and they will come” dogma.
Q1 2025 also marks the initial impact of the BSP’s first phase of monetary easing, with Q2 expected to reflect the effects of the second round of policy rate and reserve requirement (RRR) cuts.
At the same time, the all-time high Q1 fiscal deficit—relative to previous first quarters—was clearly reflected in the PSEi 30’s performance.
Nota Bene:
PSEi 30 data contains redundancies, as consolidated reporting includes both parent firms and their subsidiaries.
Chart Notes:
1A: Based on current index members; may include revisions to past data
1B: Historical comparison; includes only members present during each respective period; based on unaudited releases

Figure 1
In Q1 2025, non-financial debt among PSEi 30 firms surged by 7.6% to a record Php 5.87 trillion, with a net increase of Php 413 billion, marking the third-highest quarterly rise since 2020. (Figure 1, upper window)
In context, this debt level accounted for about 17.12% of total financial resources (bank and financial assets), up from 16.92% in 2024, reflecting increased leverage in the financial system
In addition, bills payable for the top three PSEi 30 banks soared by 117.5%, rising from Php 393 billion to Php 854 billion, a net increase of Php 461 billion, excluding bonds payable.
This dramatic increase in the bank’s short-term borrowing likely stems from a sharp decline in the banking system’s liquidity metrics—specifically, the cash and due-from-banks-to-deposits ratio and the liquid assets-to-deposits ratio.
III. Revenue Growth: Record Highs, Diminishing Returns
Gross revenues for the PSEi 30 rose by 3.92% to a record Php 1.78 trillion in Q1 2025. However, the net revenue increase of Php 67 billion was the smallest in the past four years, signaling a clear deceleration in growth momentum. (Figure 1, lower image)

Figure 2
This revenue softness partly reflected disinflationary trends, as the Consumer Price Index (CPI) fell to 2.3%—marking its third consecutive quarterly decline. (Figure 2, topmost chart)
This occurred despite the economy operating near full employment, with the average unemployment rate at 4%, all-time high Q1 fiscal deficit, and amid record levels of bank credit growth, particularly in consumer lending. (Figure 2, middle graph)
Nonetheless, the validity of the near-full employment narrative appears questionable. Our estimates suggest that approximately 32% of the workforce remains 'functionally illiterate,' raising concerns about the accuracy of PSA labor market data.
Yet, the paradox is telling: even with aggressive fiscal stimulus and sustained easy money policies, economic returns appear to be diminishing.
The PSEi 30’s revenue slowdown closely mirrored real GDP growth of 5.4% in Q1 2025, reinforcing the broader downtrend. (Figure 2, lowest diagram)
Nevertheless, the PSEi 30 revenues accounted for 27% of nominal GDP in Q1 2025, underscoring their substantial footprint in the Philippine economy. Broadening the scope of PSE-listed firms in national accounts would likely magnify this contribution—while simultaneously highlighting the risks posed by mounting economic and market concentration and the fragile underpinnings of "trickle-down" economic development.
IV. Consumer Sector Strains: Retail and Real Estate Under Pressure

Figure 3
Consumer sector stress was evident in the performance of PSE-listed firms. While retail nominal GDP grew by 7.9% and real consumer GDP by 4.9%, Q1 2025 sales revenue growth for the six largest non-construction listed retail chains—SM Retail, Puregold, SSI Group, Robinsons Retail, Philippine Seven, and Metro Retail Group—slowed to 6.8%, down from 8% in Q4 2024. This deceleration occurred despite aggressive supply-side expansion, underscoring deteriorating growth dynamics. (Figure 3, upper pane)
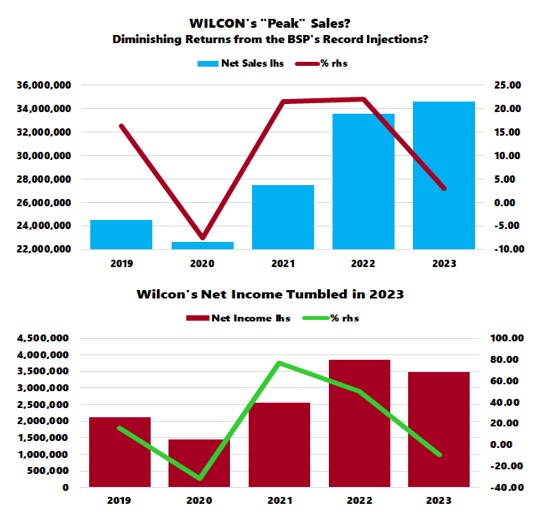
Since peaking in 2022, both statistical (GDP) and real indicators (sales) have undergone significant depreciation. Downstream real estate consumer publicly listed retail chains, Wilcon Depot (WLCON) and AllHome (HOME), continue to grapple with substantial challenges, as rising vacancies further deepen the ongoing sales recession. (Figure 3, lower image)
For example, WLCON reported a 2% quarter-on-quarter
increase in store count, but only a 1.2% increase in sales YoY—highlighting
excess capacity amid softening demand.

Figure 4
The food services sector also showed signs of strain, despite posting 10.3% revenue growth in Q1 2025—outpacing both nominal and real GDP. (Figure 4, topmost visual)
Jollibee’s domestic operations, which accounted for 80% of total group sales, led the sector with a 14% gain.
In contrast, McDonald’s reported an 11.5% sales contraction despite its 'aggressive store expansion' strategy, which includes plans to open 65 new outlets in 2025. This disparity underscores uneven, yet broadly weakening, performance across major retail chains. (Figure 4, middle chart)
Even electricity consumption has recently deteriorated. Meralco’s electricity consumption growth slowed to 1.5% (in GWh), diverging from historical GDP correlations. This downturn signals weakening underlying demand, despite near-full employment and record-high bank credit expansion. (Figure 4, lowest graph)
V. Net Income Surge: A
Paradox of Profitability

Despite revenue challenges, the PSEi 30’s net income amazingly surged by 16.02% to a record Php 290.6 billion in Q1 2025, with an absolute increase of Php 40.12 billion, the second-highest since 2020. (Figure 5, topmost diagram)
This was driven by a significant increase in net income margin, which reached 16.3%, the highest since 2020, possibly due to asset sales (e.g., SMC’s divestitures). (Figure 5, middle window)
Excluding SMC’s asset sales, PSEi 30’s net income would have stood at Php 269.3 billion—reflecting only a 7.6% increase. This equates to a net profit rise of Php 19.12 billion, rather than the reported Php 40.12 billion
The record Q1 fiscal deficit likely bolstered incomes, both directly through government contracts (e.g., infrastructure projects) and indirectly via increased consumer spending. However, this came at the cost of record public debt and systemic leverage, which reached Php 30.7 trillion. Public debt hit an all-time high of Php 16.683 trillion. (Figure 5, lowest image)
The PSEi 30’s debt-to-net income ratio revealed that Php 1.42 in net debt additions was required for every peso of profit generated. In terms of absolute gains, Php 10.3 in new debt supported each peso of profit increase, highlighting deepening debt dependency.

Figure 6
Paradoxically, despite record borrowing and improved net income, net cash reserves fell to 2022 levels, raising more concerns about systemic liquidity. (Figure 6, upper chart)
VI. Sectoral Performance: Diverging Trends
By sector: (Figure 6, lower table)
Debt: The industrial sector recorded the largest percentage increase at 48.9%, but holding companies led in absolute peso gains Php 165.644 billon, followed by industrials Php 151.4 billion.
Revenues: Banks achieved the highest percentage revenue growth at 9.8%, but industrials led in nominal terms with Php 17 billion in gains.
Net Income: Holding and property sectors posted the largest percentage increases at 31% and 7.6%, respectively, with holding firms leading in peso terms Php 33.8 billion.
Cash: The services sector saw the largest increases in both percentage (30.9%) and peso terms (Php 56 billion).
VII.
Top Movers: Individual Firm Highlights

Figure 7
By firm: (Figure 7, upper table)
Debt: Ayala Corp, San Miguel Corporation (SMC), and Aboitiz Equity Ventures (AEV) recorded the largest peso increases at Php 74 billion, Php 70 billion, and Php 62 billion, respectively. LT Group (LTG) showed a substantial reduction of Php 24 billion.
Interestingly, SMC reported a reduction in total debt—from Q4 2024’s record Php 1.56 TRILLION to Php 1.511 TRILLION in Q1 2025—despite substantial capital and operating requirements. This decline coincided with a surge in income, primarily driven by Php 21 billion in energy asset sales (San Miguel Global Power Holding LNG Batangas facility). Even excluding one-off gains, core profits rose by 31% to Php 19 billion. The company also strengthened its cash position, with cash reserves increasing by Php 57 billion year-on-year. How did this happen? (Figure 7, lower graph)
Revenue: GT Capital (GTCAP) and Meralco posted the largest revenue increases at Php 15.6 billion and Php 9 billion, while SMC recorded the largest decrease at Php 31.8 billion.
Net Income: SMC led with a Php 34 billion increase, driven by asset sales, while JG Summit (JGS) reported the largest decline at Php 7.2 billion.
Cash: ICTSI and SMC posted the largest cash expansions at Php 79.9 billion and Php 57.6billion, while LTG (due to debt repayment) and AEV had the largest reductions at Php 38.2 and 15.015 billion
VIII. A Fragile Foundation: The Risks of Fiscal and Financial Leverage
Consider the potential impact on the PSEi 30, the broader PSE, and GDP when:
-Bond vigilantes demand fiscal prudence, pushing interest
rates higher
-Heavily leveraged consumer adopt austerity measures.
-Malinvestments from "build and they will come" industries, such as over saturation in real estate (26% residential condominium and office condominium vacancy rates and 22% per Colliers Philippines), and trade sectors, could lead to rising unemployment.
These risks, compounded by diminishing stimulus effectiveness, threaten the sustainability of PSEi 30 performance and GDP growth.
For instance, SMC’s business model has become increasingly reliant on recycling its borrowings or asset sales, making it wholly dependent on the sustainability of cheap money to refinance its rapidly growing debt. Neo-Keynesian economist Hyman Minsky famously characterized this as 'Ponzi finance.' (Minsky,1992)
In essence, the structural risks are real—and growing more visible in each earnings season.
IX. Transparency and Accuracy Concerns
As previously stated:
"The credibility of this analysis rests on disclosures from the Philippine Stock Exchange and related official sources. However, questions persist regarding the possible underreporting of debt and the inflation of both top-line and bottom-line figures by certain firms." (Prudent Investor, May 2025)
These concerns underscore persistent governance challenges—particularly if elite-owned firms are engaged in systematically underreporting liabilities and overstating revenues or profits. Such practices not only contribute to the distortion of market signals but also foster moral hazard, eventually eroding investor confidence and undermining regulatory integrity.
___
References
Hyman P. Minsky, The Financial Instability Hypothesis* The Jerome Levy Economics Institute of Bard College May 1992
Prudent Investor, The PSEi 30 in 2024: Debt-Fueled Expansion Amid Fiscal and Monetary Shifts, Substack May 25, 2025