A lack of transparency results in distrust and a deep sense of insecurity — Dalai Lama
In this issue
Q2–1H
Debt-Fueled PSEi 30 Performance Disconnects from GDP—What Could Go Wrong
I.
PSEi 30 Q2 2025: The Illusion of Resilience
IA. Q2 GDP at 5.5%: Headline Growth vs. Corporate
Stagnation
IB. Structural Downtrend and Policy Transmission
Breakdown
IC. Real Value Output in Decline, Political Optics and
GDP Credibility
ID. Meralco’s Electricity Consumption Story: A Broken
Proxy
II.
Real Estate: The Recovery That Wasn’t
IIA. Overton Window vs. Market Reality
IIB. Property Developer Falling Revenues, Debt Surge and Liquidity Strain
IIC. Downstream Demand Weakness: Home Improvement &
Construction Retail
III.
Retail and Food Services: Mixed Signals
IIIA. Retail: Consumer Strain Amid Policy Sweet Spot
IIIB. Divergence Between Store Expansion and Organic
Demand, Retail Growth vs. GDP Trends
IIIC. Food Services: Jollibee’s Dominance and Sector’s Growth
Deceleration
IV.
Banking Revenues and Income: A Stalling Engine
IVA. Banking Sector: Credit Surge, Revenue Stall
V.
The PSEi 30 Net Income Story
VA. Earnings Breakdown: SMC’s Income Dominance, Accounting
Prestidigitation?
VB. SMC’s Financial Engineering? Escalating Systemic Risk
VI.
Debt and Liquidity: The Structural Bind
VIA. Mounting Liquidity Stress: Soaring Debt and The Deepening
Leverage Trap
VIB. Transparency Concerns, Desperate Calls for Easing, Cash
Reserves Under Pressure
VII. Conclusion: The Illusion of Resilience: As the Liquidity Tide Recedes, Who’s Swimming Naked?
____
Q2–1H Debt-Fueled PSEi 30 Performance Disconnects from GDP—What Could Go Wrong
Beneath headline growth lies a fragile mix of policy stimulus, rising leverage, and mounting stagnation—masking systemic fragility.
I. PSEi 30 Q2 2025: The Illusion of Resilience
Nota Bene:
PSEi 30 data contains redundancies, as consolidated reporting includes both parent firms and their subsidiaries.
Chart Notes:
1A: Based on same year index members; may include revisions to past data
1B: Historical comparison; includes only members present during the end of each respective period; based on unaudited releases
IA. Q2 GDP at 5.5%: Headline Growth vs. Corporate Stagnation
Q2 GDP at 5.5%?
On paper, that should have translated into strong corporate earnings—especially when juxtaposed with the financial pulse of the PSEi 30.
Yet that headline growth masks a deeper dissonance: These firms, positioned as frontline beneficiaries of BSP’s easing cycle and historic deficit spending, should have reflected the policy tailwinds.

Figure 1
Instead, the disconnect is glaring: while nominal GDP surged 7.2% in Q2 and 7.4% in H1, aggregate revenues of the PSEi 30 contracted by 0.3% in Q2 and barely budged at 1.7% for the first half. (Figure 1, upper graph)
IB. Structural Downtrend and Policy Transmission Breakdown
More troubling, this isn’t a one-off anomaly.
2025’s performance merely extends a structural downtrend that peaked in 2022—raising uncomfortable questions about transmission mechanisms, institutional fragility, and the real beneficiaries of expansionary policy.
Consider this: Universal bank credit hit a historic high in June 2025, with 12.63% growth, the fastest pace since 2022. Yet PSEi 30 revenue growth in H1 limped to just +1.7%. The juxtaposition is telling. (Figure 1, lower window)
Rather than fueling productive consumption or corporate expansion, credit appears channeled into asset churn and balance sheet patchwork—rolling debt, patching liquidity gaps, gaming duration mismatches. It’s a kinetic mirage, where velocity substitutes for vitality—hallmarks of overleveraging and diminishing returns.
The very tools meant to stimulate growth now signal policy transmission failure, where liquidity flows but impact stalls.
IC. Real Value Output in Decline, Political Optics and GDP Credibility
Worst still, when adjusted using the same deflators
applied to GDP, the PSEi 30’s real output doesn’t just stagnate—it slips into
quasi-recession. Both Q2 and H1 figures turn negative, ≈ -2% and -.4%,
exposing a structural rot beneath the nominal gloss. (Note 1)

Figure 2
And this isn’t a statistical fluke.
A full third of the index—10 out of 30 firms—posted revenue contractions, led by holding firms San Miguel, Alliance Global, and Aboitiz Equity. These aren’t fringe players—they’re positional market leaders. (Figure 2, upper table)
As a side note, AGI’s revenue decline was partly driven by the deconsolidation of Golden Arches Development Corp, following its reclassification as an associate in March 2025 (Note 2)
The gap is too wide, too persistent a trend, to be dismissed as cyclical noise.
Was the PSEi 30 shortfall simply papered over by government spending, with a boost from external trade?
Or was GDP itself inflated for political ends—to justify lower interest rates, defend the proposed Php 6.793 trillion 2026 budget (+7.4% YoY), and tighten the administration’s grip on power?
Most likely, the truth lies in some combination of both.
ID. Meralco’s Electricity Consumption Story: A Broken Proxy
That’s not all.
Meralco’s electricity sales volume contracted −0.33% YoY in Q2, dragging H1 growth down to a mere +0.51%. This isn’t just a soft patch—it’s historic:
- First Q2 contraction since Q1 2021,
- First negative H1 since 2020, —both periods marked by pandemic-induced recession.
More tellingly, Meralco’s quarterly GWh chart—once a reliable proxy for real GDP—has broken correlation. The divergence, which began in Q1 2024, has now widened into a chasm. (Figure 2, lower chart)
To compound this, peso electricity peso sales shrank by 1.74% in Q2, and Meralco’s topline declines—both in pesos and GWh—dovetailed with the 8% sales slump in aircon market leader Concepcion Industries Corporation, as we discussed in an earlier post. (see references)
When electricity consumption decouples from GDP, it raises uncomfortable questions:
- Is real consumption being overstated?
- Are headline figures engineered to justify policy optics—lower rates, ballooning budgets, and political consolidation?
The numbers suggest more than statistical noise. They hint at a manufactured narrative, where growth is declared, but not felt.
II. Real Estate: The Recovery That Wasn’t
IIA. Overton Window vs. Market Reality
There’s more. The public has recently been bombarded with official-consensus messaging about a supposed real estate ‘recovery.’
The BSP even revised its property benchmark to show consistently rising prices—curiously, at a time of record vacancies. (see references) By that logic, the laws of supply and demand no longer apply.
To reinforce the recovery echo chamber, authorities published modest Q2 and H1 NGDP/RGDP figures of 5.7% and 5.4%, respectively.
IIB. Property Developer Falling Revenues, Debt Surge and Liquidity Strain

Figure 3
Yet the hard numbers tell another story: stagnation gripped the top 5 publicly listed property developers—SMPH, ALI, MEG, RLC, and VLL—whose aggregate Q2 revenues grew by a paltry 1.23% YoY. (Figure 3 topmost image)
Adjusted for GDP deflators, that’s a real contraction. In effect, published rent and real estate sales may be teetering on the brink of recession.
The relevance is clear: these five developers accounted for nearly 30% of the sector’s Q2 GDP, meaning their results are a critical proxy for actual conditions—assuming their disclosures are accurate.
Yet, if there’s one metric that’s consistently rising, it’s debt.
Published liabilities surged 5.5% or Php 53.924 billion, reaching a record Php 1.032 trillion in Q2. Meanwhile, cash reserves plunged to their lowest level since 2019. (Figure 3, middle chart)
And yet, net income rose 11.15% to Php 35.4 billion—a figure that invites scrutiny, given flat revenues, rising leverage, and tightening liquidity.
In reality, developers appear forced to draw down cash to sustain operations and patch liquidity gaps, a fragile foundation to prop up the GDP consensus.
IIC. Downstream Demand Weakness: Home Improvement & Construction Retail
Worse, the sector’s downstream segment remains mired in doldrums.
Sales of publicly listed market leaders in home improvement and construction supplies—Wilcon and AllHome—fell -1.95% and -22.1% in Q2, respectively. Both chains have been struggling since Q2 2023, but the latest data are striking: despite no store expansion, AllHome reported a -28% collapse in same-store sales, while Wilcon’s growth lagged despite opening new outlets in 2024–2025, underscoring weak organic demand and the record vacancies. (Figure 3, lowest visual)
Strip away the official spin, and the underlying pattern emerges: insufficient revenues, surging debt, and shrinking liquidity. Overlay this with record-high employment statistics, historic credit expansion and fiscal stimulus—what happens when these falters?
Consumers are already struggling to sustain retail and property demand. Yet, embracing the ‘build-and-they-will-come’ dogma, developers continue to expand supply, worsening the malinvestment cycle: supply gluts, strained revenues, debt build-up, and thinning cash buffers—a crucible for a future real estate debt crisis.
III. Retail and Food Services: Mixed Signals
IIIA. Retail: Consumer Strain Amid Policy Sweet Spot
It’s not all bad news for consumers.
Some segments gained traction from the “sweet spot” of easy money and fiscal stimulus—manifested in record bank credit and near all-time high employment rates.

Figure 4
The most notable beneficiaries were non-construction retail chains, where expanded selling space (malls, outlets, stores) lifted revenues. The combined sales of the six listed majors—SM, Puregold, Robinsons Retail, Philippine Seven, SSI, and Metro Retail—rose 8.6% in Q2, their strongest showing since Q2 2023. (Figure 4, topmost graph)
Still, signals remain mixed. In Q2, retail NGDP slipped to its lowest level since Q1 2021, while real consumer GDP bounced to 5.5%, its highest since Q1 2023.
Company results reflected this divergence:
- SM: +8.9% YoY (best since Q4 2023)
- PGOLD: +12.3%
- RRHI: +5.9%
- SEVN: +8.6%
- SSI: −1.6%
- MRSGI: +6.6%
IIIB. Divergence Between Store Expansion and Organic Demand, Retail Growth vs. GDP Trends
Interestingly, while Philippine Seven [PSE: SEVN] continues to boost headline growth via new store openings, same-store sales have operated in negative territory from Q4 2024 to Q2 2025. This divergence reveals how money at the fringes conceals internal vulnerabilities—weakening demand paired with oversupply. Once the benefit of new outlets erodes, excess capacity will magnify sales pressure, likely translating into eventual losses. (Figure 4, middle pane)
Even as listed non-construction retail firms outpaced retail NGDP (6.8%) and RGDP (6.15%), their performance only partially resonates with the real GDP dynamic.
Yet, the embedded trend across retail sales, consumer GDP, and retail NGDP remains conspicuously downward.
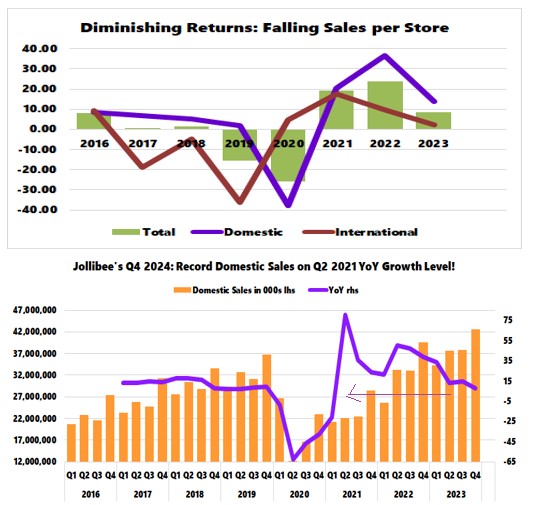
IIIC. Food Services: Jollibee’s Dominance and Sector’s Growth Deceleration
The food service industry echoes this entropy. Jollibee’s domestic sales grew 10.13% in Q2, pulling aggregate revenue growth of the four listed food chains—JFC, PIZZA, MAXS, FRUIT—to 9.6%, still below the 10.7% NGDP and 8.34% RGDP for the sector. The growth trajectory, led by JFC, continues to decelerate. (Figure 4, lowest diagram)
Notably, JFC accounted for 86% of aggregate listed food service sales, yet only 54% of Q2 Food Services GDP—a testament to its PACMAN strategy of horizontal expansion—an approach I first described in 2019—enabled by easy-money leverage in its pursuit of market dominance (see references)
Unfortunately, visibility on the sector is now diminished. Since AGI reclassified Golden Arches (McDonald’s Philippines) as a non-core segment, its performance is no longer disclosed. For reference, McDonald’s sales plunged 11.5% in Q1 2025.
Losing this datapoint is regrettable, given McDonald’s is Jollibee’s closest competitor and a critical indicator of industry health.
IV. Banking Revenues and Income: A Stalling Engine
IVA. Banking Sector: Credit Surge, Revenue Stall
Finally, despite all-time high loan volumes, bank revenues slowed sharply in Q2—an unexpected deceleration given the credit surge. The top three PSEi 30 banks—BDO, BPI, and MBT—posted a modest 7.02% revenue increase, dragging 1H growth down to 7.99%. For context, Q1 2025 revenues rose by 9%, while Q2 2024 saw a robust 21.8% jump. Full-year 2024 growth stood at 20.5%, making Q2 2025’s performance less than half of the prior year’s pace.
We dissected the worsening conditions of the banking sector in depth last week (see reference section)
V. The PSEi 30 Net Income Story
VA. Earnings Breakdown: SMC’s Income Dominance, Accounting Prestidigitation?
For the PSEi 30, if revenue stagnation already stands
out, net income tells a similar story.

Figure 5
Q2 2025 net income rose by 11.5% (Php 28.7 billion), pulling down 1H income growth to 13.8% (Php 68.6 billion). While Q2 gross net income was the highest since 2020, its marginal increase and subdued growth rates marked the second slowest since 2021. (Figure 5, upper chart)
The devil, of course, lies in the details.
The biggest contributor to the PSEi 30’s net income growth in Q2 and 1H 2025 was San Miguel Corp. Its net increase of Php 18.7 billion in Q2 and Php 53.19 billion in H1 accounted for a staggering 65.2% and 77.54% of the total PSEi 30 net income growth, respectively—despite comprising just 8.5% and 11.8% of the index’s gross net income. (Figure 5, lower table)
In effect, SMC was not merely a contributor but the primary engine behind the index’s earnings rebound.
Yet this dominance raises more questions than it answers.
Despite a sharp revenue slowdown and only marginal improvements in profit margins—still below pre-pandemic levels—SMC reported a substantial jump in cash holdings and a deceleration in debt accumulation. But this apparent financial strength stems not from operational resilience, but from non-core gains: fair value revaluations, FX translation effects, and dividends from associates.
The result is a balance sheet that appears healthier than it is, with cash levels inflated by accounting maneuvers rather than organic surplus.
VB. SMC’s Financial Engineering? Escalating Systemic Risk
Beneath the surface, SMC’s debt dynamics resemble quasi-Ponzi finance—borrowing Php 681 billion to repay Php 727 billion in 1H 2025, while plugging the gap with preferred share issuance and asset monetization. The latter includes the deconsolidation and valuation uplift of its residual stakes in the Ilijan power facility and Excellent Energy Resources Inc. (EERI), as well as the $3.3 billion LNG deal with Meralco and AboitizPower in Batangas. Though framed as strategic partnerships, these transactions involved asset transfers that contributed heavily to the surge in reported profits.
The simulacrum of deleveraging—from Php 1.56 trillion in Q4 2024 to Php 1.506 trillion in Q2/1H 2025—appears to be a product of financial engineering, not structural improvement. This disconnect between reported profitability and underlying liquidity mechanics raises concerns about transparency and sustainability.
In a market where banks, corporates, and individuals hold significant exposure to SMC debt (estimated at 4.3% of June 2025’s total financial resources), the company’s accounting-driven cash buildup may signal escalating systemic fragility—a risk that the recent equity selloff seems to be pricing in ahead of the curve.
Stripped of SMC’s potentially inflated income, Q2 and H1 net income for the PSEi 30 would rank as the second-lowest and lowest since 2021, respectively—underscoring the fragility behind the headline performance.
At the same time, and with curious timing, SMC announced its intent to undertake large-scale flood control across Metro Manila and Laguna—"at no cost to the government or the Filipino people". Whether this reflects a genuine civic gesture or a strategic bid to accumulate political capital remains unclear. But the optics are unmistakable: as SMC’s earnings distort the index’s headline strength, it simultaneously positions itself as a public benefactor.
Yet, is this narrative groundwork for a future bailout, or a preemptive reframing of corporate rescue as national service?
VI. Debt and Liquidity: The Structural Bind
VIA. Mounting Liquidity Stress: Soaring Debt and The Deepening Leverage Trap
Finally, let us move on to the PSEi 30’s liquidity metrics: debt and cash.
If there’s one structurally entrenched dynamic in the
PSEi 30, it’s borrowing.

Figure 6
Published short- and long-term debt of the non-financial PSEi 30 surged to an all-time high of Php 5.95 trillion in 1H 2025—up 7.66% year-on-year. (Figure 6, topmost chart)
The net increase of Php 423 billion amounted to 74.7% of the gross net income and a staggering 617% of the YoY net income increase.
Including the bills payable of the four PSEi 30 banks—Php 859.7 billion, excluding bonds—total leverage rises to Php 6.8 trillion—with net borrowing gains of Php 760.5 billion, overshadowing declared net income of Php 566.7 billion.
In short, the PSEi 30 borrowed Php 1.34 to generate every Php 1 in profit—assuming SMC’s profits are genuine.
And this borrowing binge wasn’t isolated. Among the 26 non-financial firms, 18 increased their debt in 1H 2025.
On average, debt now accounts for 27% of assets—or total liabilities plus equity.
SMC, once the poster child of corporate borrowing, ceded the title this period to Meralco, Ayala Corp, and Aboitiz Equity Ventures. (Figure 6, middle table)
Notably, MER and AEV’s borrowing spree coincides with their asset transfer deals with SMC. Whether this reflects strategic alignment or a quiet effort to absorb or ‘share’ SMC’s financial burden to deflect public scrutiny—such optics suggest a coordinated dance.
If true, good luck to them—financial kabuki always yields to economic gravity.
VIB. Transparency Concerns, Desperate Calls for Easing, Cash Reserves Under Pressure
The thing is, transparency remains a persistent concern, especially in periods of mounting financial stress or pre-crisis fragility.
First, there’s no assurance that published debt figures reflect full exposure. Some firms may be masking liabilities through other liabilities (leases, trade payables) or off-balance sheet arrangements.
Second, asset valuations underpinning declared balance sheets may be unreliable. Accounting ratios offer little comfort when market liquidity evaporates—see the 2023 U.S. bank crisis or China’s ongoing property implosion.
Despite historic borrowing and declared profits, PSEi 30 cash reserves barely budged—up just 0.96% YoY, with a net increase of Php 14.07 billion following two years of retrenchment. Cash levels have been on a steady decline since their 2020 peak. We suspect that recent upticks in cash are not in spite of borrowing, but because of it.
This growing debt-income-revenue mismatch explains the establishment’s increasingly desperate calls for “MOAR easing” and declarations of a real estate “recovery.”
VII. Conclusion: The Illusion of Resilience: As the Liquidity Tide Recedes, Who’s Swimming Naked?
The PSEi 30’s revenue stagnation belies the optics of headline GDP growth. Even in the supposed “sweet spot”—BSP easing, FX soft-peg subsidies, and record stimulus—consumer strain cuts across sectors.
Stimulus may persist, but its marginal impact is fading—manifesting the law of diminishing returns. The disconnect between policy effort and real economy traction is widening.
Q2 and H1 income growth seem to increasingly reflect on balance sheet theatrics driven more by financial engineering and accounting acrobatics than by operational reality.
When earnings are staged rather than earned, the gap between corporate performance and macro reality doesn’t just widen—it exposes a deepening structural mismatch.
Deepening leverage also anchors the PSEi 30’s fundamentals. On both the demand and supply sides, debt props up activity while cash thins. The same fragility echoes through the banking system and money supply mechanics.
This is not resilience—it’s choreography. And when liquidity recedes, the performance ends.
As Buffett warned: "when the liquidity tide goes out, we’ll see who’s been swimming naked" We might be hosting a nudist festival.
___
Notes:
Note 1 While GDP measures value-added and corporate revenues reflect gross turnover, applying the same deflators provides a reasonable proxy for real comparison.
Note 2: Alliance Global 17 Q August 18, 2025: Effective March 17, 2025, GADC was deconsolidated and ceased to be a business segment as it becomes an associate from that date, yet the Group’s ownership interest over GADC has not changed p.2
References
Prudent Investor Newsletter, Q1 2025 PSEi 30 Performance: Deepening Debt-Driven Gains Amid Slowing Economic Momentum, June 01, 2025 (Substack)
Prudent Investor Newsletter, Concepcion Industries Cools Off—And So Might GDP and the PLUS-Bound PSEi 30 (or Not?) July 28, 2025
Prudent Investor Newsletter, The Confidence Illusion: BSP’s Property Index Statistical Playbook to Reflate Property Bubble and Conceal Financial Fragility, July 13, 2025(Substack)
Prudent Investor Newsletter, Jollibee’s Fantastic Paradigm Shift: From Consumer Value to Aggressive Debt-Financed Pacman Strategy March 3, 2019
Prudent Investor
Newsletter, Philippine
Banks: June’s Financial Losses and Liquidity Strains Expose Late-Cycle
Fragility, August 17, 2025 (Substack)