Showing posts with label japan's lost decade. Show all posts

Sunday, November 03, 2013

Phisix: The Myth and Realities of a Yearend Rally

Once any attempt is made by the central bankers to slow down or stop the monetary expansion in the face of worsening price inflation, the entire house of cards begins to crumble. The boom turns into the bust, as investments undertaken and jobs created are discovered to be the misdirected outcome of money creation and the unsustainable patterns of demand and employments that could last only for as long as the inflationary spiral was kept going. Professor Richard M. Ebeling

Will a Yearend Rally Take Off?

November and December has largely been seen by the consensus as months favoring stock market investments. Some have classified them as Year-end rallies[1] or Christmas or even Santa Claus (late December) rallies[2]

Such rallies have been in anticipation of increased liquidity (from bonuses and gifts), also from a rebalancing of portfolios (partly from tax purposes) and or from mere optimism for the coming year—the January effect[3].
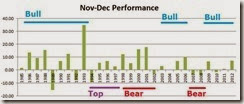
clip_image002

For the Phisix, since 1985, the November-December window reveals that the Phisix has risen 75% of the time during the past 28 years.

But digging through the numbers divulges some interesting insights.

One, the best returns have been during tops (1986*, 1988*, 1993 and 2006)

*1987 and 1989 I consider as quasi bear markets or countercyclical bear markets within a structural bull market. Both bear markets had been political incited (1987 and 1989 coup), posted significant losses of over 50%— 1987 (-53%) and 1989 (-63%)—and both lasted less than a year, specifically 5 months and 11 months respectively[4].

Two, the biggest returns can also be seen during sharp bear market rallies (1987, 1998**, 2000** and 2001**)

**1998, 2000 and 2001 signified as ephemeral countercyclical bull markets within a structural bear market.

Three, since the new millennium, the seasonality effects from the November-December window have greatly been subdued.

Has deepening connectivity via the cyberspace invoked a crowded trade effect (diminished arbitrage opportunities from most participants expecting everyone to do the same thing)?

Incredibly, the massive run by the Phisix from the nadir of the late 2008 of about 1,700 until the fresh historic highs in May of 2013 at 7,400 for a 335% return for 5 years+ period, has only generated November-December returns of +6.65% for 2009, -1.58% for 2010, +.88% 2011 and last year’s 7.16%.

This means that while stocks may rise over the said period, there is no guarantee, in contrast to popular expectations, that returns for the yearend season to be significant to offset underlying risk factors.

Of course qualitative dynamics of the past hardly resemble today’s conditions for us to rely on empirical data to accurately project future conditions. Said differently, this means that while stocks rose 75% of the time for the past 28 years, the largely downplayed negative returns of 25% over the same period, may also be an outcome.

The unfolding present conditions will determine the direction of price trends rather than from seasonal or historical variables.

The Nikkei-Phisix/SET Pattern

Yet the bullish consensus has been said to view the current consolidation phase as a replica of 2011 in expectations of a major leg to the upside.

Pattern seeking to justify one’s belief is easy.

clip_image003

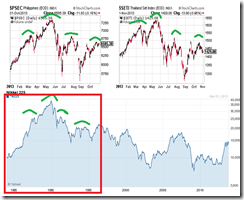
The year to date chart of the Phisix (left upper window) and Thailand’s SET (right upper widow) looks as they have been behaving in proximate symmetry.

Both have earnestly been attempting to untangle themselves from the twin May-June and August bear market strikes.

Curiously both charts, the year-to-date Phisix and the SETI charts appear to closely approximate what seems as a bigger paradigm, Japan’s major equity bellwether the Nikkei 225 from 1985-1995 (red square).

Yet the succeeding events from the Nikkei’s incipient downfall had been an unpleasant one. In the wake of the 1990 crash where the Nikkei fell by 60% from the pinnacle of 38,916, after a long period of consolidation (1993-1997), the major Japanese equity bellwether plumbed to new depths. The Japan’s lost decade has been underscored by the Nikkei’s 80% loss over a 13 year period.

Since the all-time low of 7,831.42 in March 2003, the Nikkei has been rangebound from 8k to 18k. Even with Abenomics in place, the Nikkei at the 14,000+ levels has still been in a considerable distance from the June 2007 high of 18,138.36.

If the Nikkei’s pattern evolves similarly on the Philippines and on Thailand, then this would hardly be “bullish”.

Will a firming US Dollar be a Spoiler?

As I have been repeatedly saying, financial markets of emerging markets (which includes emerging Asia) will generally depend on the conditions of the bond vigilantes 

Rallying US Treasuries (declining yields) appear to have hit a wall. The US dollar has recently strengthened amidst the manic episode in the US equity markets.

clip_image005

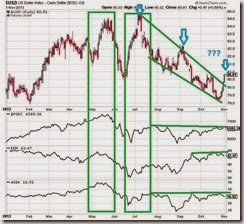
In May, the sharply strengthening US dollar peaked along with the Phjsix (PSEC), Emerging Markets (EEM) and the FTSE ASEAN (ASEA) bellwethers. The rally in the US dollar coincided with an unexpected surge in yields of US treasuries.

It was also in May when the financial markets began to speculate on the impact of both Abenomics and more significantly Bernanke’s Taper talk. The financial markets came to believe that even a minor reduction of US liquidity would have an adverse impact on financial markets and the economy.

By June, global stock markets fell hard. Many emerging markets had been pushed to bear market levels. China suffered its first bout of liquidity squeeze[5]. While the US dollar rallied strongly against emerging markets, the US dollar fell against developed market contemporaries.

The sharp second spike in the US dollar (second green rectangle) in response to the continuing stress in the financial markets, corresponded with what seemed as an orchestrated communications campaign launched by central bank officials in pushing back the market’s concern over the Taper[6].

As equity markets of emerging markets partially recovered on assurances from central bankers, which has signalled a return of the quasi-Risk ON environment, the US dollar failed to sustain its advance and consequently declined dramatically.

However by August the rally in the equity markets of emerging markets hit a wall. Renewed concerns over the taper, uncertainty over Ben Bernanke’s replacement and the Syrian standoff emerging market sent stocks reeling[7]. Such uncertainties propelled the US dollar index higher for the third time.

But again this wouldn’t last as central bank officials come to the “rescue”.

The FED surprised the markets heavily expecting a tapering with an UN-Taper announcement[8]. Stocks in developed economies run amuck and went into a blowoff phase. Debt ceiling deal and Ms. Janet Yellen’s anointment as Bernanke’s replacement further fired up the melt-UP mode[9]. This US stock market bidding frenzy continues until today.

Some of this optimism has diffused into select emerging markets. The US dollar tumbled once again.

The wild volatility swings prompted by action-reaction feedback mechanism between, on one side, the central bankers and political authorities, and on the other, the financial markets continues.

Amidst a continuing meltup mode by US equities, the oversold US dollar staged a massive comeback this week. This has been accompanied by a renewed selloff in US treasuries as well as in commodities.

The question is will US treasury selloff and the US dollar rally be sustained? If so what could be the implications?

How the US dollar may affect the US-ASEAN equity correlation?

clip_image006

Changes in the direction of the US dollar index have demonstrated some correlation with the performance of US stocks relative to ASEAN contemporaries.

With a 2-3 months lag, the rise of the US dollar (February to June) eventually coincided with outperformance of the S&P 500 over the Phisix (SPX:PSEC; window below USD index), S&P 500 over Thailand’s SET (SPX: SETI) and S&P 500 over Indonesia’s IDDOW (SPX: IDDOW; lowest pane).

When the US dollar peaked in July and turned lower until last week, the SPX’s outclassing of the ASEAN stocks seems to have also culminated (blue line).

If such trend should continue, then we can expect the following

-ASEAN stocks can go higher vis-à-vis the US (but count me as doubtful)

-Even if ASEAN equities continue to consolidate or move sideways, ASEAN outperformance could mean a coming correction in US stocks.

-Since the above represents a ratio between two indices, even if both the S&P and ASEAN bellwethers posted declines, for as long as the degree of contraction by ASEAN equities is smaller than the S&P the ratio will favor ASEAN. The charts indicated (S&P: ASEAN) will reveal a downside motion.

But I lean towards a coming US stock market correction.

I have been pointing out how market participants have frenetically bid up US stocks by indulging in record high net margin debt, wallowing in debt financed share buybacks[10] and splurging on massive leveraging on indirect speculative activities

This comes amidst declining rate of growth in terms of net income and earnings, as well as, manipulations of earnings guidance[11] in order to justify such a mania.

I have noted that PE ratio of US stocks as embodied by the small cap Russell 2000 has reached shocking 80+ levels.

I have also alluded to substantial cash raising activities by foreign investors and by many celebrity and market gurus in anticipation of a major pullback.

Even the world’s largest sovereign wealth fund, Norway’s Norges Bank Investment Management has joined this bandwagon and recently warned of an impending reversal or “correction” of stock markets[12].

On the other hand, retail investors have been piling in as US stocks goes vertical.

clip_image008

It’s also important to realize that when major US equity benchmarks move farthest from each other, the outcome has been significant retrenchments or bear markets.

The S&P (red) pulled away from the Dow Industrials (green) and the Russell 2000 (blue line) in the dotcom bubble days, the corollary had been a dotcom bust.

In 2007, the small cap Russell 2000 meaningfully surpassed the Dow Industrials (green) and S&P (red) by a mile. The patent discrepancies eventually paved way for a bear market which has been triggered by a housing bubble bust.

The same can be seen in 2011, where huge divergences (but over a short period) led to a significant correction.

Today such incongruities have not only been colossal but have also been critically extended as earlier discussed[13].

But what if the US dollar index continues to climb?

The most likely answer is that in 2-3 months after, we can expect another round of outperformance by US equities relative to ASEAN.

Again this may not necessarily mean rising markets. The S&P 500 fell along with ASEAN markets in August, but again the decline was lesser in scale relative to the ASEAN bourses which endured the second strike from the bears. The August selloff resulted to the zenith of the SPX:ASEAN ratio

This means that if the US dollar should rise further, then this extrapolates to bigger fragility for emerging markets and for ASEAN.

Indonesia Remains Vulnerable

ASEAN’s vulnerability can be seen from developments in Indonesia

clip_image010

The recent seemingly tranquil pseudo-risk ON period has hardly pacified Indonesia’s mercurial financial markets.

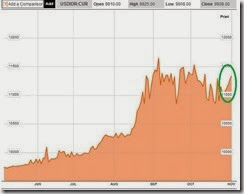
It has failed to dampen the elevated conditions of Indonesia’s currency, the rupiah.

In addition, “dramatically increased the cost of living” has prompted labor unions and workers to hold a nationwide strike to demand a FIFTY 50% increase in minimum wages.

In Jakarta, this comes on top of earlier minimum wage hike of 42% in less than a year[14]

Yesterday, a first batch of a dozen Indonesian governors agreed to increase minimum wages by an average of 19%. Later in the day, another batch announced higher minimum wages from anywhere between 10-45%[15].

So rising minimum wages will compound on the drag effects on Indonesia’s real economic growth.

And to think just a year back Indonesia has been a darling of credit rating agencies[16].

While Indonesia’s inflation woes has been blamed on the partial lifting of oil subsidies (subsidies I earlier noted accounts for 3% of the GDP[17]), Indonesia’s main predicament has been due to unwieldy government spending, interventionist populist government (as shown by minimum wages) and massive credit expansion both to the private and government as measured by Indonesia’s external debt

clip_image012

These has prompted for trade deficits and a blowout in current account deficits[18]

In short, the Indonesian economy reveals of the priority to spend financed by debt rather than to produce and generate savings and increase productivity[19].

Indonesia’s foreign currency stockpile has been eroded by 23.2% to USD 95.675 million as of September 2013 from a high of USD 124.637 in August of 2011 mainly from defending the rupiah.

This compares to the USD 83.029 million for the Philippines as of September which also appears to be in a downshifting trend. From the record high in January 2013 Philippine foreign currency reserves has declined by 3.2% as of September.

The above only exhibits how the rupiah appears highly vulnerable to a crisis from a sustained surge in the US dollar and or extended selloffs in US treasuries.

This also shows how the damage from the bond vigilantes has percolated into the real economy.

And the recent rebound of Indonesia’s stock market appears to have ignored all these risks.

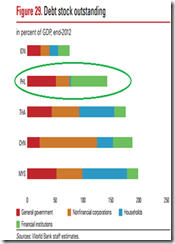
Curiously, Indonesia has a low government debt to GDP level (23.1% 2012) even lower than the Philippines at (40.1% 2012)
clip_image013
And it has not just been government debt but likewise overall debt standings which I previously shown where Indonesia’s debt exposure has been the lowest among ASEAN peers and China.

clip_image014
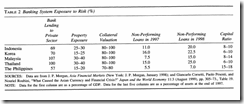
As a reminder, relative low debt levels by the Philippines or even by Indonesia didn’t spare these countries from a regional contagion when the Asian crisis hit in 1997[20].

The point of the above is that vulnerabilities to a debt crisis may emanate from different soft spots in the economy. This means relative debt levels hardly represents an accurate measure for measuring risks without understanding the interconnectedness and interdependencies of different sectors of an economy.

Yet it isn’t relative debt levels but rather confidence levels by creditors on the ability or willingness of a country to honor their liabilities.

External factors like a surge in the US dollar or rampaging bond vigilantes may expose such weakness.

Bottom line: ASEAN stocks and or the Phisix may rise mainly out of the desire to stretch for yields, but substantial risks remain. Potential tinderboxes as China (as explained last week), Japan, the US, Europe, India or even ASEAN would make global stock markets highly vulnerable to black swans especially amidst the unsettled bond vigilantes.


[1] The Free Dictionary Year-End Rally

[2] Investopedia.com Santa Claus Rally

[3] The Free Dictionary January Effect


[14] Wall Street Journal Indonesians Strike for Higher Wages October 31, 2013

[15] Wall Street Journal Indonesia Governors Boost Minimum Wage, November 1, 2013


[18] Tradingeconomics.com INDONESIA CURRENT ACCOUNT


Saturday, October 19, 2013

China Bubble Indicator: Chinese Buying of High Profile US Properties

While I often refer to the skyscraper indicator as one important gauge to appraise the whereabouts or the stages of the bubble cycle, there seems another potential bubble indicator: foreign buying of US high profile properties.

Recently a Chinese firm reportedly bought JP Morgan’s 1 Chase Manhattan Plaza

From the Bloomberg:
JPMorgan Chase & Co. (JPM) has agreed to sell 1 Chase Manhattan Plaza, the tower built by David Rockefeller, to Fosun International Ltd., the investment arm of China’s biggest closely held industrial group, for $725 million.

Fosun, which invests in properties, pharmaceuticals and steel, is buying the 60-story, 2.2 million square-foot, lower Manhattan tower, according to a statement it filed to Hong Kong’s stock exchange.

China’s developers and companies are expanding in overseas property markets as the government maintains curbs on housing at home to cool prices. Greenland Holding Group Co., a Shanghai-based, state-owned developer, this month agreed to buy a 70 percent stake in a residential and commercial real estate project in Brooklyn.
We have seen this phenomenon before, particularly, during the "Japan Inc" bubble era of the late 1980s. 


This 1996 article on Japan's US property acquisition from the Chicago Tribune resonates on today’s buying spree of US properties by the Chinese. [bold mine]
No property epitomizes failed Japanese investment in U.S. real estate more than New York landmark Rockefeller Center.

Mitsubishi Estate Co. paid the Rockefeller family $1.4 billion for an 80 percent stake in the complex in 1989 and 1990. By early 1995, Mitsubishi had lost more than $600 million on its investment and put the property under bankruptcy protection. Late last year, it decided to hand the property over to its lenders.

Aoki Corp. of Japan, which bought the Westin Hotels and Resorts chain in 1988, hasn't fared much better. In 1988, it paid United Air Lines' parent Allegis Corp. $1.35 billion for the company. It ended up selling the chain's North American and European operations and some other assets to two U.S. investment firms for $561 million in December.

Japanese real estate developer Minoru Isutani's purchase of the Pebble Beach golf resort is another famous case. In 1990, he bought the California championship golf course for $841 million. Isutani sold the property about 18 months later to two Japanese companies at a $340 million loss.
Again as one would note that during the peak of Japan’s bubble 1988-1990, Japanese investors went into a shopping binge similar to Chinese investors today. And 'Rockefeller' properties seem like a coincidence or has been a prominent feature of extravagant transactions.

More from a 1992 LA Times article (bold mine) 
The drying up of Japanese real estate money in California was even more dramatic. Total investment tumbled 83% to $976 million, a trend the study attributes to the state's steep recession. For the first time in four years, Hawaii attracted more Japanese real estate money than California. Los Angeles was eclipsed by New York and Honolulu as the cities of choice for Japanese real estate funds.

Orange County, once one of the top 10 locations in the country, fell 95% to $32 million. Los Angeles dropped 65% to $590 million as a city of choice for Japanese funds. Japanese real estate investment fell 87% to $138 million in San Diego, and 74% in San Francisco to $127 million.

The results signal an end to a shopping spree that began in 1985 when cheap capital, the yen's exceptionally strong buying power, and loose lending standards by Japanese banks prompted scores of Japanese to pay record prices for some of the most famous office buildings and hotels in California, New York and Hawaii.
Today we have a strong Chinese yuan and massive expansion of credit in China's formal and informal banking system that has been fueling a domestic property bubble.

Yet paying for “record prices for some of the most famous office buildings and hotels” in the US seems like a variant of the skyscraper curse. Instead of the building of grandeur projects to showcase overconfidence, foreigners buy signature edifices.

Again the sale of JPM’s 1 Chase Manhattan to a Chinese investor could signify a manifestation of such symptoms.

And paying for “record prices for some of the most famous office buildings and hotels” in the US, reminiscent of the 1980s, has been a du jour dynamic or trend, not limited to 1 Chase Manhattan.

From the New York Times last June [bold mine]
And yet in recent weeks, several big deals in New York City have set real estate circles abuzz. Zhang Xin, a Chinese business magnate and chief executive of the largest commercial real estate developer in Beijing, joined forces with the Safra family of Brazil to buy a large piece of the General Motors Building in Midtown. Dalian Wanda Group, a big Chinese developer, said it intended to build a luxury hotel in Manhattan. (Wanda is also planning to build a hotel in London.)…

For the moment, the Chinese government is encouraging the investments and even helping to finance them. The state-owned Bank of China has become the largest foreign lender in commercial real estate deals in the United States, replacing big European banks. Beijing is eager to diversify its investments…

The Chinese aren’t limiting themselves to megadeals. Some purchases have been relatively small by the standards of commercial real estate. Ms. Zhang, who is the chief executive of SOHO China and one of the richest women in the world, paid about $600 million in 2011 for a 49 percent stake in the Park Avenue Plaza, a Midtown Manhattan skyscraper. That same year, the real estate arm of the HNA Group, a Chinese airline company, saved an office building at 1180 Sixth Avenue from foreclosure for $265 million. HNA also bought the boutique Cassa Hotel in Times Square.

Chinese investors or firms have also bought large hotels in California, including the Sheraton Universal in Universal City; the Crowne Plaza in Burlingame, near the San Francisco airport; and the Hilton Ontario in Ontario. They have also purchased a riverfront parcel in Toledo, Ohio, and, earlier this year, an office building in Morristown, N.J.

Chinese firms and investors are also betting that the potential returns in American commercial property markets will be higher than in other areas of the world. The market for office, industrial and retail property appears to have bottomed out. Office vacancy rates have fallen and rent prices have stabilized amid signs of economic improvement. And while competition is heating up — three Manhattan office buildings have sold for more than $1 billion so far this year — many of the big bidders and lenders from Europe have pulled back as their home economies struggle.
So we see China’s homegrown bubbles spilling over in the form of diversification through increasing exposure on US properties. And these manic buying activities has been partly bankrolled by China’s state-owned bank. 

Finally, the Chinese property buying spree appears to be contributing to the Fed inspired reflation of the US property bubble.

A case of Déjà vu?
 
Yet there seems another angle from which the JPM property deal may have been made.

Since JP Morgan’s 1 Chase Manhattan Plaza has one of the “world’s largest bank vault” which houses the company’s gold holdings. This could be related to the Chinese government’s attempt to secure gold vaults worldwide.

The Zero Hedge speculates (bold original)
So, what the real news of today is not that JPM is selling its gold vault, we knew that two months ago, or that it is outright looking to exit the physical commodities business, that too was preannounced. What is extremely notable is that in one very quiet transaction, China just acquired the building that houses the world's largest gold vault.

Why? We don't know. We do know that China's gross gold imports from Hong Kong alone have amounted to over 2000 tons in the past two years. This excludes imports from other sources, and certainly internal gold mining and production.


One guess: China has decided it has its fill of domestically held gold and is starting to acquire gold warehouses in the banking capitals of the world.

For now the reason why is unclear but we are confident the answer will present itself shortly.
While the gold aspect has been interesting, the Chinese buying of high profile US properties seems as increasing, deepening and worrying signs of bubbles that are about to mature or are likely to burst soon.

Monday, September 09, 2013

Ignoring the Risks of an Asian Crisis and the Bang Moment

The consensus has spoken, there will be no Asian crisis.

The common denominator of their defense: huge international currency reserves.

While I agree that rich foreign currency reserves may reduce the risks of a crisis, as previously pointed out, these reserves must not be treated as a “get out of jail” or free passes for more bubble policies.

Second, a common mistake by the consensus is to anchor on the past. Their general focus has been on the risks of a currency crisis. They have ignored the risks of other forms of crisis such as banking crisis or sovereign debt default.

The Foreign Exchange Reserve Myth

clip_image002

The above chart reveals of Japan’s foreign exchange reserves today and in 1990. During the pre-bubble era, Japan’s reserves jumped to $100 billion. Japan’s asset boom was even given a boom day buzzword called “Japan Inc”, where many ‘revisionist experts’ argued that Japan’s state capitalism would lead her to overtake the US[1]. Unfortunately these experts failed to see that artificial booms eventually unravel. The banking crisis of 1990s, an offshoot to the bursting bubble, put a kibosh on the phony Japan Inc. boom.

During the halcyon days, Japan’s external position as earlier noted seemed strong embellished by current account surpluses, enormous net international investment position[2], huge savings and low external debt. So who would have seen a bubble unless the theory of bubbles has been adequately comprehended?

By the time of the crisis, Japan’s forex reserves reached $80 billion (about current Philippine levels in nominal terms).

Fast forward today, as of August of 2013 Japan’s reserves have skyrocketed to US$1.254 trillion[3].

Here is Wikipedia description on Japan’s asset price bubbles of the 1980s[4], “The bubble episode has been characterized by rapid acceleration of asset prices, overheated economic activity as well as uncontrolled money supply and credit expansion”

Has huge forex reserves been a factor in preventing crisis? Again from Wikipedia
By August 1990, stock price has plummeted to half the peak by the time of fifth monetary tightening by Bank of Japan (also known as BOJ) The asset price began to fall by late 1991 and the asset price officially collapsed in the early 1992. Consequently, the bubble's subsequent collapse lasted for more than a decade with asset price plummeted resulting a huge accumulation of non-performing assets loan (NPL) and consequently difficulties to many financial institutions. Such Japanese asset price bubble contributed to what some refer to as the Lost Decade. 

clip_image004

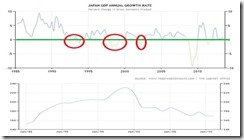
This is what the lost decade looks like. Japan’s asset bubbles crumbled when domestic credit shrank[5] (lower bottom). The lost decade also saw Japan’s statistical economy popping in and out of recessions.

Ironically today’s Japan’s aggressive monetary experiment called “Abenomics” where the monetary base has been targeted to double in two years represents one of the many similar attempts to resolve on the carryover or the lingering malaise from the 1990 bubble bust.

Nevertheless Japan’s massive decline in private sector credit has been replaced by a massive quadrillion yen[6] worth of government debt. This comes amidst a colossal stockpile of forex reserves. Will Japan’s giant reserves prevent a government debt default? We shall soon see.

So Japan’s experience shows that having massive forex reserves hardly serves as a guarantee against a crisis.

The Bang Moment

There’s more. The impression peddled by the mainstream is that a country with supposedly strong fundamentals would translate to immunization from a crisis.

It’s sad to see how people use backward looking data to forecasts on forward looking markets. Such type of mistaking forest for trees analysis can lead to big frustrations.

Now even the IMF seems to understand this (bold mine)[7]:
Policy makers should allow exchange rates to respond to changing fundamentals but may need to guard against risks of disorderly adjustment, including through intervention to smooth excessive volatility
I am not saying that I agree with the policy recommendation I am saying that IMF recognizes that current market prices have reflecting on changing fundamentals something which the mainstream refuses to acknowledge.

A more important factor is that crises tend to flow from periphery to the core.

Writing at the New York Times, MIT Professor and former IMF chief economist Simon Johnson[8] (bold mine)
In 1982, higher interest rates in the United States raised borrowing costs for Mexico and other emerging markets, contributing to the onset of what became known as the Latin American debt crisis and, for many of the affected, a “lost decade.” And in early 1997 the United States was also tightening monetary policy. Sometimes small changes in global funding can have big consequences on emerging markets.
Mr Johnson further describes on the contagion effects which is usually regional of nature.
Most financial crises begin with one weak country and then spread as investors re-evaluate prospects more broadly. The 1982 “developing country debt” crisis was brought on initially in Mexico, and the financial unraveling of Asia in 1997 started with Thailand. Greece was supposed to be an isolated case in early 2010, but then pressure followed on Ireland, Portugal, Spain and Italy.
While Mr. Johnson sees no imminent emerging crisis he warns the public not to dismiss or ignore them. 

The difference between then and today is that the bond market seems as saying that current dynamics hasn’t been sourced from the US only as the bond vigilantes has gone global.

Crises have always been an ex-post reckoning: we never know they exist until the bang moment.

Harvard’s dynamic duo of Professors Carmen Reinhart and Kenneth Rogoff describes the bang moment[9], (bold mine)
Perhaps more than anything else, failure to recognize the precariousness and fickleness of confidence – especially in cases in which large short-term debts need to be rolled over continuously – is the key factor that gives rise to the this-time-is-different syndrome.

Highly indebted governments, banks, or corporations can seem to be merrily rolling along for an extended period, when bang – confidence collapses, lenders disappear, and a crisis hits.

Economic theory tells us that it is precisely the fickle nature of confidence, including its dependence on the public's expectation of future events, which makes it so difficult to predict the timing of debt crises. High debt levels lead, in many mathematical economics models, to "multiple equilibria" in which the debt level might be sustained – or might not be.

Economists do not have a terribly good idea of what kinds of events shift confidence and of how to concretely assess confidence vulnerability. What one does see, again and again, in the history of financial crises is that when an accident is waiting to happen, it eventually does. When countries become too deeply indebted, they are headed for trouble. When debt-fueled asset price explosions seem too good to be true, they probably are. But the exact timing can be very difficult to guess, and a crisis that seems imminent can sometimes take years to ignite."
The bang moment has always been a product of an accretion of a series of events.

It is easy to dismiss the risks of a crisis, but when one sees crashing markets on multiple fronts and on a regional scale, we understand that such signs as reversal of confidences that have real economic consequences.

In other words, for me, recent market actions seem to have already set in motion real world dynamics that risks evolving into a full blown crisis

Take for instance signs of the real world impact from the recent market crash on Asia

From Wall Street Journal[10]: (bold mine)
Companies in exposed parts of Asia are facing a debt-repayment crunch as plunging local currencies make it more costly to repay foreign loans, a situation that is exacerbating stresses on the region's economies.

Asian companies took out sizable foreign loans in recent years as the U.S. Federal Reserve kept interest rates low and printed money. For companies in nations like India and Indonesia, rates on U.S.-denominated debt were more attractive than local borrowing costs…

The situation in India is notable. Indian companies have a combined $100 billion of unhedged foreign debt, according to data from Indian ratings firm Crisil, an affiliate of Standard & Poor's. A nearly 18.5% fall in the rupee since May has increased the cost of repaying those debts in local currency terms.
clip_image005

The article further notes that the huge ASEAN reserves seen in the context of current account and short term external debt or foreign exchange cover may not warrant the region’s perceived impregnability from a crisis. Bubbles in the ASEAN region has led to a sharp deterioration of reserve cover.

Another example: Indian banks have reportedly been taking a big hit, from the Financial Times[11]
Fears are rising for the health of India’s banking system as slowing economic growth and rapid currency depreciation threaten to worsen asset quality and reduce demand for bank credit from large industrial companies.

Non-performing and restructured loan levels in Asia’s third-largest economy have risen steadily over the past year to stand at about 9 per cent of assets and could reach 15.5 per cent over the next two years, according to Morgan Stanley.

A combination of weaker growth, waning business confidence and RBI measures to support the rupee will further dent asset quality, analysts say, in particular as some of the larger industrial companies struggle to repay loans.
So if market pressures in India will be sustained and if the banking system gets hit, then a no-crisis can easily morph into a crisis.

Bear Market Slows Philippine Loan Activities

The recent market crash have begun to impact on loan activities of the Philippine banking system

clip_image006
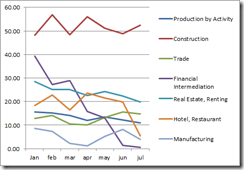
Loans on production activity has been on a decline since May, based on the year on year change per month—data from the BSP[12].

The biggest impact has been in the financial intermediation where growth seemed to have hit the wall. The slowdown in loan growth will impact the pace of statistical economic growth of the service sector.

Lending to the Hotel and restaurant sector fell dramatically.

Loans to the real estate renting and other businesses dropped below the 20% level. This will partly impact construction related activities in the statistical economy.

Loans to the trading sector and construction activity (perhaps public construction) has partly offset these declines.

If the July trend will be sustained then we will likely see a modest slowdown by the 3rd quarter. There are two months to go for the statistical data to be completed.

And if the July trend worsens, then statiscal growth likely post a bigger than expected slowdown.

The BSP reformatted their statistical treatment of domestic liquidity[13], nonetheless they report that the strong M3 growth is a manifestation of expanding credit to the domestic sector

Finally while government statistics tend to dismiss the risk of domestic price inflation I suspect that the current brouhaha over rice price inflation[14] could be signs of a rotation from domestic asset bubble to price inflation or increased risks of a price inflation given the recent decline of the Peso.

Bottom line: Be Vigilant and Cautious

It will be hasty and reckless to dismiss the risks of a crisis merely out of forex reserves grounds. 

Market selloff represents fundamental changes. They are not based on mere sentiment or irrationality.

We must take vigil of the continuity and the intensity of volatility in the domestic markets, the damages or ramifications from the recent market crash, and importantly, the policy responses that may exacerbate or reduce the odds of a crisis.

Since the common trait of many crises has been one of regional contagion, then observing the ASEAN markets based on the above parameters may provide clues if a crisis, or if a recovery, is coming.

Conditions are so fluid and fragile for one to take on substantial risks.


[3] Tradingeconomics.com JAPAN FOREIGN EXCHANGE RESERVES


[8] Simon Johnson The Next Emerging Market Crisis New York Times Blog September 4, 2013

[9] Carmen Reinhart and Kenneth Rogoff This Time is Different MAULDIN: The 'Bang!' Moment Is Here Businessinsider.com

[10] Wall Street Journal Plunging Currencies Crimp Asian Companies (bold mine)

[11] Financial Times, India crisis threatens big hit on banks September 4, 2013

[12] Bangko Sentral ng Pilipinas Bank Lending Sustains Growth in July September 6, 2013


[14] Philstar.com Rice prices up; kickback probe set September 5, 2013