Showing posts with label malinvestments. Show all posts

Sunday, November 19, 2023

A Terse Review of the Q3 and 9-Month Philippine PSEi 30 Financial Performance: Companies Turn Defensive


If past history was all there was to the game, the richest people would be librarians—Warren Buffett 


In this issue 


A Terse Review of the Q3 and 9-Month Philippine PSEi 30 Financial Performance: Companies Turn Defensive 

I.  Q3 and 9-Month PSEi 30 Financial Performance: Companies Go Defensive 

II. Financials Buoyed the Underperforming Revenue and Net Income Performance in Q3 

III. San Miguel, JGS and BDO Among the Top Revenue and Income Performers 


A Terse Review of Q3 and 9-Month PSEi 30 Financial Performance: Companies Turn Defensive 


Economic uncertainty has prompted most of the PSEi 30 members to turn defensive. 


I.  Q3 and 9-Month PSEi 30 Financial Performance: Companies Go Defensive 


Let us begin with the examination of the Q3 review of the PSEi 30 financial performance with this note. 


Or, for clarity purposes, let me categorize the following charts. 


A1.  Consist of data covering the same PSEi 30 members during the stated period. 


A2. This chart represents the typical apples-to-oranges, which discounts the marginal changes in PSEi 30 members in a given timeframe. 


Figure/Table 1 


The table summarizes the net 9-month changes (A1) of specific categories of the PSEi 30 in the last four years.  


In the nine months of 2023, the marginal or net changes in all categories, namely, debt, revenues, income, and cash, were considerably lower than a year ago: All posted a contraction YoY in percentages. 


The gist: Many companies went into a defensive mode.   
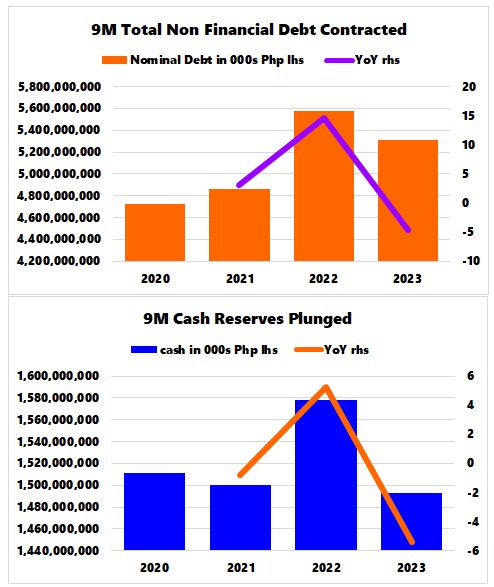
 

Figure 2 


Some pared down the use of debt to finance operations, resulting in its decreases.  However, that's after debt levels hit a high in 2022 (A2). (Figure 2, upper window)


Others tapped their existing cash stockpile, thereby the reduction in cash reserves.   Since peaking in 2020, cash reserve growth has eroded, which led to a contraction last year (A2).  (Figure 2, lower graph)


Many used a combination of the above. 


Inflation has been an instrumental force in the decrease in revenues and income, as well as the surge in debt in 2023.  


In the nine months of 2022 and 2023, the headline CPI averaged 5.1% and 6.6%, respectively.  

Figure 3 


Both revenues and income soared to a record in 2022 as inflation followed (A2). Though both categories topped the 2022 high in pesos, a slowdown in % growth characterized 2023. (Figure 3, top and middle graphs)


Revenue growth (33.3%) vastly exceeded the Nominal GDP (13.3%) in 2022, perhaps indicating a much higher inflation rate than published.   (Figure 3, lowest chart)


Nominal GDP of 10.7% exceeded revenue growth of 6.4% in 2023, suggesting the embellishment of the former.  


Total revenues of the elite 30 group signified 27.9% of the nominal GDP, which points to the degree of concentration of financial power held.  And that excludes other non-PSEi 30 firms, which understates their contribution. Nonetheless, it is a symptom of the BSP's implicit "trickle-down" policies that have been instrumental in forging an oligarchic-crony (neo-socialist "fascist") capitalist political-economic system.


In any case, that many companies took upon economic uncertainty to reduce debt should be good news.   However, the slump in cash levels indicated the emergence of liquidity strains. 


II. Financials Buoyed the Underperforming Revenue and Net Income Performance in Q3 


Figure/Table 4 


Let us dissect the PSEi 30's performance by sector. 


In the 9 months of 2023 (9M), the industrials registered the highest % increase in debt, but holding firms (which included their subsidiaries) had the highest peso increase.  


The property sector posted the highest % gains in revenues and in net income.   


However, the property sector used its liquid reserves to fund operations, resulting in the most % decline in cash.   


The slowdown in Q3 2023 weighed on revenues and net income growth.  


Though 9-month revenues posted a 9.08% growth, it was pulled lower by the 4.03% growth in Q3.  Thanks to the outperformance of the Financials, which cushioned the general stagnation.  


Q3 revenues and income contributed 34.03% and 32.84% to the 9M output, respectively, which revealed that Q3 activities had more impact on revenues than income. 


Nota Bene: This analysis reports on the disclosures, the accuracy of which is beyond our jurisdiction.   


To this end, all these exposed the weakness of the corporate world in the Q3 GDP, which reinforces the expanded role of deficit spending in Q3 GDP. 


Bluntly put, the 5.9% Q3 GDP was a statistical mirage. 


III. San Miguel, JGS and BDO Among the Top Revenue and Income Performers 


Figure/Table 5 


Finally, we examine the individual performance of the incumbent PSEi 30 members. 


First, 13 of the 27 non-financial firms trimmed their debt levels.  


While power firms ACEN and Meralco posted the highest % increase, SMC was singlehandedly the biggest borrower, with 72% of the Php 213 billion net increase.  


JGS logged in the highest net income growth in % and pesos.  In pesos, SMC and SM followed.  


With aggressive lending and investing, the three banks (BDO, BPI and MBT) clocked in the fastest revenue growth, but SM and BDO had the most increases in pesos. 


Newcomer food company CNPF had the most increase in cash reserves in %, but holding firm AEV and power Meralco posted the highest gains in pesos.  


Meanwhile, while SMC had the most increase in debt, it also had the most decline in cash reserves in pesos. 


Figure/Table 6 


In Q3, SMC and JGS clocked in the fastest net income growth rate.   


But the former and AC had the most gains in pesos.  


Again, the top three banks monopolized the pace of advance in the revenue growth rates.  Meanwhile, BDO and JGS recorded the highest revenue growth in pesos. 


In the end, while many companies have started to reduce their leverage, income has yet to increase to levels necessary to provide sufficient liquidity. It also reveals that the incumbent business model of the PSEi 30 hasn't been organic or productivity-driven. Instead, it represents a debt-fueled growth paradigm.


Still, the skewed distribution of debt, revenues, net income, and cash puts into the spotlight the mounting manifold risks of credit-financed growth, malinvestments, concentration, and contagion. 


Monday, November 13, 2023

The Philippine PSEi 30’s Weekly Spike of 2.88%: an Oversold, Dead Cat’s Bounce?

 Never follow the crowd―Bernard Baruch 


The Philippine PSEi 30’s Weekly Spike of 2.88%: a Dead Cat’s Bounce


The consensus will attribute the GDP, inflation, and several earnings beats to the PSEi 30 weekly 2.88% spike.  In contrast, circumstantial evidence reveals that it was an organized and concentrated effort. 


I. PSEi 30 Outperformed Asia-Pacific 


Up 2.88% over the week, the principal benchmark of the Philippine equity, the PSEi 30, upstaged its regional peers.  Only Pakistan's Karachi 100’s 4.18% topped the PSEi.  

Figure 1 


Nonetheless, Asia-Pacific remains on a risk ON mood, with 15 of 19 national bourses closing higher, averaging a return of .8%.  South Asian benchmarks posted most of this week's gains, while ASEAN indices came second. (Figure 1) 


As previously noted, expectations of the Fed's "terminal rates" have fueled a frenzy in bidding up capital market assets.  Idiosyncratic factors in the domestic economy have been responsible for the asymmetric dispersion of gains. 


II. Risk ON: The Philippine Peso and Treasuries Rallied 


Nevertheless, it is necessary to analyze the market internals to discover if this week's "boom" has "legs." 


The Philippine peso rallied by .25%.  The USDPHP closed below 56 at 55.96 last Friday—a level last seen in August 2023.  The rallying peso dampens inflation expectations.   

Figure 2 


It was a mixed week for Philippine treasuries, with yields rising on BVAL T-bills and plunging on the notes (2-10) years.  Long-term yields also slipped. (Figure 2, upper window) 


These developments have led to a bull flattener—long-term rates falling faster than the short ones (compared to end-October).  It means the local treasury markets have partially shifted their concern from inflation to the coming rate cuts or "pause."  (Figure 2, lower graph) 


bull flattener could help the stock market in the short run.  But declining rates and/or central bank rate cuts are usually in response to a substantially slowing economy or a recessionary environment.  And such an environment wouldn't be favorable to the stock market.  


III. PSEi 30: 64% of this Week’s Gains from End-Session Pumps; Economic Implications 


Beyond the headlines, one can interpret this week's outperformance by the PSEi 30 as an outcome of non-market forces.  Or, gains by the local benchmark had been forced and artificial.  


Figure 3 


This week's pre-closing pumps totaled about 110.39 points or 64% of the week's advance of 172.62 points or 2.88%.  Stunning. (Figure 3, upper graph) 


Since the stock market represents titles to capital, price pumps or dumps spur distortions or mispricing that send false signals to the economy.    


As such, the extended period of distortions results in the accumulation of misallocation of resources or a maladjusted (bubble) economy


It is also a bad sign for governance because it shows the biases of authorities in protecting vested interest groups rather than preserving the integrity of a market institution.   


Such developments also expose the inherent weakness of extant regulations, subjecting watchdogs to "regulatory capture," which means that if certain groups can "game" the market, why wouldn't they apply the same to their firms?   Doesn't this also reflect the surfacing of corporate aberrations, such as how and why one of the biggest telco firms, after it declared a 4-year "overbudget," got away clean?  


It also showcases the inflationary psychology expressed as the public's increasing high-time preference (or short-term orientation) of permitting these anomalous transactions—metastasizing these into a market norm. 


Yet, the growing popularity of top-down/centralization workaround of the financial economy erodes productivity and savings.  


So, the elites work on camouflaging these by inflating economic and financial statistics, "gaming" the financial markets, and imposing controls on "real" market prices (e.g., SRPs or price caps)—which at the day's end transforms into anti-competition moat.  


IV. More Circumstantial Evidence of Concentration and Organized Pumps: Volume of Top Brokers and Top Traded Issues 


In any case, this week's surge was, ironically, accompanied by volume stagnation.  The average daily mainboard volume (MBV) tanked by 14.33% to Php 3.075 billion--below the 2017 lows! (Figure 3, lowest chart)  

Figure 4 


An average of 61.3% of the daily MBV were from the top 10 brokers, where cross-trades from these accounted for about 12% (my estimates).  The decreasing volume has prompted a rise in the share of the top 10 brokers. (Figure 4, topmost chart) 


The top 3 largest market cap (Sy group of companies) accounted for an average of 29.9% of the MBV. The share of the three companies has been on a slo-mo uptrend since 2021. (Figure 4, middle window) 


The top 20 most actively traded issues represented had an average of 82.9% of the MBV.  It has the same uptrend dynamics as the top 3.  


Again, the slowing volume has resulted in the rise of trades in the elite group (mainly from the top 10 market cap issues). 


In the face of diminishing volume, the growing share of the elite brokers and top traded issues highlight the mounting concentration of transactional activities.   


V. Dead Cat’s Bounce: Divergent Advance-Decline Spread, Skewed Distribution of Market Cap Weights and Counteracting Role of Foreign Money 


Further, despite the headline spike, the advance-decline spread of the PSE was (believe it or not) a NEGATIVE 23 (416 advancers, 439 decliners, and 241 unchanged)!   


This data tells us that there was little diffusion into the broader market. (With that volume, why would it?) The data also suggest that retail was largely absent in the runup.  

Figure 5 


Members of the PSEi 30 benefited from last week's pump, with 22 of the 30 issues up.   But again, the top 10 market cap issues had the most gains this week.  (Figure 5, upper graph) 


Because of these, the skewed dissemination of gains only widened the differentials between the PSEi 30s largest market caps and the benchwarmers.   


As of November 10, the top 5 free float market cap issues command an incredible 47.2%, while the biggest 10 group holds 69.6% of the PSEi 30's free float weight distribution.  The PSEi 30s market cap share distribution mimics the "Power Law." (Figure 5, lowest chart) 


End-session pumps only highlight such organized and concentrated trades by the local version of China's "national team."  As a caveat, China's NT intervenes within the intraday session and barely at the closing bell.   

Figure 6 


Foreign money has typically counteracted these organized and coordinated pumps. (Figure 6, upper graph) 


But this week's net Php 86.9 million inflows suggest that foreign funds became their ephemeral ally.  


Unlike in the past, foreign flows represented non-resident funds.  In contemporary times, flows from resident-owned companies domiciled abroad or through some of their international partnerships could be categorized as "foreign."    


There you have it; last week's stock bidding ramp, backed by circumstantial evidence of concentrated and organized pumps in the face of decaying volume, barely brings about sustainable bullish signs


Seasonal factors may help, but unless there will be improvements in savings extrapolated into volume or market liquidity, this week's spike represents an oversold, dead cat's bounce.  (Figure 6, lowest graph)