Thursday, January 08, 2015

Thailand’s Parallel Universe: Record Stock Market Volume in the face of a Stagnating Economy

The consensus holds that stock markets have been about G-R-O-W-T-H.

Let us see how this applies to Thailand’s case.

From Nikkei Asia: (bold mine)
Despite political unrest and other woes, the Stock Exchange of Thailand (SET) in 2014 recorded the highest average daily trading value among ASEAN bourses for a third consecutive year.

Trading rallied on the SET and its benchmark index shot up after the military staged a coup d'etat on May 22, bolstering hopes that the economy would revive. However, some analysts believe the market may have overheated…

In 2014, average daily trading value was 45.47 billion baht ($1.38 billion), down 9% from the previous year. Although second place Singapore closed in at $1.3 billion, the SET managed to retain its top slot in ASEAN. The benchmark index gained 15% over the year.

The country had been in a political deadlock since late 2013 when anti-government protesters took to the streets in Bangkok. The economy shrank in the first quarter of 2014 sending the SET index to an 18-month low.

image

Thailand’s SET has indeed ballooned by 15% in 2014. This would have been much higher except for the December shakeout highlighted by an intraday 9% crash in the middle of that month as shown in the chart from stockcharts.com

Despite recent signs of recovery, the SET appears to remain under pressure.

image

The article suggest of a cognitive dissonance, a rally based on hope (of an economic recovery) and a denial (Thailand’s statistical economy hardly recovered through the 3Q).

The SET has risen 15% in  the face of stagnating economic performance which could have even been negative in real terms. 

Since government makes the statistics, so they can show whatever they want.

image

The important question is how has the stock market rally been funded?

The most likely answer has been by credit.

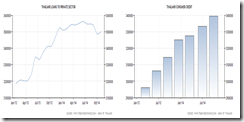
Loans to the private sector soared to a record before the third quarter slowdown. Consumer loans has also bulged to a record last September 2014. 

image

Ironically record consumer loans hasn’t translated to retail spending which on a year on year basis has remained negative in 2014 through October (albeit signs of improvements from the previous rates of deep declines).

Those issued loans haven’t been circulating to bid up consumer prices either, statistical inflation rate slumped to .6% last December! The oil price collapse may have compounded on this trend.

Yet on a month to month basis, December marks the largest contraction of consumer spending.  So even if we  go by the September-October data where consumer spending was last  reported, the same story can be derived: Thai consumers withheld spending. 

image

But those record loans has ballooned Thai’s banking system balance sheet and money supply M3. The latter possibly from the 364 billion baht stimulus announced last October.

Yet this coincides with the reports of swelling of non-performing loans.

So where has all these money issued been funneled to? 

image

The most likely answer is on the speculative markets.

Even as the economy stagnates, Thailand’s property markets has sizzled. As of the 3Q 2014 housing y-o-y gains has increased to 3.29% according to Global Property Guide. In nominal terms based 2009 baht, housing prices have been spiraling to the upside (right)!

It looks as if the average citizenry has been borrowing money to speculate on stocks and real estate based on a rationalized “hope” rather than engage in productive investments.

And the increasing use of leverage for speculation has hardly even spilled over to retail consumption.

Such developments seems like deepening signs of a massive accretion of malinvestments where more and more resources have been channeled into unproductive activities. Incipient signs of rising NPLs have been symptoms of these.

And the surge in the US dollar-Thai baht has only been exposing on the vulnerabilities of the system which recently has been vented through strains in the speculative markets.

As one can see from Thai example, it has been liquidity and credit and the subsequent confidence that drives pricing of financial markets rather than real economy. 

Take away credit and liquidity, so goes fickle confidence.  

And it would seem that the identical twins in the form of chart pattern between the Philippine Phisix and the Thai SET has diverged: temporary or new trend?

Tuesday, January 06, 2015

Phisix: Another Panic Buying Day amidst Global Stock Market Meltdown January 6th Edition

Well, this would mark the third time where, in the face of a global stock market meltdown, team OPLAN 7,400 or the index managers have pumped the index to close the trading day unchanged. 

The first was in October 16 and the second in December 15th. The operations come with the same features, pumping of select issues to buoy the index as global markets fizzled.

image

Across East Asia (table from Bloomberg), except for bourses of China, Vietnam and the Philippines, the region had mostly been bloodied from a contagion by the sharp selloff in Europe and in Wall Street. 

image

The Phisix opened today with modest losses which accrued early in the session. But apparently corrections are considered impermissible for the establishment who sees domestic stocks as a one way street. So the cabal of index manipulators went into action. They pumped up or engaged in manic bidding up of prices of exceedingly overpriced key index issues in order to ensure that confidence in the Philippine stock exchange will be maintained. 

The pumping actions lifted the index to erase about more than half of the early day’s losses going through the lunch recess. (charts from technistock.net and colfinancial

The ‘afternoon delight’ scheme went into operations but apparently wasn’t successful enough to lift the index significantly into positive territory as momentum faded during the near close as in the previous days. 

Nonetheless index managers secured the day with a “marking the close” for an unchanged Phisix.

image

Today’s pump had been centered on mainly three sectors, finance (left), commercial industrial  (middle) and holding (right). The most apparent use of the marking the close can be seen in the holding sector.

image

Combined these four issues from the aforementioned sectors constitute 18.63% of the Phisix market cap as of today’s closing. As I have been pointing out here, all it takes has been to move 3-4 issues with about 20% of market cap to manage the index.

Peso volume was moderate at Php 9.95 billion which with special block sales totaled Php 10.431 billion. Decliners led advancers 98 to 84 as foreign selling hit Php 1.144 billion (PSE Quote) partly revealing of the profit taking mode divergent from the index outcome.

It’s interesting to see the need for an artificial prop in order to achieve its bullmarket stature. Yet this has been more of a sign of desperation. 

Nevertheless, the obverse side of every mania is a crash.

Growing Number of US Dead Malls a Blueprint for the Philippines

The New York Times presents America’s growing number of “Dead Malls”.

Sample pictures from their slideshow:

image
image

From the New York Times: (bold mine)
Inside the gleaming mall here on the Sunday before Christmas, just one thing was missing: shoppers.

The upbeat music of “Jingle Bell Rock” bounced off the tiles, and the smell of teriyaki chicken drifted from the food court, but only a handful of stores were open at the sprawling enclosed shopping center. A few visitors walked down the long hallways and peered through locked metal gates into vacant spaces once home to retailers like H&M, Wet Seal and Kay Jewelers.

“It’s depressing,” Jill Kalata, 46, said as she tried on a few of the last sneakers for sale at the Athlete’s Foot, scheduled to close in a few weeks. “This place used to be packed. And Christmas, the lines were out the door. Now I’m surprised anything is still open.”

The Owings Mills Mall is poised to join a growing number of what real estate professionals, architects, urban planners and Internet enthusiasts term “dead malls.” Since 2010, more than two dozen enclosed shopping malls have been closed, and an additional 60 are on the brink, according to Green Street Advisors, which tracks the mall industry.

Premature obituaries for the shopping mall have been appearing since the late 1990s, but the reality today is more nuanced, reflecting broader trends remaking the American economy. With income inequality continuing to widen, high-end malls are thriving, even as stolid retail chains like Sears, Kmart and J. C. Penney falter, taking the middle- and working-class malls they anchored with them.

“It is very much a haves and have-nots situation,” said D. J. Busch, a senior analyst at Green Street. Affluent Americans “will keep going to Short Hills Mall in New Jersey or other properties aimed at the top 5 or 10 percent of consumers. But there’s been very little income growth in the belly of the economy.”
Excess capacity as main culprit…
One factor many shoppers blame for the decline of malls — online shopping — is having only a small effect, experts say. Less than 10 percent of retail sales take place online, and those sales tend to hit big-box stores harder, rather than the fashion chains and other specialty retailers in enclosed malls.

Instead, the fundamental problem for malls is a glut of stores in many parts of the country, the result of a long boom in building retail space of all kinds.

“We are extremely over-retailed,” said Christopher Zahas, a real estate economist and urban planner in Portland, Ore. “Filling a million square feet is a tall order.”

Like beached whales, dead malls draw fascination as well as dismay. There is a popular website devoted to the phenomenon — deadmalls.com — and it has also become something of a cultural meme, with one particularly spooky scene in the movie “Gone Girl” set in a dead mall.

image
The numbers…
About 80 percent of the country’s 1,200 malls are considered healthy, reporting vacancy rates of 10 percent or less. But that compares with 94 percent in 2006, according to CoStar Group, a leading provider of data for the real estate industry. 

Nearly 15 percent are 10 to 40 percent vacant, up from 5 percent in 2006. And 3.4 percent — representing more than 30 million square feet — are more than 40 percent empty, a threshold that signals the beginning of what Mr. Busch of Green Street calls “the death spiral.”

Industry executives freely admit that the mall business has undergone a profound bifurcation since the recession.
See the slideshow and the complete article here.

The Philippine counterpart has been been in a frenetic race to build all sorts of malls (major malls, strip malls, integrated resorts) to become possibly the shopping mecca of the world.

For a country that has a per capita GDP of $6,597 (IMF, 2013), the industry has been erecting capacity more than the US whose per capita is $53,001 as I wrote back of the Philippine shopping mall bubble in 2013.

It is as if Philippine consumers have limitless pockets to spend, for the mainstream to lavishly speculate and channel enormous amount of resources on them.

image

Yet the feverish race to build capacity comes in the face of declining statistical household consumption growth (based on 3Q 2014 NSCB data).

The decline in household spending comes even before the surge in statistical inflation rates in the first half of 2014. 

image

Interestingly, inflation rates have been down 2.7% in December with month on month changes at –.2% based on tradingeconomics data; NEDA data

Consumer prices even declined 0.2 percent in December from 0.1 percent drop in November notes the Tradingeconomics Blog. CPI Deflation! Spending by domestic consumers have been contracting!!! Why???

image

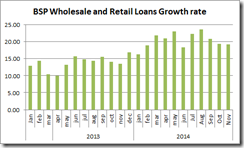
Yet the recent mall spending may have become reliant on the few that has access to the banking system where consumer loan growth rate continues to balloon (based on BSP November data).

image

Meanwhile, the growth contribution of the industry to the statistical economy has flat-lined, with a likely seasonal spike in wholesale trade in 2Q that petered out in the 3Q 2014. (data from NSCB

image

Curiously the frantic supply side build up has been financed by surging growth of bank loans.

image

And interestingly too, soaring systemic banking loan growth rates comes in the face of collapsing money supply growth (data from BSP)! This has been consistent with the output of the December statistical consumer inflation data.

Where has all the money from credit growth been funneled to? Debt IN-debt OUT? What happened to the Philippine consumption boom story?!

So slowing consumption by Philippine households in the face of sustained bank financed shopping mall capacity buildup translates to excess capacity.

When the economic slowdown becomes pronounced or when the recession arrives (it will), the US version of “dead malls” will also emerge in the Philippines. 

People hardly learn from either history or from developments in other nations.

As Oil Prices Collapse Anew, Tremors Hit Global Stock Markets

Financial market crashes have become real time.

image

Well, last night oil prices plummeted again. The European Brent crashed 5.87% to 53.11 per bbl while the US counterpart the WTIC dived 5.42% to close BELOW $50 or $49.95 a bbl.

The chart above from chartrus.com reveals that the present levels of US WTIC have reached 2009 post Lehman crisis levels.

Then, oil prices responded to deteriorating economic and financial conditions. Today, oil prices seem to lead the way.

Collapsing oil prices hit key stock markets of major oil producers, such as the Gulf Cooperation Council, quite hard.

image

The recent sharp bounce that partly negated losses from the harrowing crash that began last September seem to have been truncated as Dubai Financial, Saudi’s Tadawul, and Qatar’s DSM suffered 3.35%, 2.99% and 1.91% respectively (charts from Asmainfo.com) last night.

In short, bear market forces seem as reinforcing its presence in these stock markets.

image

Yesterday’s oil price meltdown affected least Oman’s Muscat and Bahrain Bourse. Nonetheless, again bear markets have become a dominant feature for GCC bourses.

A prolonged below cost of production oil prices will translate to heavy economic losses for Arab oil producing states. Such will also entail political repercussions as welfare programs of these nations depend on elevated oil prices as discussed here.  This will also have geopolitical ramifications.

Incidentally, as I previously pointed these nations play host to a majority of Philippine OFWs. 
More than half or about 56% of OFWs according to the Philippine Overseas Employment Administration (POEA) have been deployed to this region. Will OFWs (and their employers) be immune from an economic or financial crisis? This isn’t 2008 where the epicenter of the crisis was in the US, hence remittances had been spared from retrenchment. For this crisis, there will be multiple hotbeds.
So a financial-economic collapse (possibly compounded by political mayhem) in GCC nations may impede any remittance growth that could compound on the travails of the Philippine bubble economy.
It’s not just in emerging markets, though, last night Europe’s stock markets likewise convulsed.

image

Part of the concerns had not only been about oil but about a GREXIT or Greek default from tumultuous Greek politics based on the failure to muster majority support for a presidential candidate.

Incredibly German’s DAX was slammed 3% (table above from Bloomberg).

Crashing Greek stocks lost another 5.63% yesterday.

image

Apparently broad based selling also buffetted near record US stock markets.

The XLE Energy Sector endured another tailspin down by 4.19%. Yesterday’s clobbering only fortified the bear market forces affecting the US energy sector which has diverged from her peers.

I propounded that the slumping energy sector will eventually impact the rest of the markets. Divergence will become convergence; periphery to the core.

Remember, the reemergence of heightened financial volatility comes in the face of October’s stock market bailout via stimulus implemented by ECB, BoJ-GPIF, and the PBOC.

This implies that the soothing or opiate effects, which had a 3 month window, has been losing traction. 

Will Ms. Yellen come to the rescue???

Sunday, January 04, 2015

The Canary in the Coal Mine for the Casino Bubble: Macau’s Casino Woes Deepens

2014 has not been a good year for Macau’s casinos.

image

From Bloomberg:
Macau’s casinos recorded their worst year, ending a decade of expansion that turned the former Portuguese enclave into the world’s biggest gambling hub. More tough times are ahead.

Casino revenue in the city fell 2.6 percent to 351.5 billion patacas ($44 billion) in 2014, after a record 30.4 percent monthly drop in December, according to figures from Macau’s Gaming Inspection and Coordination Bureau today.
That sharp 40.3% February 2014 monthly gross revenue growth served as the peak, from which rapidly deteriorated through the year. Chart from Macau’s Gaming Inspection and Coordination Bureau

Media blames this on anti-corruption crackdown. Again from the same article.
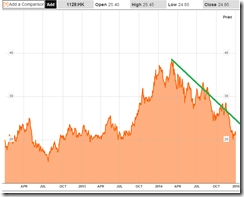
Chinese President Xi Jinping’s bid to catch “tigers and flies” in an anti-corruption drive and weaker economic growth means Macau may face shrinking revenue until at least mid-2015, when new resorts open. The crackdown has deterred high rollers who account for two-thirds of Macau’s casino receipts, and wiped out about $73 billion in market value of companies including Wynn Macau Ltd. (1128) and SJM Holdings Ltd. last year…
Also on money flows to stealth money flows…
Macau’s government has been curbing money flows to the territory over concern that illegal funds are being taken out of the mainland. It is restricting the use of China UnionPay Co.’s debit cards and its hand-held card swipers at casinos. Further clampdowns are expected with the help of banks.
Let us put this in perspective. If indeed Macau’s casinos have only served as conduits for stealth transfers or 'capital flight' then only part of that money would have been funneled to the casinos, the rest would have moved elsewhere. This means Macau’s casinos should hardly have boomed. 

But Macau’s previous boom most likely highlights easy money debt financed spending activities with capital flight as a subordinate cause.

Some have even suggested that such money flows has funded record high inflows to US real estate and perhaps rechanneled gambling activities to the US. 

image

But actions of stocks of the US gaming industry suggests otherwise.

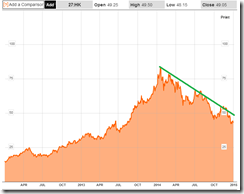
The 47 component Dow Jones Gambling index has swiftly capsized into a bear market since its peak in March. This would mark a real time example of how mania morphs into a collapse.

Since part of the US gambling index incorporates Macau exposure by US firms, then part of the decline may be attributed to Macau’s morose fate.

Apparently domestic (US) operations have failed to offset external conditions which explains the accentuated contagion effect.

But gambling industry woes hasn’t been just about Macau. 

image

Singapore’s Genting’s G13.SI stocks has halved, since its October 2011 peak. This year’s decline has only punctuated the ongoing hemorrhage.

image

And when considering Genting’s competition, the Marina Bay Sands operated by Las Vegas Sands whose stocks has been shaved by a third, there seems hardly any difference.


So has the Chinese government’s crackdown on the political opposition bannered as ‘anti-corruption’ also spread to Singapore?

Interestingly, Macau’s casino operators seem to be focusing diverting expansion towards the leisure industry. Back to the Bloomberg report: 
Casino companies including Sands China and Galaxy are shifting resources from high rollers to lure more vacationing Chinese and other mass-market gamblers by building malls, theaters, restaurants and hotels.

New project openings starting in mid-2015 with Galaxy’s second-phase expansion of its resort on the Cotai Strip may help underscore a market revival, by targeting tourists who’re seeking a broader holiday experience in addition to gambling, according to CLSA’s Fischer.
In Asia, there seems to be an intensive race to build capacity to chase after the Chinese consumers/gamblers as seen by grand projects casino-leisure integrated resorts, not only in Macau but also in Vietnam, South Korea and the Philippines.


But the real reason for the casino industry’s weakness as I previously wrote:
The reality is that China’s sputtering economy has been reducing demand for the region's casinos. Political persecution of the opposition (via crackdown on graft) represents only the icing on the cake. Add to this the slowing regional economic growth which should exacerbate demand sluggishness.

On the supply side, zero bound has led to casino operators to overestimate on demand, thus the region's overcapacity which has most likely having been funded by cheap debt.

Now the chicken comes home to roost.
And as I also pointed out earlier, the Philippine counterparts has racked up a colossal Php 45-50 billion of debts to finance grand projects. 

If those Chinese gamblers don’t come this year, if the domestic economy continues with its downshifting momentum and if political financial elites don’t patronize these entities enough to provide them financial viability, those humongous debts will come into the spotlight. This should make 2015 very interesting!

Anyway Macau’s stocks as the canary in the coal mine

image


image


image


image

Sands China Ltd. (HK: 1928)

image

Wynn Macau Ltd. (HK: 1128)

image

SJM Holdings Ltd. (HK:880) owner of Grand Lisboa

The obverse side of every mania is a crash.
image

Or has it been that gambling has turned into household activity where Chinese punters bid up frenetically stocks prices!

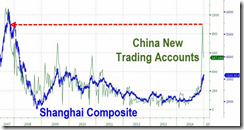
The week prior to the 2014's end, the Zero Hedge reports (bold and italics original) “a stunning 900,000 new stock trading accounts opened - the most since October 2007 (right before the Shanghai Composite collapsed 70% in the following 9 months)

As revealed above, market crashes have become real time events.

Caveat emptor.

Saturday, January 03, 2015

The Real Economy versus Statistical GDP: How Reducing GDP Increases Economic Growth

At the Ludwig von Mises Institute, Austrian economist Joseph Salerno differentiates statistical GDP with the real economy and explains why a reduction of statistical GDP INCREASES real economic growth (italics original, bold mine)
Recently, the Financial Times published an article containing charts displaying the correlation between government spending and real GDP growth.1 Based on these correlations, the author of the article, Matthew Klein, comments: “It’s no secret that spending cuts (and tax hikes) have retarded America’s growth for the past four years.” He goes on to argue that from mid-2010 to mid-2011, the reduction in government spending in the US shaved 0.76 percent off of the economic growth rate. Klein conjectures that this slowdown in the growth rate caused a level of real GDP today that is 1.2 percent less than it would have been in the absence of this exercise in “austerity.” He also points out that since 2012 almost all of the depressive effect on real GDP growth of government austerity was the result of the reduction in military spending. While some of the reduction was beneficial, Klein opines, “some of it represents a self-inflicted wound.” Indeed it may represent a self-inflicted wound on the Federal government, but in that case it benefits the private economy. 

Now it is certainly true that a reduction in real government spending causes a reduction in real GDP, as it is officially calculated. But contrary to Mr. Klein, the reduction in government spending does not retard the growth of production of goods that satisfy consumer demands and, in fact, most likely accelerates it. In addition, real incomes and living standards of producers/consumers in the private sector rise as a direct result of the decline in government spending. The reason for this seeming paradox lies in the conventional method used to calculate real output in the economy. Let me explain with a simple example.
The Problem with Calculating GDP
Let us suppose a simple island economy in which the private sector produces 1,000 apples per year. Suppose further that the government of the island taxes the private producers 200 apples per year to sustain its military as it invades a neighboring island in order to neutralize a “potential terrorist threat.” According to standard national income accounting, which is deeply rooted in Keynesian economics, real GDP is calculated as 1,200 apples: the 1,000 (pre-tax) apples either currently consumed by the producers, invested by them in planting new apple trees to provide for future consumption, or paid out in taxes plus the 200 apples expended on the island’s military which is busily producing the “public good” of national defense. In other words, the island’s real GDP2 includes the 1,000 apples voluntarily produced by the private sector plus the “apple value” of national defense which is valued at its cost of production, that is, the 200 apples of compulsory tax revenues spent on conquering the adjacent island. 

Now let us assume that by the next year the conquest has been completed and the island allegedly harboring the terrorists has been pacified. Our island’s government decides to cut its military and reduces taxes by 100 apples. All other things equal, real GDP falls from 1,200 to 1,100 apples, since national defense now contributes only 100 apples worth of government services to the 1,000 apples produced by the private sector. But there is the rub. The apples were voluntarily produced and therefore were demonstrably more highly valued than the resources (effort and time) used to produce them. In sharp contrast, there is no evidence whatever that the private producers/consumers valued the military services supplied by government more highly than the cost of producing them or even that they valued them at all. The reason is because government military spending was financed by the coercive extraction of resources from the private sector, whose members had no choice and therefore expressed no valuations in the matter.
No Way to Calculate Real Value of Tax-Financed Amenities
The same conclusion holds for any coercively-financed venture, such as government construction of an island infirmary. In the absence of voluntary production and exchange, there is no meaningful way of ascertaining the value of goods and services. The government investments and services may have some value to private consumers, but there is no objective scientific method of gauging what that value is. Indeed, assuming government wastes at least 50 percent of the resources expended, the net benefit to consumers of government production would be zero.
Using “Gross Private Product” Instead
So for these and other reasons, national income accounting on Austrian principles would exclude government expenditures in calculating the total production of the economy. Thus in our island economy real output or what Austrians, following Murray Rothbard, call “Gross Private Product” or “GPP”3 is equal to only the 1,000 apples produced by the private sector and excludes government expenditures of 200 apples on the provision of military services (or an infirmary).4 But the 1,000 apples of GPP actually overstates the resources left at the disposal of the private sector, because 200 apples were forcibly siphoned off from potentially valuable private consumption and investment activities to fund government activities that can only be judged as wasteful from the point of view of the original producers of those resources. In this sense the 200 apples paid in taxes can be seen as a “depredation” on the private economy as measured by GPP.5 

Netting out this depredation we then arrive at what Rothbard calls “private product remaining in private hands” or PPR. PPR equals GPP minus total depredation (i.e., government spending).6 In our hypothetical island economy PPR is therefore 800 apples (= 1,000 apples – 200 apples). Thus government spending should not be added to private production but rather subtracted from it to get a sense of the living standards of private persons engaged in productive economic activity.7
Reducing Taxes and Spending Increases Welfare
Based on the above analysis, when the island government cuts military spending by 100 apples, assuming no other changes, it does indeed reduce real GDP from 1,200 to 1,100 apples. However, from the Austrian perspective, real output of valuable goods remains constant at GPP = 1,000 apples, while the economic welfare of producers is significantly enhanced because depredation on their output falls by 100 apples causing PPR to rise from 800 to 900 apples! But this is not all. A portion of the tax cut of 100 apples will be devoted to investing in the seeding of new trees, thus increasing the capital sock and accelerating economic growth over time.

Even in the short run, there is likely to be positive growth of GPP due to “supply-side effects.” For instance the cut in marginal tax rates increases the opportunity cost of leisure and spurs producers to work more hours. The private labor force further expands with the influx of former soldiers. Thus it may turn out that GPP increases from 1,000 to 1,075 apples (and, consequently, PPR from 800 to 975 apples). In this scenario the 100-apple cut in government expenditure would be partially offset by the 75-apple rise in private product so that the GDP statistic would register a smaller decline then previously calculated, from 1,200 to 1,175 apples. Despite the decline of the meaningless GDP statistic, however, the result would be a boon for the private economy, as apple production, the real incomes and living standards of apple producers, and the capacity to produce apples in the future all improve.

From the Austrian standpoint, then, the path back to immediate economic health and sustainable long-term growth is massive tax and spending cuts anywhere and everywhere. Yes, this is austerity — but only for the government. Slashing political depredation on the private economy will release a cornucopia of current and future benefits on private consumers. And these benefits are virtually cost free because the resources consumed by the government budget are almost all a pure waste from the point of view of the private producers of those resources.

Deeply slashing the bloated budget of the US government by, say, 25 percent would not only cure the sham deficit problem, but more importantly it would rapidly reverse the trend of the declining middle class and powerfully and permanently stimulate the anemic long-run US economic growth rate. For the real problem is not the size of the budget deficit per se, but rather the depredation on gross private production contributed by the overall federal budget.8 Thus a US government budget of $4 trillion and a deficit of $500 billion represents far greater depredation on and is far more harmful to the private economy then a budget of $3 trillion partly financed by a deficit of $1 trillion.
  • 1.A report on the article that includes some of the charts may also be found on an ungated website here.
  • 2.For simplicity, we ignore capital depreciation in this in this simple island economy, assuming that the apple trees once planted live forever never needing to be maintained or replaced. Thus GDP = NDP.
  • 3.Once again, absent depreciation, GPP = NPP.
  • 4.The Austrian approach to national income accounting was pioneered by Murray Rothbard, pp. 339–48 and Rothbard, pp. 1292–95.
  • 5.I am using the term “depredation” to mean the forcible taking of the property of another, whether legal or not, and for whatever purpose. There is precedent for this usage in older law codes. In French law, “depredation” denoted “the pillage that is made of the goods of a decedent.” Old Scottish law defined “depredation” as “the (capital) offence of stealing cattle by armed force” (Lesley Brown, ed., The New Shorter Oxford English Dictionary on Historical Principles, 4th ed. [New York: Oxford University Press, 1993], p. 639).
  • 6.Actually, depredation is calculated as government spending or tax revenues, whichever is greater (Rothbard, p. 340). But since the US government has rarely run a surplus since World War 2 we can ignore this complication.
  • 7.Robert Batemarco uses Rothbard’s approach to calculate GPP, PPR and PPR/Employment (nongovernment) for the years 1947–83 to track the movement of private living standards during these years.
  • 8.To calculate total depredation on the private economy, of course, state and municipal spending must be accounted for.

ECB Mario Draghi’s Keynesian Fallacies

At the Mises Canada blog, Austrian economist Patrick Barron censures ECB’s Mario Draghi’s justification for launching QE (italics mine)
From today’s Open Europe news summary:
Draghi: ECB ready to initiate QE to counter low inflation
In an interview with Handelsblatt, ECB President Mario Draghi warned that persistently low inflation in the Eurozone meant that “the risk that we do not fulfill our mandate of price stability is higher than six months ago”. Draghi reiterated that the ECB was ready to step in with a programme of Quantitative Easing, noting that “We are in technical preparations to adjust the scope, speed and composition of our measures for early 2015.”
ECB President Mario Draghi’s latest statement is full of Keynesian fallacies, to wit:

1. That price stability is a worthy goal. No, monetary stability is essential, so that prices may reflect the true preferences and productive limitations of the market in order to allocate scarce resources to their most important purposes as dictated by the market.

2. That low inflation or even deflation is harmful. No, in a economy with increasing productivity prices will fall, benefiting all of society. Preventing prices from falling or, as ECB President Draghi desires, encouraging price inflation, causes the Cantillon Effect, whereby early receivers of the new money benefit at the expense of later receivers. Continuing monetary expansion will cause the Austrian Business Cycle.

3. That GDP is a good measure of an economy’s success. if this were the case, then Zimbabwe would be a huge success story. GDP simply adds up the monetary prices of goods sold, so higher prices on the same or even slightly lower volume of sales necessarily will be interpreted by Keynesian economists as success.

4. That monetary expansion can spur an economy to greater prosperity. If this were the case, then counterfeiters would be doing all of us a big favor. Monetary expansion distorts the structure of production, sending more resources to the expansion of enterprises further removed from final consumption. This malinvestment eventually will be revealed by losses in these industries. The current collapse of commodity prices and anticipated bankruptcies in commodity production industries are a good illustration of this process and are attributable to massive monetary expansion by central banks since the 2008 great recession.
Let me add J M Keynes quote on inflation: (bold mine)
Lenin is said to have declared that the best way to destroy the capitalist system was to debauch the currency. By a continuing process of inflation, governments can confiscate, secretly and unobserved, an important part of the wealth of their citizens. By this method they not only confiscate, but they confiscate arbitrarily; and, while the process impoverishes many, it actually enriches some. The sight of this arbitrary rearrangement of riches strikes not only at security but [also] at confidence in the equity of the existing distribution of wealth.

Those to whom the system brings windfalls, beyond their deserts and even beyond their expectations or desires, become "profiteers," who are the object of the hatred of the bourgeoisie, whom the inflationism has impoverished, not less than of the proletariat. As the inflation proceeds and the real value of the currency fluctuates wildly from month to month, all permanent relations between debtors and creditors, which form the ultimate foundation of capitalism, become so utterly disordered as to be almost meaningless; and the process of wealth-getting degenerates into a gamble and a lottery.

Lenin was certainly right. There is no subtler, no surer means of overturning the existing basis of society than to debauch the currency. The process engages all the hidden forces of economic law on the side of destruction, and does it in a manner which not one man in a million is able to diagnose.
There can be no general prosperity on policies of “legal plunder” channeled through money manipulation. Since there is no such thing as free lunch, central banking’s invisible confiscatory policies eventually unravel. Real time market crashes have been symptoms of these.