Christmas is a time when kids tell Santa what they want and adults pay for it. Deficits are when adults tell the government what they want and their kids pay for it—Richard Lamm
In this issue
The “Surprise‟ Philippine 5.9% Q3 GDP Powered by Deficit-Spending and Bumped by a Statistical Facade
I. 5.9% Q3 GDP: A Statistical Façade
II. An Across-the-Board Slump in the Expenditure Side GDP; Lowest Household Spending Since Q2 2021
III. Government or Deficit Spending Dominated Q3 GDP
IV. Industry GDP: Finance Flexes Muscles, Share of Transport, Food and Accommodation and Professional Services Increased
V. Real Estate Q3 GDP Bounced as Economic and Financial Concentration Risk Mounts
VI. Agriculture August Employment Boost Unraveled; 48% Self-Poverty Rate versus the 5.9% GDP: Cui Bono?
The “Surprise‟ Philippine 5.9% Q3 GDP Powered by Deficit-Spending and Bumped by a Statistical Facade
The Philippine Q3 GDP “surprised‟ with a 5.9% beat from public spending and statistical sleight in the face of a sweeping downdraft in the broader economy.
I. 5.9% Q3 GDP: A Statistical Façade
All hail, the Q3 GDP! Not.
Yahoo Bloomberg; November 9: The Philippine economy remained on track to post Southeast Asia’s quickest expansion this year after a stellar third-quarter performance, although doubts persist amid softer consumer spending and a decline in investment. Gross domestic product in the three months through September rose 5.9% from a year earlier, the Philippine Statistics Authority said Thursday. That’s the first acceleration since the 7.7% pace clocked in the year-ago quarter. It’s also faster than the 4.7% median estimate in a Bloomberg survey and 4.3% growth in the second quarter. (bold added)

Figure 1
Even this media report seems troubled in explaining the embedded incoherence of the 3Q GDP.
And once again, the consensus has missed badly the pin-the-tail-on-the-donkey exercise of guessing on the GDP guess.
Well, "Southeast Asia’s quickest expansion" rests on the foundations of a statistical charade.
First, peso-based Q3 nominal (N)GDP and real GDP were lower than the Q2 GDP. (Figure 1, topmost chart)
Lower NGDP signified slower aggregate spending, but the impact of the plunge in Q3 CPI (inflation) via the implicit index (deflator) magnified the real GDP. (Figure 1, middle window)
Second, that the Q3 GDP remained below the exponential trend line reinforced the second post-pandemic trend line or the path of lower GDP. However, the "low" base effects amplified the % growth.
There was NO outgrowth in the 3Q GDP based on the trend lines.
Regardless of consensus opinion, the coming GDPs will likely bounce within the range of the second trendline marked by the ceiling (exponential trend) and the floor (trend support). The percentage change will be a function of base effects.
II. An Across-the-Board Slump in the Expenditure Side GDP; Lowest Household Spending Since Q2 2021
Let us delve more into the statistical economy.
From the expenditure perspective, it was an across-the-board slump in the 3Q GDP.
Despite the surge in Construction GDP, Real capital formation contracted -1.6% in the 3Q. Durable goods, which account for capital equipment, plummeted from 10.5% to 1.7%. (Figure 1, lowest graph)
Exports slumped from 4.4% to 2.6%. Imports also contracted by 1.3% in Q3.
Services exports, which grew by 11.4%, cushioned the decline of the Export GDP. Services imports, which expanded by 27.7%, also tempered the shrinkage of the Import GDP.
Capital formation, Exports, and Imports GDP have been on a downtrend since the reopening bounce of Q2 2021.

Figure 2
In the meantime, government construction, which jumped by 27% in Q3, also moderated the decrease in Real capital formation. (Figure 2, topmost chart)
Since 2013, the government's share of the industry's output has been on an uptrend. Or, the construction GDP tells us that more and more activities are being diverted towards political projects.
There is more.
For the consensus, household spending is the pillar of the GDP since it commands a majority.
Sadly, Real Household consumption GDP moderated to 5.0%, which accounted for the slowest increase since Q2 2021! And to reinforce this slowdown, the trade GDP grew by 5.0%, which likewise represented the slowest increase since Q2 2021! (Figure 2, middle graph)
Why the decrease in consumption?
The Universal-Commercial Bank’s consumer credit growth has been raging (as of August). (We defer this discussion to another time since the BSP has yet to release the September data.)
Yet, what happened to the "ribbon-cutting" or Foreign Direct Investments (FDI)?
August FDI grew by .34% and contracted 12.9% YTD. Or could it be the overstatement of the FDI because a significant majority has been in debt? From January 2016 through August 2023, the average share of debt to the total FDIs was 69.9%. (Figure 2, lowest chart)
Interestingly, a former economic official seems puzzled by the struggle "to break out of a long-running $10 billion a year ceiling on foreign direct investment (FDI)."
In our humble opinion, this struggle represents a lack of competitiveness, a function of suffocating political barriers.
Stagnation in investments means slower capital replacement and expansion over time. In turn, slower expansion means reduced consumption.
So, what will be the source of the GDP in the coming period (year/s)?
III. Government or Deficit Spending Dominated Q3 GDP
If all aspects of the expenditure GDP underperformed, what sector boosted the 3Q GDP?
We suggested this last October:
Remember, authorities promised to do something to recover from the 2nd Quarter GDP bombshell.
…
In 1H, Deficit-to-GDP remained at a lofty 4.8%. Unless the GDP picks up materially (ironically, driven by these expenditures), this ratio could expand. The increasing dependence on fiscal measures to boost the GDP translates to "fiscal dominance." (Prudent Investor, October 2023)

Figure 3
Briefly, government or deficit spending.
Deficit-to-GDP rose from 4.8% in Q2 to 7.5% in Q3. It was 5.71% in nine months of 2023. (Figure 3, topmost chart)
Deficit-to-GDP soared from public expenditure, whose share of the GDP spiked to 24.5%, the highest level since Q4 2021. (Figure 3, second to the top window)
Is the economy in recession? Why is the government exercising "fiscal dominance?"
The government admitted to this.
GMANews, November 9: In a statement, the Department of Budget and Management (DBM) said the faster state spending “contributed a significant 36% or 2.1 percentage points of the Philippines’ remarkable 5.9% GDP growth in the third quarter of 2023.” (bold mine)
36%! That is direct spending alone, which discounts all private sector spending like PPPs or industries dependent on a political clientele base!
So, what happens when the slowdown—or worse—a "double dip" recession emerges?
Will the deficit-to-GDP explode to another unprecedented scale?
And yet the mainstream believes that politically based consumption would boost household spending?
Do they not realize that what the government spends is always taken from the public?
As such, the more the government spends, the fewer resources available for the private sector: the crowding out effect.
The household spending to government ratio has been in a long-term downtrend since 2005. (Figure 3 second to the lowest graph)
Seen from a different angle, the rise in the share of public spending GDP has taken its toll on consumers—shown by the opposite direction of trends. (Figure 3, lowest chart)
And since insufficient production would back this, rising prices (inflation) would be a natural consequence.
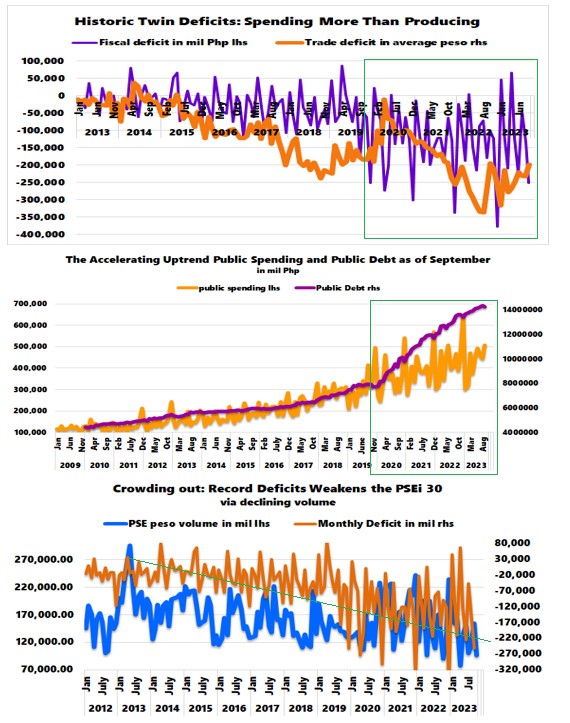
Figure 4
Further, imports would have to rise to cover this deficit, putting pressure on the Philippine peso (via current account). (Figure 4, topmost chart)
Also, because financing of deficits translates to competition with non-financial firms and banks for savings of the households, this would put pressure on liquidity, which, therefore, should lead to higher rates as evidenced by the accelerating uptrend in public spending and debt.
Moreover, this intense competition for savings will also affect the stock market volume and, therefore, the performance of the PSE.
And celebrating a lower public debt-to-GDP exposes the travesty of inflating the GDP.
Yet, the cost of deficit spending-fueled GDP: Today's spending will have to be paid for by taxpayers and peso holders tomorrow or in the future.
There is no such thing as a free lunch (forever).
IV. Industry GDP: Finance Flexes Muscles, Share of Transport, Food and Accommodation and Professional Services Increased

Figure 5
From the industry side, aside from construction, the natural winners were the financial industry led by the banks.
The financial industry has been a principal financier of public spending—via net claims on central government (NCoG). Such operations have helped push liquidity into the system and have financialized the economy.
Finance GDP surged from 5.3% in Q2 to 9.5% in Q3, while its share rose from 10.2% to 10.4%.
Though the GDP has slowed for the previously blazing transport sector, its share continues to recover lost ground. The factors described the lesser food and accommodation sector. The transport GDP moderated from 17.5% to 11.6%, while the food and accommodation GDP slid from 27.2% to 20%. The share of transport GDP increased from 3.2% to 3.8%, whereas the share of food and accommodation GDP likewise inched up from 1.6% to 1.8%.

Figure 6
Professional and Business Services GDP also slipped from 6.7% to 6.6%, while its share rose from 6.7% to 6.9% in Q3. Has the intensifying politicization or centralization of the economy promoted the business interest of the legal industry? (Figure 6, topmost chart)
V. Real Estate Q3 GDP Bounced as Economic and Financial Concentration Risk Mounts
Finally, the real estate sector, which GDP increased from 2.9% to 4.2%, was a surprise beneficiary of the Q3 GDP.
The industry's share also bounced from 5.3% to 5.9%, reaching its highest since Q3 2022. Nonetheless, real estate's contribution to the National Account remains on a long-term downtrend since 2004. (Figure 6, middle window)
All that said, four sectors, namely finance, real estate, construction, and trade accounted for nearly half or 46.4% of the real GDP while Universal and Commercial bank lending to them represented 44.72% last August, exhibiting the mounting economic and financial concentration risks.
So, embellishing the GDP only disguises such risks.
VI. Agriculture August Employment Boost Unraveled; 48% Self-Poverty Rate versus the 5.9% GDP: Cui Bono?
Two last aspects.
Government data produces bizarre logic.
We critiqued the August labor data that suggested that the substantial boost in employment rates came from the agricultural sector.
This September, the same sector was one of the three biggest to shed jobs.
ABSCBN News, November 8: PSA data showed that accommodation and food service activities added 608,000 jobs during the month; followed by administrative and support service activities which added 535,000; and construction which added 481,000. Manufacturing meanwhile led the sectors with the largest job losses at 888,000 jobs lost. It was followed by wholesale and retail trade, repair of motor vehicles and motorcycles which lost 722,000 jobs. Agriculture and forestry also lost 649,000 jobs. (bold mine)
With a Real GDP of .9% in Q3, the agri sector barely grew. It shows that the alleged improvement could have been inaccurate (so the retrenchment?) Incredible.
Nonetheless, if correct, the September job gains in food and accommodation sector have occurred as its Q3 GDP has eased. Should expected growth fail to materialize, these gains could be bound for a reversal.
Job losses in the manufacturing sector and trade exhibit the slowdown in their respective GDPs.
Lastly, how does this self-poverty survey square with the 5.9% GDP?
Inquirer.net, November 1: According to the SWS, 48 percent of Filipinos rated themselves as poor as of September, an increase from the 45-percent self-poverty rate the SWS noted in June. “Compared to June 2023, the percentage of Poor families rose by 3 points from 45 percent, while Borderline families fell by 6 points from 33 percent, and Not Poor families rose by 3 points from 22 percent,” said the SWS in its report. (bold added)
If nearly half of the population sees themselves as poor, who benefits from the GDP?
Our humble two cents: this reflects the overstatement of the GDP. It also exhibits the principal beneficiaries of political spending; viz., the political elites, the bureaucracy, the private sector attached to them, and/or the politically connected economic and financial elites (most of these demonstrated above).
At the day's end, there's a steep price to pay for inflating the GDP to sustain the political boondoggles financed by cheap money.
This closing quote comes from the legendary Ayn Rand:
Inflation is not caused by the actions of private citizens, but by the government: by an artificial expansion of the money supply required to support deficit spending. No private embezzlers or bank robbers in history have ever plundered people’s savings on a scale comparable to the plunder perpetrated by the fiscal policies of statist governments. (Rand, 1962)
____
References:
Prudent Investor BSP’s Off-Cycle/Emergency Hike was about Protecting Deficit Spending via the Philippine Peso October 29, 2023
Ayn Rand, “Who Will Protect Us from Our Protectors?” The Objectivist Newsletter, May 1962, 18 AynRandLexicon